Ecological Archives E096-072-A1
Petr Pyek, Ameur M. Manceur, Christina Alba, Kirsty F. McGregor, Jan Pergl, Kateřina tajerová, Milan Chytrý, Jiří Danihelka, John Kartesz, Jitka Klimeová, Magdalena Lučanová,10 Lenka Moravcová, Misako Nishino, Jiří Sádlo, Jan Suda, Lubomír Tichý, and Ingolf Kühn. 2015. Naturalization of central European plants in North America: species traits, habitats, propagule pressure, residence time. Ecology 96:762774. http://dx.doi.org/10.1890/14-1005.1
Appendix A. Parsimonious regression tree, magnitude of the coefficients, and the probability of significance for parsimonious models.
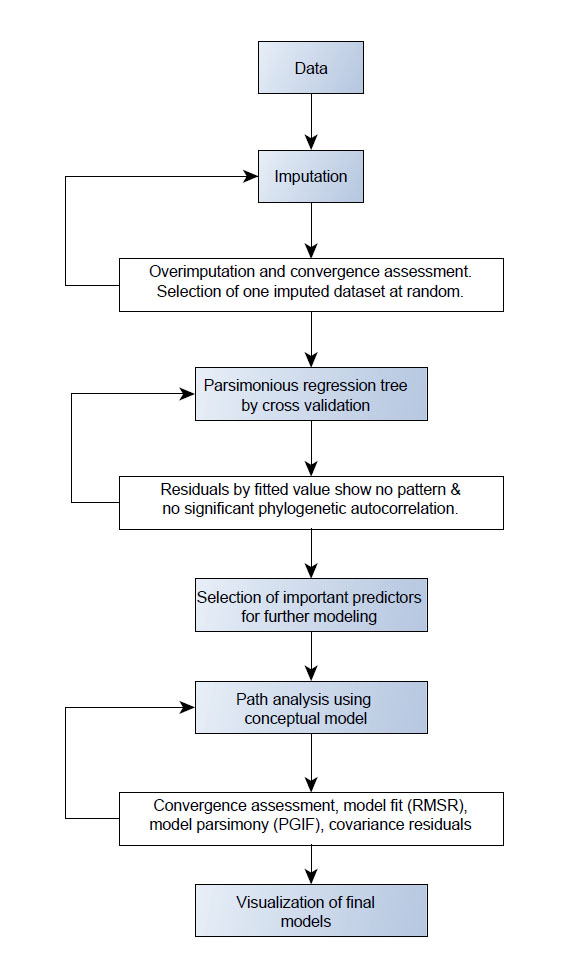
Fig. A1. Flowchart of the steps of statistical analysis. In white: steps which require quality control and are iterative (repeated until criteria met). Abbreviations: RMSR, root mean square residuals (a measure of model fit), PGIF: parsimony goodness of fit index (a measure of parsimony).
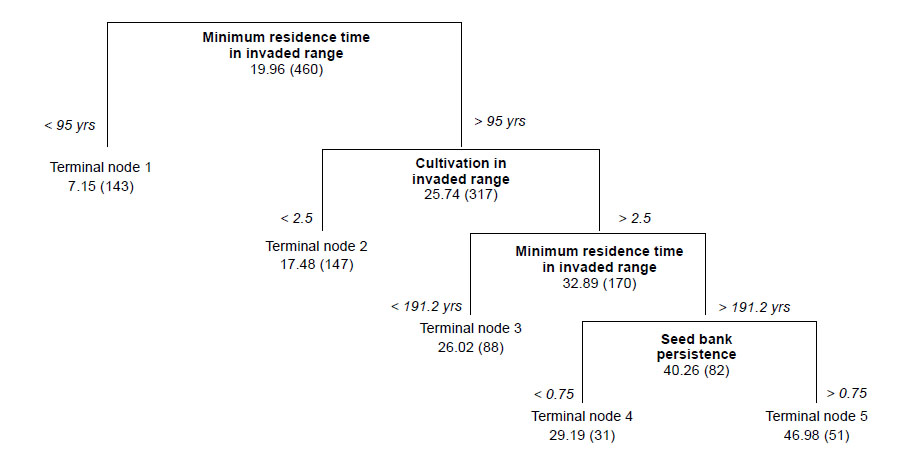
Fig. A2.Parsimonious regression tree to predict the number of North American regions invaded based on all traits (R² = 0.43). Average number of regions and, in brackets, the number of species in the group are shown for each terminal node.
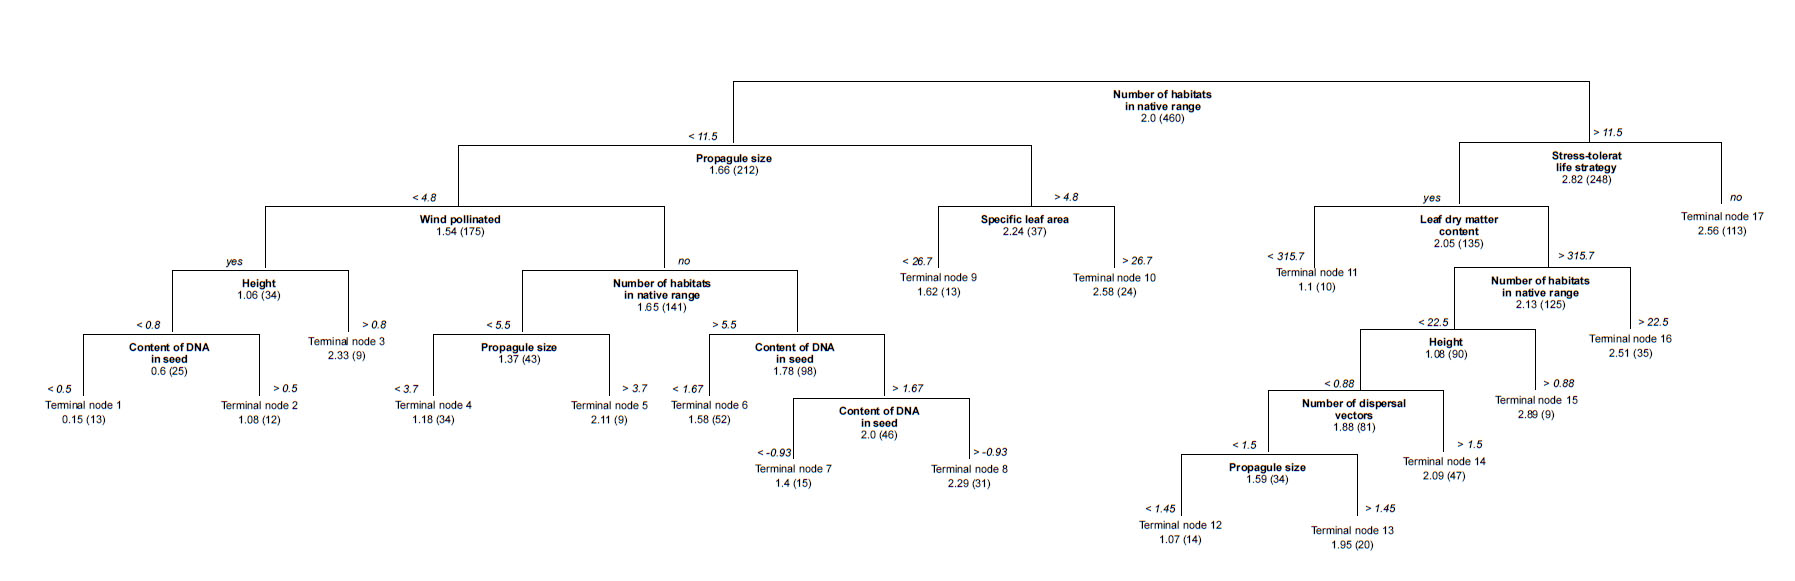
Fig. A3. Parsimonious regression tree to predict cultivation in the invaded range with all traits except cultivation in the native range, minimum residence time and regional frequency in the native range, expressed as the number of grid cells occupied by the species. Average cultivation index in the invaded range and the number of species in the group are shown for each terminal node.
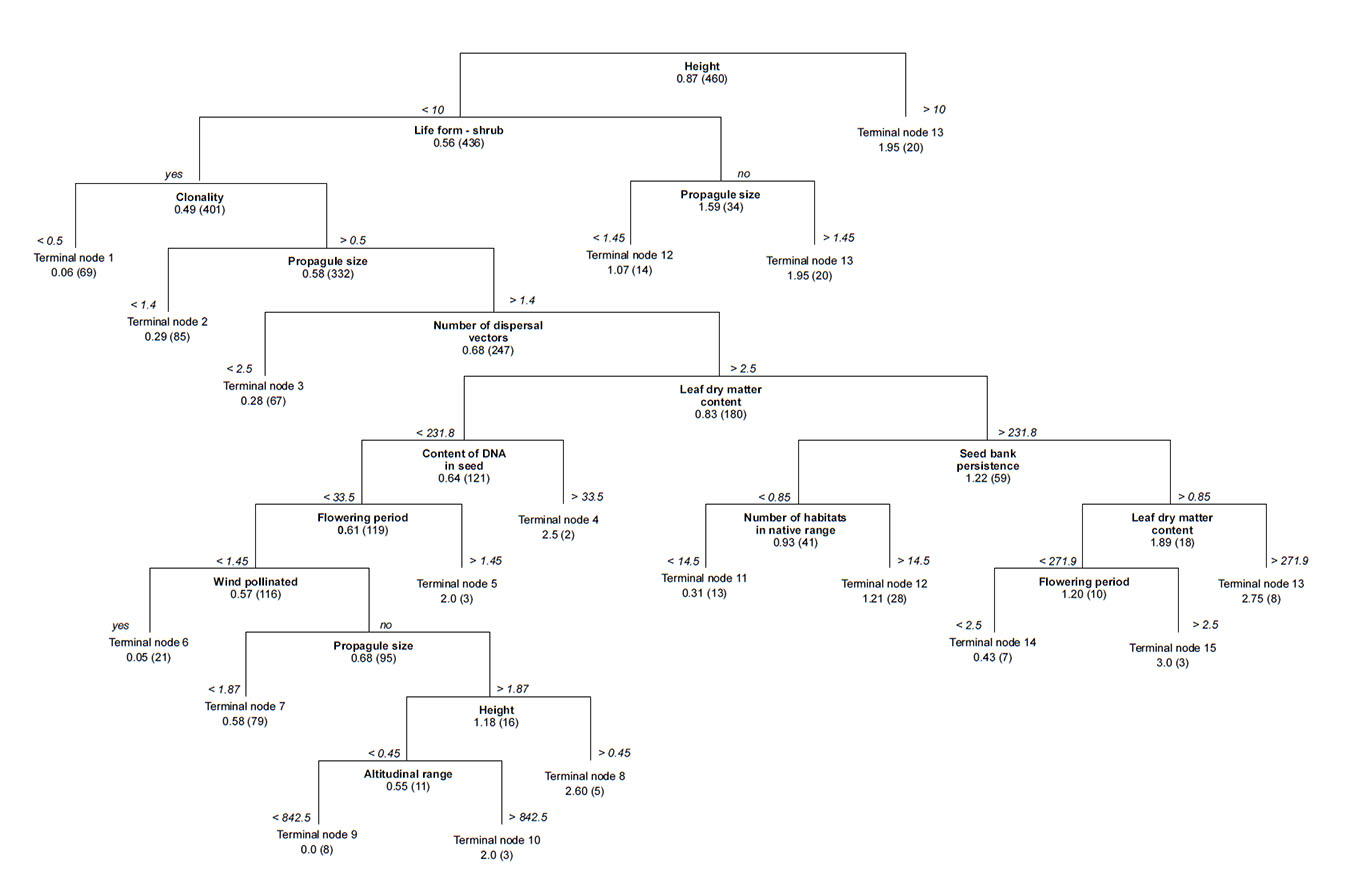
Fig. A4. Parsimonious regression tree to predict cultivation in the native range with all traits except cultivation in the invaded range, minimum residence time and regional frequency in the native range. Average cultivation index in the native range and the number of species in the group are shown for each terminal node.
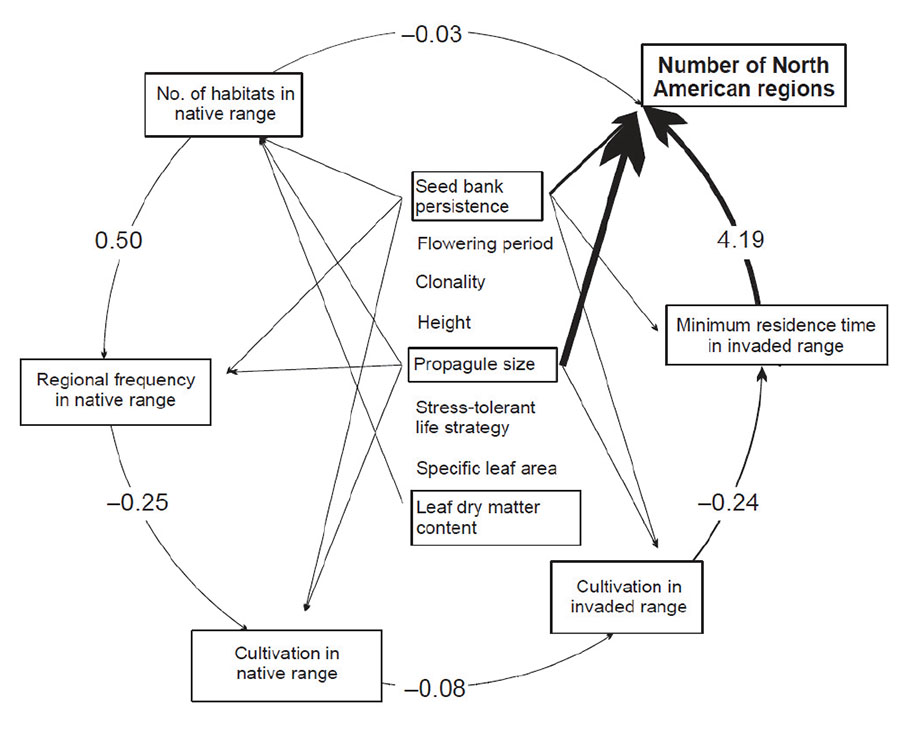
Fig. A5. Least parsimonious model which shows a path analysis with direct effects of biological traits on each driver of the invasion process: it fits the data best (RMSR = 0.06 ) but is not parsimonious (PGIF = 0.08); rather it is the most complex model. This model suggests that there are direct effects of the biological traits on each driver of invasion but several effects are rather negligible since the parameter estimates are small. (Note that the existence of an effect is accepted when the p value of the parameter estimate is less than 0.05). Also, in this model the biological traits explain a large part of variation in the number of North American regions invaded so that the size of the effect between the number of habitats and number of regions invaded is very small, and some of the parameter estimates show an unexpected negative sign (although the size of these effects is small and often not significant). This is symptomatic of an overfit model so Figs. 2, 3, and 4 in the main text result from a simplification of the path diagram shown here. Variables with nonsignificant effects are not framed.
Table A1. Magnitude of the coefficients and the probability of significance for the most parsimonious model presented in Fig. 1 in the main text. Since the variables are standardized, the estimate of the coefficient is also a measure of importance (large in absolute value means more important). Note: ~ signifies a regression path, whereas a ~~ signifies covariance.
|
|
Estimate |
Std. err |
Z value |
P(>|z|) |
Regressions |
|
|
|
|
|
Number of regions in North America~ |
Number of habitats |
7.539 |
0.845 |
8.921 |
0.000 |
|
Minimum residence time |
9.894 |
0.795 |
12.439 |
0.000 |
Minimum residence time~ |
Cultivation in invaded range |
0.525 |
0.051 |
10.401 |
0.000 |
Cultivation in invaded range~ |
Cultivation in native range |
1.274 |
0.177 |
7.186 |
0.000 |
Cultivation in native range ~ |
Regional frequency |
0.290 |
0.047 |
6.237 |
0.000 |
Regional frequency~ |
Number of habitats |
0.918 |
0.043 |
21.568 |
0.000 |
Number of habitats~ |
Stress-tolerant life strategy |
-0.479 |
0.088 |
-5.445 |
0.000 |
|
Seed bank persistence |
0.510 |
0.041 |
12.359 |
0.000 |
|
Specific leaf area |
0.050 |
0.049 |
1.022 |
0.307 |
|
Leaf dry matter content |
0.041 |
0.042 |
0.974 |
0.330 |
|
Flowering period |
0.153 |
0.040 |
3.814 |
0.000 |
|
Clonality |
0.084 |
0.021 |
3.968 |
0.000 |
|
Height |
0.073 |
0.037 |
1.943 |
0.052 |
|
Propagule size |
0.150 |
0.034 |
4.433 |
0.000 |
Covariances |
|
|
|
|
|
Stress-tolerant life strategy ~~ |
Seed bank persistence |
0.014 |
0.023 |
0.606 |
0.545 |
|
Specific leaf area |
0.039 |
0.022 |
1.808 |
0.071 |
|
Leaf dry matter content |
-0.106 |
0.023 |
-4.646 |
0.000 |
|
Flowering period |
0.004 |
0.024 |
0.145 |
0.885 |
|
Clonality |
0.203 |
0.042 |
4.864 |
0.000 |
|
Height |
-0.149 |
0.027 |
-5.611 |
0.000 |
|
Propagule size |
-0.123 |
0.026 |
-4.816 |
0.000 |
Seed bank persistence ~~ |
Specific leaf area |
0.034 |
0.048 |
0.693 |
0.488 |
|
Leaf dry matter content |
-0.003 |
0.047 |
-0.064 |
0.949 |
|
Flowering period |
0.301 |
0.047 |
6.466 |
0.000 |
|
Clonality |
0.270 |
0.085 |
3.184 |
0.001 |
|
Height |
-0.166 |
0.054 |
-3.072 |
0.002 |
|
Propagule size |
-0.305 |
0.065 |
-4.662 |
0.000 |
Specific leaf area ~~ |
Leaf dry matter content |
-0.302 |
0.049 |
-6.164 |
0.000 |
|
Flowering period |
0.179 |
0.047 |
3.818 |
0.000 |
|
Clonality |
-0.027 |
0.092 |
-0.298 |
0.766 |
|
Height |
-0.116 |
0.045 |
-2.594 |
0.009 |
|
Propagule size |
-0.072 |
0.046 |
-1.558 |
0.119 |
Leaf dry matter content~~ |
Flowering period |
-0.244 |
0.046 |
-5.312 |
0.000 |
|
Clonality |
0.029 |
0.089 |
0.331 |
0.741 |
|
Height |
0.260 |
0.054 |
4.798 |
0.000 |
|
Propagule size |
0.071 |
0.047 |
1.508 |
0.131 |
Flowering period ~~ |
Clonality |
-0.017 |
0.097 |
-0.175 |
0.861 |
|
Height |
-0.274 |
0.055 |
-5.004 |
0.000 |
|
Propagule size |
-0.209 |
0.055 |
-3.833 |
0.000 |
Clonality~~ |
Height |
-0.147 |
0.090 |
-1.639 |
0.101 |
|
Propagule size |
-0.068 |
0.081 |
-0.839 |
0.401 |
Height ~~ |
Propagule size |
0.393 |
0.141 |
2.78 |
0.005 |
Table A2. Magnitude of the coefficients and the probability of significance for the highly parsimonious model with improved fit represented in Fig. 2 in the main text. Since the variables are standardized the estimate of the coefficient is also a measure of importance (large in absolute value means more important). Note: ~ signifies a regression path, whereas a ~~ signifies covariance.
|
|
Estimate |
Std. err |
Z value |
P(>|z|) |
Regressions |
|
|
|
|
|
Number of regions in North America~ |
Number of habitats |
8.471 |
0.864 |
9.800 |
0.000 |
|
Minimum residence time |
9.887 |
0.830 |
11.907 |
0.000 |
Minimum residence time~ |
Cultivation in invaded range |
0.479 |
0.050 |
9.654 |
0.000 |
Cultivation in invaded range~ |
Cultivation in native range |
0.838 |
0.078 |
10.740 |
0.000 |
Cultivation in native range ~ |
Stress-tolerant life strategy |
-0.250 |
0.097 |
-2.582 |
0.010 |
|
Specific leaf area |
-0.067 |
0.037 |
-1.799 |
0.072 |
|
Height |
0.148 |
0.044 |
3.383 |
0.001 |
|
Propagule size |
0.134 |
0.051 |
2.613 |
0.009 |
|
Regional frequency |
0.314 |
0.044 |
7.147 |
0.000 |
Regional frequency ~ |
Number of habitats |
0.905 |
0.042 |
21.597 |
0.000 |
Number of habitats ~ |
Stress-tolerant life strategy |
-0.372 |
0.082 |
-4.521 |
0.000 |
|
Seed bank persistence |
0.517 |
0.040 |
12.842 |
0.000 |
|
Flowering period |
0.182 |
0.040 |
4.535 |
0.000 |
|
Clonality |
0.081 |
0.020 |
3.966 |
0.000 |
|
Height |
0.069 |
0.037 |
1.882 |
0.060 |
|
Propagule size |
0.122 |
0.035 |
3.464 |
0.001 |
Covariances |
|
|
|
|
|
Stress-tolerant life strategy ~~ |
Specific leaf area |
0.034 |
0.021 |
1.603 |
0.109 |
|
Height |
-0.151 |
0.027 |
-5.691 |
0.000 |
|
Propagule size |
-0.124 |
0.026 |
-4.859 |
0.000 |
|
Seed bank persistence |
0.014 |
0.023 |
0.590 |
0.555 |
|
Flowering period |
0.005 |
0.024 |
0.195 |
0.845 |
|
Clonality |
0.197 |
0.042 |
4.693 |
0.000 |
Specific leaf area ~~ |
Height |
-0.112 |
0.045 |
-2.483 |
0.013 |
|
Propagule size |
-0.063 |
0.046 |
-1.367 |
0.172 |
|
Seed bank persistence |
0.070 |
0.054 |
1.290 |
0.197 |
|
Flowering period |
0.191 |
0.047 |
4.091 |
0.000 |
|
Clonality |
-0.015 |
0.091 |
-0.166 |
0.868 |
Height ~~ |
Propagule size |
0.384 |
0.141 |
2.733 |
0.006 |
|
Seed bank persistence |
-0.166 |
0.055 |
-3.007 |
0.003 |
|
Flowering period |
-0.275 |
0.056 |
-4.925 |
0.000 |
|
Clonality |
-0.129 |
0.092 |
-1.401 |
0.161 |
Propagule size ~~ |
Seed bank persistence |
-0.309 |
0.067 |
-4.620 |
0.000 |
|
Flowering period |
-0.213 |
0.055 |
-3.865 |
0.000 |
|
Clonality |
-0.055 |
0.081 |
-0.680 |
0.496 |
Seed bank persistence ~~ |
Flowering period |
0.295 |
0.047 |
6.305 |
0.000 |
|
Clonality |
0.271 |
0.085 |
3.199 |
0.001 |
Flowering period ~~ |
Clonality |
-0.020 |
0.097 |
-0.209 |
0.834 |
Table A3. Magnitude of the coefficients and the probability of significance for the most parsimonious model including additional feedbacks between the regional frequency in the native range and cultivation in the native range, and a direct link between cultivation in the invaded range and the number of North American regions invaded (represented in Fig. 3 in the main text). Since the variables are standardized the estimate of the coefficient is also a measure of importance (large in absolute value means more important). Note: ~ signifies a regression path, whereas a ~~ signifies covariance.
|
|
Estimate |
Std.err |
Z value |
P(>|z|) |
Regressions |
|
|
|
|
|
Number of regions in North America~ |
Number of habitats |
8.032 |
0.906 |
8.869 |
0.000 |
|
Minimum residence time |
7.988 |
0.850 |
9.397 |
0.000 |
|
Cultivation in invaded range |
2.465 |
0.969 |
2.544 |
0.011 |
Minimum residence time~ |
Cultivation in invaded range |
0.454 |
0.052 |
8.699 |
0.000 |
Cultivation in invaded range~ |
Cultivation in native range |
0.759 |
0.066 |
11.425 |
0.000 |
Cultivation in native range ~ |
Stress-tolerant life strategy |
-0.290 |
0.100 |
-2.884 |
0.004 |
|
Specific leaf area |
-0.063 |
0.038 |
-1.656 |
0.098 |
|
Height |
0.166 |
0.045 |
3.654 |
0.000 |
|
Propagule size |
0.111 |
0.049 |
2.275 |
0.023 |
|
Regional frequency |
0.253 |
0.051 |
4.911 |
0.000 |
Regional frequency ~ |
Number of habitats |
0.864 |
0.041 |
20.872 |
0.000 |
|
Cultivation in native range |
0.164 |
0.051 |
3.209 |
0.001 |
Number of habitats~ |
Stress-tolerant life strategy |
-0.334 |
0.082 |
-4.074 |
0.000 |
|
Seed bank persistence |
0.518 |
0.040 |
12.98 |
0.000 |
|
Flowering period |
0.185 |
0.040 |
4.610 |
0.000 |
|
Clonality |
0.081 |
0.020 |
3.949 |
0.000 |
|
Height |
0.055 |
0.037 |
1.472 |
0.141 |
|
Propagule size |
0.108 |
0.033 |
3.296 |
0.001 |
Covariances |
|
|
|
|
|
Stress-tolerant life strategy ~~ |
sla |
0.035 |
0.021 |
1.617 |
0.106 |
|
Height |
-0.152 |
0.027 |
-5.724 |
0.000 |
|
Propagule size |
-0.125 |
0.026 |
-4.891 |
0.000 |
|
Seed bank persistence |
0.011 |
0.023 |
0.466 |
0.641 |
|
Flowering period |
0.004 |
0.024 |
0.157 |
0.875 |
|
Clonality |
0.193 |
0.042 |
4.590 |
0.000 |
Specific leaf area ~~ |
Height |
-0.113 |
0.045 |
-2.517 |
0.012 |
|
Propagule size |
-0.065 |
0.046 |
-1.401 |
0.161 |
|
Seed bank persistence |
0.070 |
0.054 |
1.297 |
0.195 |
|
Flowering period |
0.191 |
0.047 |
4.095 |
0.000 |
|
Clonality |
-0.016 |
0.091 |
-0.175 |
0.861 |
Height ~~ |
Propagule size |
0.407 |
0.142 |
2.871 |
0.004 |
|
Seed bank persistence |
-0.157 |
0.055 |
-2.833 |
0.005 |
|
Flowering period |
-0.273 |
0.056 |
-4.860 |
0.000 |
|
Clonality |
-0.120 |
0.092 |
-1.298 |
0.194 |
Propagule size ~~ |
Seed bank persistence |
-0.300 |
0.067 |
-4.499 |
0.000 |
|
Flowering period |
-0.211 |
0.055 |
-3.835 |
0.000 |
|
Clonality |
-0.054 |
0.081 |
-0.659 |
0.510 |
Seed bank persistence ~~ |
Flowering period |
0.294 |
0.047 |
6.295 |
0.000 |
|
Clonality |
0.272 |
0.085 |
3.201 |
0.001 |
Flowering period ~~ |
Clonality |
-0.021 |
0.097 |
-0.212 |
0.832 |