Ecological Archives E096-071-A1
Angelica P. Baldos, Marife D. Corre, and Edzo Veldkamp. 2015. Response of N cycling to nutrient inputs in forest soils across a 10003000 m elevation gradient in the Ecuadorian Andes. Ecology 96:749761. http://dx.doi.org/10.1890/14-0295.1
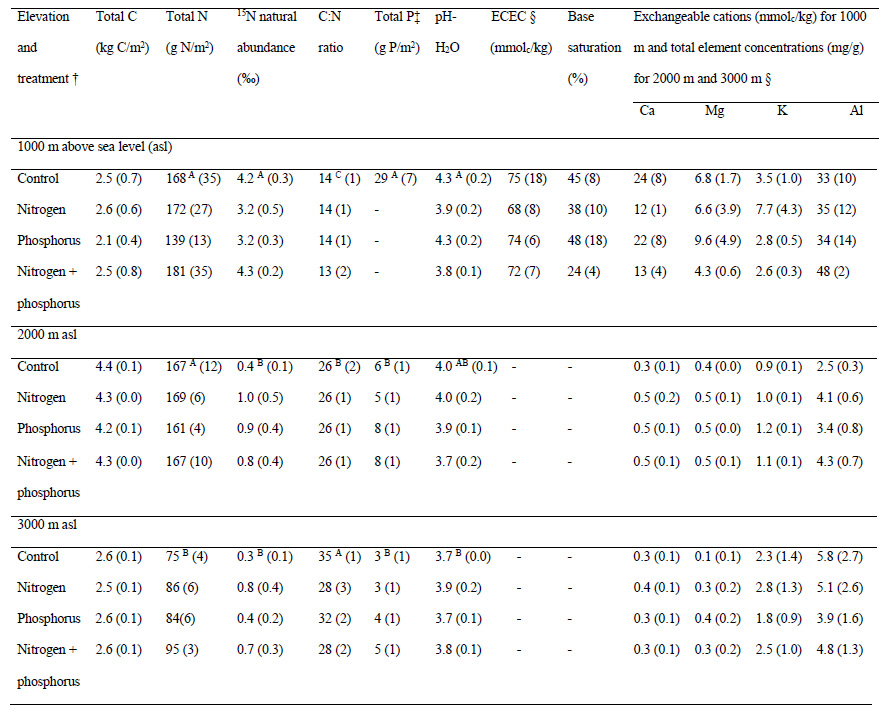
Appendix A. Soil biochemical characteristics in top 5-cm depth (corresponding to a mineral soil for the site at 1000 m and to an organic layer for the sites at 2000 m and 3000 m) of montane forest soils along a 10003000-m elevation gradient, measured in 2012 after 4 years of treatment.
Table A1. Soil biochemical characteristics in top 5-cm depth (corresponding to a mineral soil for the site at 1000 m and to an organic layer for the sites at 2000 m and 3000 m) of montane forest soils along a 1000–3000-m elevation gradient, measured in 2012 after 4 years of treatment.
Notes: Values are means with SE in parentheses (n = 4 plots).Means with different capital letters indicate significant differences across the elevation gradient for the control plots only (one-way ANOVA with Tukey HSD at P ≤ 0.05). Total C, N, and P stocks were calculated using the measured bulk densities in the top 5-cm depth: 0.84 ± 0.10, 0.18 ± 0.05 and 0.11 ± 0.01 g/cm3 for 1000 m, 2000 m and 3000 m, respectively (Martinson et al. 2013).
† Control plots had no fertilizer addition; nitrogen plots were fertilized with 50 kg urea-N·ha-1·yr-1; phosphorus plots were fertilized with 10 kg P·ha-1·yr-1 of analytical grade NaH2PO4.2H2O; nitrogen + phosphorus plots received combined application of the same fertilizers and rates. All fertilizers were split in two equal applications per year and broadcasted by hand. There was no significant treatment effect detected at all elevations.
‡ For the site at 1000 m, total P in the top 5-cm depth (corresponding to a mineral soil) was measured by Wolf et al. 2011 in a nearby forest which was comparable to our control plots; at this elevation total P was not measured in the N, P, and N + P plots. At 2000 m and 3000 m, total P in the top 5-cm depth (corresponding to an organic layer) was measured from all plots in 2012.
§ ECEC – effective cation exchange capacity; this analysis is appropriate for a mineral soil which, for the top 5-cm depth, is only present at 1000 m. For the top 5-cm depth at 2000 m and 3000 m, which corresponds to an organic layer, ECEC cannot be analyzed, and thus total element concentration was determined.
Literature cited
Martinson, G. O., M. D. Corre, and E. Veldkamp. 2013. Responses of nitrous oxide fluxes and soil nitrogen cycling to nutrient additions in montane forests along an elevation gradient in southern Ecuador. Biogeochemistry 112:625–636.
Wolf, K., E. Veldkamp, J. Homeier, and G. O. Martinson. 2011. Nitrogen availability links forest productivity, soil nitrous oxide and nitric oxide fluxes of a tropical montane forest in southern Ecuador. Global Biogeochemical Cycles 25:GB4009.