Ecological Archives E096-062-A3
E. Vander Wal, M. Festa-Bianchet, D. Réale, D. W. Coltman, and F. Pelletier. 2015. Sex-based differences in the adaptive value of social behavior contrasted against morphology and environment. Ecology 96:631641. http://dx.doi.org/10.1890/14-1320.1
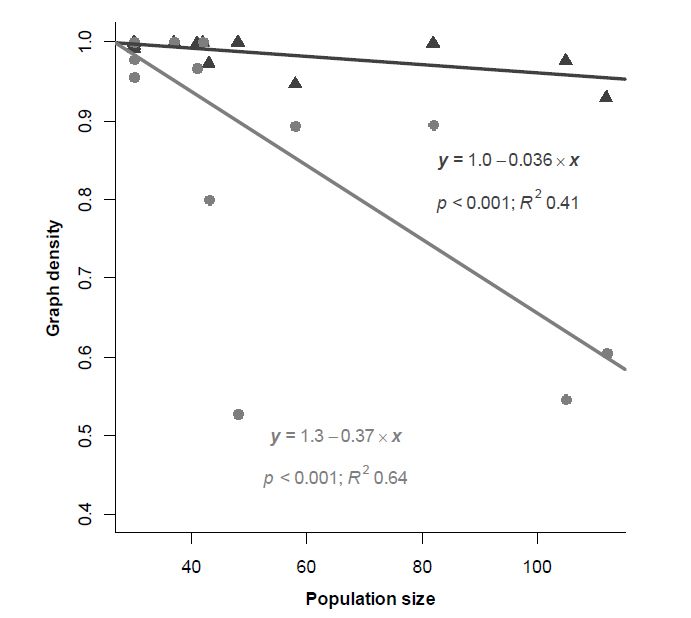
Appendix C. Supplementary figure illustrating the relationship between graph density and population size.
Fig. C1. The relationship between graph density and population size for adult female (black) and male (gray) bighorn sheep. For males, graph density had a negative correlation with total population size. As such, the smaller the population size the more likely each dyad was observed associating throughout the field season. However, males had less dense networks than females indicating that they were less likely to be observed associating with all possible dyads within the population. Despite a higher proportion of the population being female, female networks were denser than male networks. Graph density also correlated for females, such that even at high population size it remained likely that a high proportion of females were observed associating.