Ecological Archives E096-062-A2
E. Vander Wal, M. Festa-Bianchet, D. Réale, D. W. Coltman, and F. Pelletier. 2015. Sex-based differences in the adaptive value of social behavior contrasted against morphology and environment. Ecology 96:631641. http://dx.doi.org/10.1890/14-1320.1
Appendix B. Supplementary tables reporting replicated results for graph strength.
Table B1. Results for competing models to explain the variation in different measures of fitness (lamb production and survival) in bighorn sheep on Ram Mountain, Alberta (see Table 1). Models constructed with graph strength, see Table 3 for results using eigenvector centrality. Emboldened values represent models with ∆AIC ≤ 3.
| Δ Akaike's Information Criteria (R²) | ||||||
Hypotheses |
Female lamb production |
Male lamb production |
Female lamb survival |
Male lamb survival |
Female |
Male |
H1a |
189.57 (0.04) |
52.97 (0.43) |
3.03 (0.06) |
6.54 (0.09) |
31.71 (0.18) |
33.97 (0.37) |
H1b |
186.56 (0.05) |
102.59 (0.28) |
2.93 (0.07) |
1.95 (0.14) |
75.63 (0.07) |
34.28 (0.36) |
H1c |
183.25 (0.07) |
45.91 (0.47) |
5.69 (0.08) |
4.04 (0.16) |
26.61 (0.2) |
36.31 (0.37) |
H2 |
22.07 (0.39) |
9.23 (0.56) |
3.45 (0.11) |
3.94 (0.16) |
56.85 (0.13) |
33.04 (0.38) |
H3 |
11.71 (0.41) |
NA |
2.87 (0.14) |
3.97 (0.18) |
54.35 (0.14) |
3.78 (0.51) |
H4 |
190.20 (0.04) |
161.32 (0.06) |
0.00 (0.1) |
1.67 (0.14) |
93.08 (0.02) |
110.79 (0.04) |
H5 |
13.18 (0.41) |
4.30 (0.58) |
2.18 (0.18) |
0.00 (0.24) |
56.19 (0.14) |
5.76 (0.51) |
H6 |
0.00 (0.45) |
0.00 (0.61) |
7.01 (0.19) |
2.81 (0.27) |
0.00 (0.29) |
0.00 (0.55) |
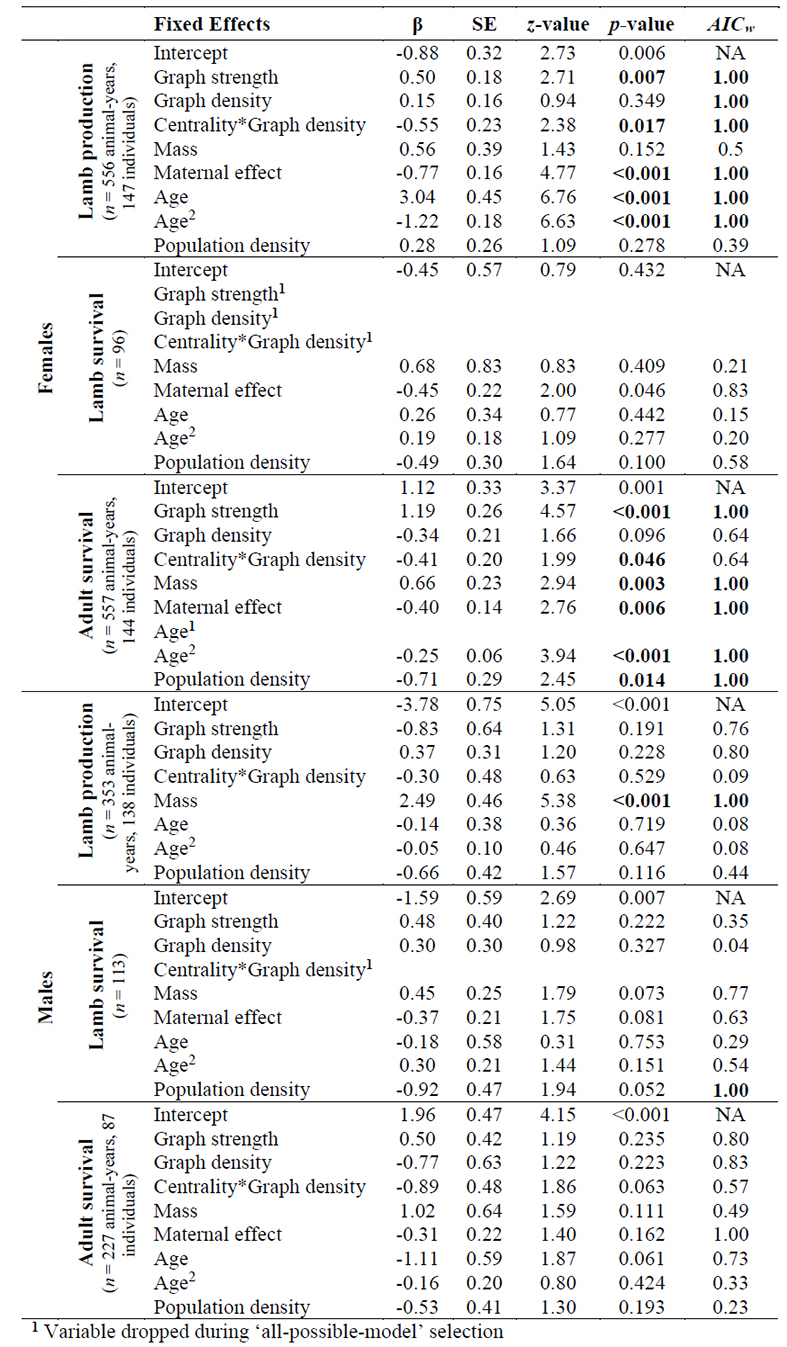
Table B2. Model averaged results from the global model (Table B2) to explain the variation in different measures of fitness in bighorn sheep on Ram Mountain, Alberta. Models constructed with graph strength, see Tables 4 and 5 for results using eigenvector centrality. We standardized all variable to their z-scores prior to analysis. Emboldened numbers report either p < 0.05 or relative variable importance values (AICw) = 1.