Ecological Archives E096-056-A1
Minxia Liang, Xubing Liu, Rampal S. Etienne, Fengmin Huang, Yongfan Wang, and Shixiao Yu. 2015. Arbuscular mycorrhizal fungi counteract the Janzen-Connell effect of soil pathogens. Ecology 96:562574. http://dx.doi.org/10.1890/14-0871.1
Appendix A. Additional methodological details and results for the wet-sieving method.
For each group of the four microbial fractions (AMF/pathogens/field soil/sterile soil), we used three 50 g subsamples which were passed through a 250-μm sieve separately and became 100 mL suspensions. This procedure can eliminate larger organisms, and also remove any soil invertebrates including nematodes (usually 0.3~5 mm) which may contributed to plant-soil feedbacks. The first suspension was passed through a 45-μm sieve and a 20-μm sieve successively to extract (1) AMF and (2) soil pathogens. We collected AMF spores on a 45-μm sieve and surface sterilized them with 10% sodium hypochlorite to remove the pathogens; pathogens and other non-mycorrhizal microbes were collected from filtrate which passed through a 20-μm sieve. The second suspension was used as (3) field soil treatment, and the fourth suspension was sterilized by gamma radiation and used as (4) sterile soil. Finally, all four soil fractions were actually 100 mL solutions. We inoculated each pot with one of the four soil fractions and then covered each pot with a layer of 2 cm thick sterile soil.
Comparing to the whole pot of sterilized soil (c. 450 g), the inocula treatment (less than 50 g) was a relatively small part. Also, we measured the contents of soil nutrients for each treatment, and found that the wet-sieving method did not influence the NPK contents of the soil (Table A1). Hence, we could conclude that there was no abiotic difference among the four soil treatments but only biotic difference. Regarding the other organisms besides AMF and pathogens in the field treatment, we removed any soil invertebrates larger than 250-μm, and also conducted an additional shade-house experiment to confirm the interaction effects between AMF and pathogen using an AMF + pathogen treatment.
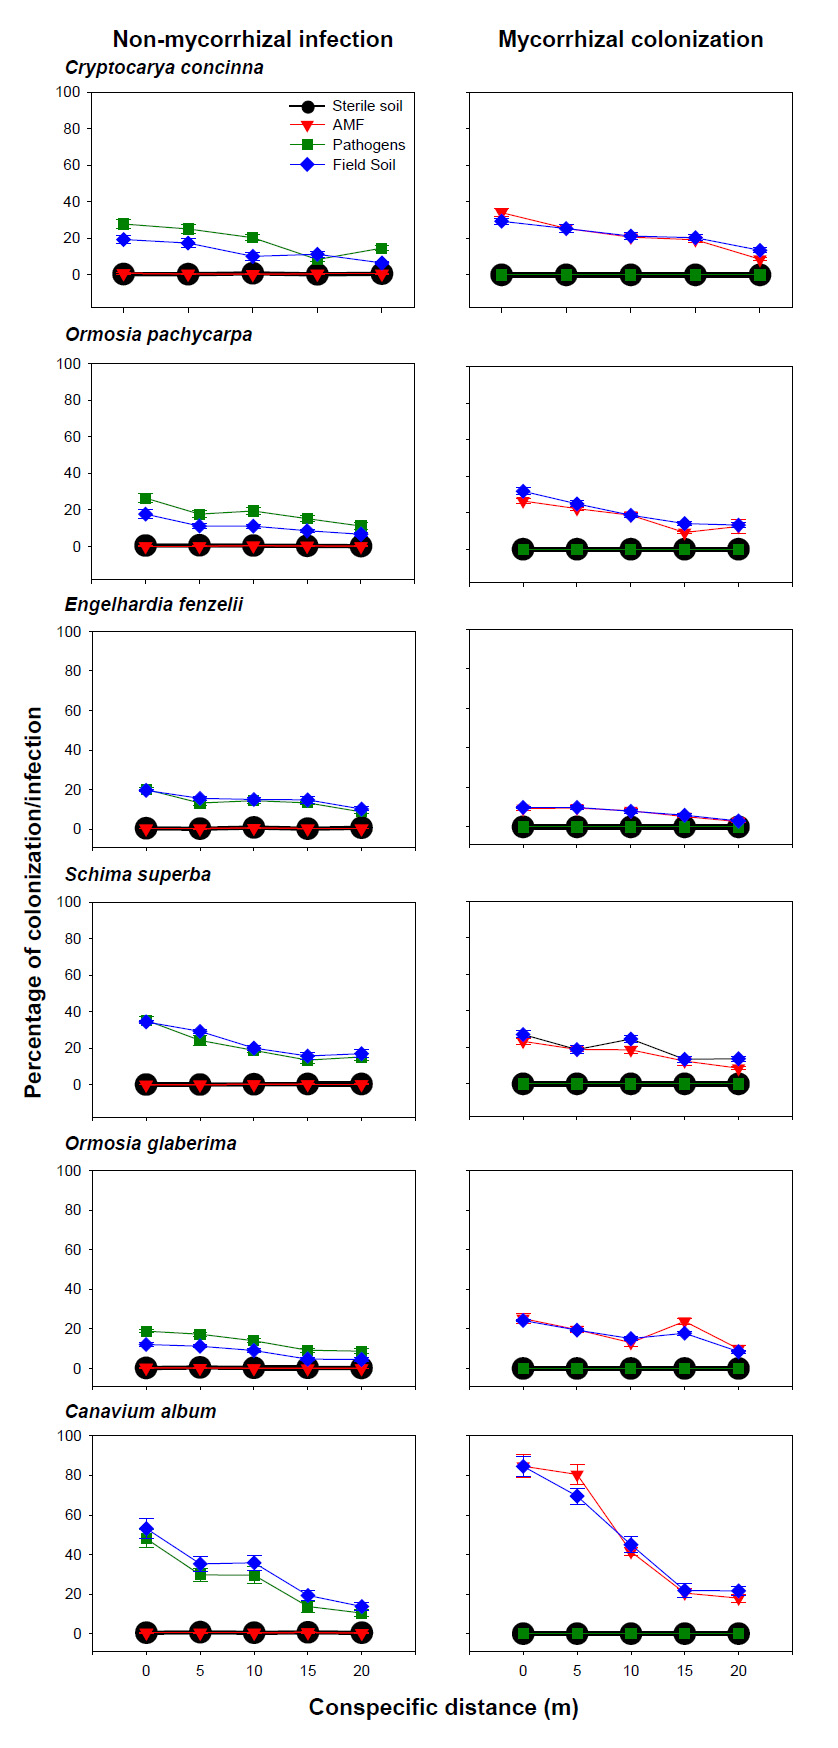
Fig. A1. Percentages of root colonization by arbuscular mycorrhizal fungi and infection by non-mycorrhizal fungi when seedlings were treated with AMF, pathogens, field soil and sterile soil collected at five different distances from conspecific adult trees. Error bars represent standard errors. Points of the sterile soil treatment are plotted much larger than others, to make them visible when another treatment falls on top of them. Note that percentages of non-mycorrhizal infection in AMF and sterile soil treatments and mycorrhizal colonization in pathogen and sterile soil treatments are not zero but have very small values (0.2~0.9).
Table A1. Comparisons of total N, P, and K for field soil treatment between any two of the five distances: 0, 5, 10, 15, 20 m for each species in shade-house experiment 2. Numbers indicate meant ± SE (g/kg). Different superscript letters indicate significant differences at P < 0.05.
species |
parameters |
0 m |
5 m |
10 m |
15 m |
20 m |
Cryptocarya concinna |
Total N |
2.296 ± 0.130 a |
2.327 ± 0.031 a |
2.247 ± 0.075 a |
2.498 ± 0.182 a |
2.571 ± 0.086 a |
Total P |
0.162 ± 0.037 a |
0.171 ± 0.018 a |
0.187 ± 0.003 a |
0.185 ± 0.011 a |
0.177 ± 0.014 a |
|
Total K |
28.800 ± 1.041 a |
30.800 ± 0.115 a |
32.033 ± 1.217 a |
31.300 ± 1.528 a |
30.8 ± 1.803 a |
|
Canavium album |
Total N |
1.818 ± 0.096 b |
1.958 ± 0.105b |
2. 333 ± 0.116 a |
1.945 ± 0.103 ab |
1.746 ± 0.145 ab |
Total P |
0.206 ± 0.034 a |
0.154 ± 0.032 a |
0.181 ± 0.011 a |
0.182 ± 0.023 a |
0.198 ± 0.011 a |
|
Total K |
40.3 ± 0.764 a |
43.47 ± 0.882 a |
39.967 ± 1.453 a |
42.467 ± 1.167 a |
40.3 ± 1.155 a |
|
Engelhardia fenzelii |
Total N |
1.587 ± 0.038 a |
1.602 ± 0.066 a |
1.925 ± 0.259 a |
1.902 ± 0.067 a |
1.617 ± 0.158 a |
Total P |
0.211 ± 0.008 a |
0.197 ± 0.008 a |
0.190 ± 0.014 a |
0.180 ± 0.011 a |
0.192 ± 0.013 a |
|
Total K |
40.467 ± 0.601 a |
40.133 ± 0.833 a |
41.733 ± 1.670 a |
40.200 ± 0.907 a |
39.933 ± 1.017 a |
|
Ormosia pachycarpa |
Total N |
2.442 ± 0.060 a |
2.339 ± 0.196 a |
1.834 ± 0.055 b |
1.749 ± 0.015 b |
1.355 ± 0.097 c |
Total P |
0.235 ± 0.020 a |
0.228 ± 0.021 a |
0.256 ± 0.011 a |
0.262 ± 0.010 a |
0.270 ± 0.019 a |
|
Total K |
40.47 ± 0.60 a |
40.133 ± 0.833 a |
41.733 ± 1.670 a |
40.2 ± 0.907 a |
39.933 ± 1.017 a |
|
Schima superba |
Total N |
1.428 ± 0.073 a |
1.607 ± 0.158 a |
1.686 ± 0.133 a |
1.413 ± 0.083 a |
1.390 ± 0.076 a |
Total P |
0.218 ± 0.018 a |
0.213 ± 0.011 a |
0.217 ± 0.020 a |
0.215 ± 0.030 a |
0.171 ± 0.004 a |
|
Total K |
39.633 ± 0.667 a |
39.433 ± 0.133 a |
39.000 ± 1.457 a |
41.233 ± 0.521 a |
40.800 ± 0.500 a |
|
Ormosia glaberrima |
Total N |
3.347 ± 0.143 a |
2.840 ± 0.096 b |
2.329 ± 0.104 c |
2.203 ± 0.156 c |
2.622 ± 0.140 b |
Total P |
0.238 ± 0.029 a |
0.248 ± 0.014 a |
0.219 ± 0.010 a |
0.230 ± 0.017 a |
0.233 ± 0.006 a |
|
Total K |
13.967 ± 0.393 a |
14.200 ± 1.528 a |
15.800 ± 0.666 a |
16.533 ± 0.821 a |
14.200 ± 0.500 a |