Ecological Archives E096-053-A1
C. G. E. (Toos) van Noordwijk, Wilco C. E. P. Verberk, Hans Turin, Theodoor Heijerman, Kees Alders, Wouter Dekoninck, Karsten Hannig, Eugenie Regan, Stephen McCormack, Mark J. F. Brown, Eva Remke, Henk Siepel, Matty P. Berg, and Dries Bonte. 2015. Speciesarea relationships are modulated by trophic rank, habitat affinity, and dispersal ability. Ecology 96:518531. http://dx.doi.org/10.1890/14-0082.1
Appendix A. Map of sampling sites across Europe and data selection method.
Data selection method
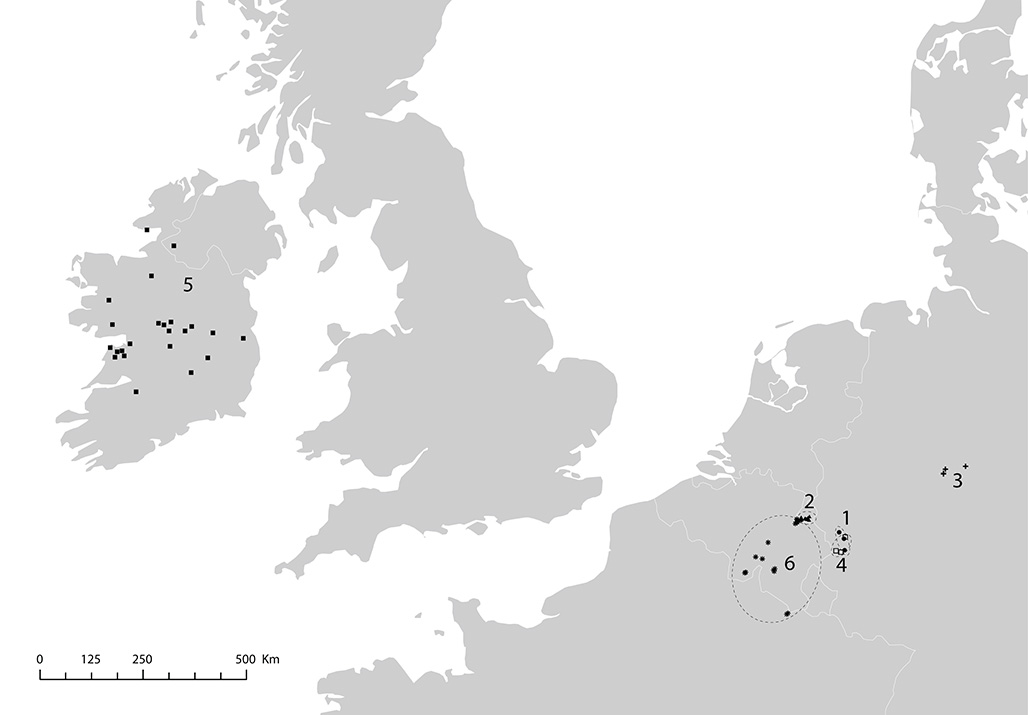
We collected six data sets from four countries in northwestern Europe containing pitfall trap data of carabid beetles from unimproved calcareous grasslands (Fig. A1). Some data sets included additional data from improved grasslands or forests, but these were excluded for our analysis. Two sites (Thier de Lanaye and Ahrhütte) occurred in more than one data set. To prevent pseudo-replication, these were only included once (the most extensively sampled instance was retained). Our goal was to gain an equal sample of the carabid beetle fauna of calcareous grasslands differing in size. Most datasets were collected for this purpose and thus consisted of an equal number of pitfall traps per site. Where this was not the case (i.e., where larger sites were sampled more intensively than small sites), a subsample of available trapping stations was taken to attain equal sampling intensity. This was done by identifying pairs of pitfall trap series very close to each other or in very similar vegetation structures (within the calcareous grassland) and randomly selecting one pitfall trap series from each pair. In this way we simulated the initial selection procedure for sampling locations in small sites (i.e., researchers generally selected sampling stations such that they together covered the main habitat variation within each calcareous grassland site). With respect to temporal sampling intensity, sites within each dataset were generally sampled simultaneously and for the same length of time. In some cases sampling continued for a longer period in a selection of sites. These additional data were excluded to attain an equal sampling duration across sites within each data set.
Fig. A1. Sampling locations in northwestern Europe. Symbols and numbers represent different datasets: ● = 1 Germany (2006); ▲ = 2 Netherlands (1988); + = 3 Germany (1986); □ = 4 Germany (1995); ■ = 5 Ireland (2006); * = 6 Belgium (1986).