Ecological Archives E096-051-A5
Jamin Dreyer, Philip A. Townsend, James C. Hook III, David Hoekman, M. Jake Vander Zanden, and Claudio Gratton. 2015. Quantifying aquatic insect deposition from lake to land. Ecology 96:499–509. http://dx.doi.org/10.1890/14-0704.1
Appendix E. Model coefficients, evaluation, and comparison to midge infall data collected at Lake Mývatn, 2008–2011.
Table E1. Model coefficients of 3-parameter local maxima model, distance of maximum deposition (first derivative), maximum distance of deposition (terminus; see Methods), and model fit, for the six models developed from midge infall measurements around Lake Mývatn, Iceland during the summers 2008–2011.
Decay Model Parameters and Measure of Fit |
|||||||
Data |
Distance of maximum |
||||||
aggregation |
Midge |
a |
b |
c |
deposition (m) |
Max. Dist. (m) |
Pseudo R² |
Annual |
Large (Chironomus) |
0.053 |
0.170 |
-0.005 |
38 |
578 |
0.8281 |
Annual |
Small (Tanytarsus) |
0.083 |
0.121 |
-0.008 |
13 |
357 |
0.8393 |
Annual |
All |
0.080 |
0.093 |
-0.006 |
16 |
454 |
0.8887 |
Weekly |
Large (Chironomus) |
0.040 |
0.302 |
-0.008 |
52 |
395 |
0.8472 |
Weekly |
Small (Tanytarsus) |
0.070 |
0.203 |
-0.011 |
19 |
295 |
0.8290 |
Weekly |
All |
0.070 |
0.166 |
-0.008 |
20 |
359 |
0.9212 |
Table E2. Local maxima decay model evaluation for the "annual" and "weekly" models comparisons predicted and observed proportions of midge infall at Lake Mývatn, Iceland during the summers 2008–2011.
Decay Model Evaluation |
||
Year Removed |
Data |
Pseudo R² |
None |
Annual |
0.8887 |
2008 |
Annual |
0.8304 |
2009 |
Annual |
0.9416 |
2010 |
Annual |
0.9039 |
2011 |
Annual |
0.8726 |
None |
Weekly |
0.9212 |
2008 |
Weekly |
0.8052 |
2009 |
Weekly |
0.9535 |
2010 |
Weekly |
0.9366 |
2011 |
Weekly |
0.9209 |
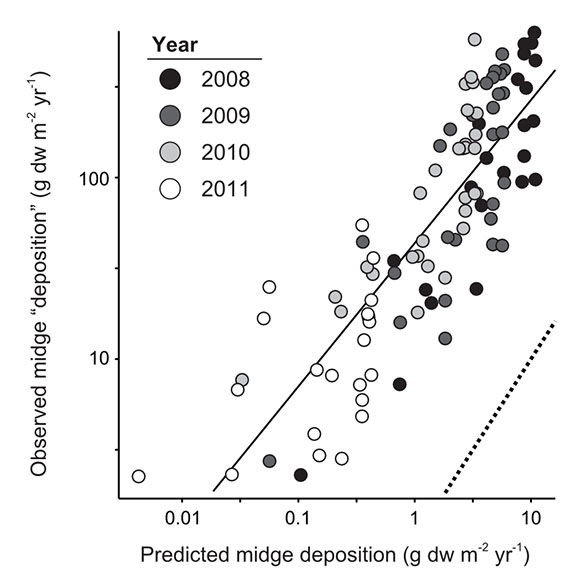
Fig. E1. Midge deposition as predicted by the "emergence constrained" model compared to midge deposition "observed" from infall traps around Lake Mývatn, Iceland May-August between 2008–2011. There was a strong positive relationship (F1,99 = 240.1, P <<0.0001, adj. psuedo-R² = 0.701) between estimated midge deposition from our model and observed midge infall from cup traps, with year (F3,88 = 2.92, P = 0.038) and transect (F8,88 = 6.51, P <<0.0001) also significant. This pattern, lying above the 1:1 dashed line, indicates that while infall traps along transects are highly correlated with modeled deposition from the emergence constrained model, they overestimate deposition by a factor of ~20–30X.