Ecological Archives E096-051-A3
Jamin Dreyer, Philip A. Townsend, James C. Hook III, David Hoekman, M. Jake Vander Zanden, and Claudio Gratton. 2015. Quantifying aquatic insect deposition from lake to land. Ecology 96:499509. http://dx.doi.org/10.1890/14-0704.1
Appendix C. Details on midge emerge rates from Lake Mývatn, Iceland during 20082011, with estimated total midge emergence during those years.
Table C1. Average daily rates of total midge (Diptera: Chironomidae) emergence (g dw·m-2·d-1) estimated from emergence traps placed in the south basin of Lake Mývatn, Iceland during May–August 2008, 2010 and May–July 2009, 2011.
Mean Midge Emergence at Lake Myvatn, Iceland 2008–2011 by Sampling Period |
||||
Year |
Sampling Period |
N |
Emergence g·m-2·d-1 |
SE |
2008 |
24 May – 1 June |
11 |
0.1779 |
0.0508 |
2008 |
1 June – 10 June |
11 |
0.1569 |
0.0274 |
2008 |
10 June – 14 June |
4 |
0.3268 |
0.1064 |
2008 |
10 June -20 June |
6 |
0.0143 |
0.0047 |
2008 |
14 June – 20 June |
5 |
0.0172 |
0.0078 |
2008 |
20 June – 3 July |
12 |
0.0005 |
0.0002 |
2008 |
3 July – 19 July |
12 |
0.0010 |
0.0003 |
2008 |
19 July – 29 July |
12 |
0.0081 |
0.0023 |
2008 |
29 July – 4 August |
12 |
0.0188 |
0.0090 |
2009 |
22 May – 1 June |
8 |
0.0069 |
0.0016 |
2009 |
23 May – 1 June |
4 |
0.0217 |
0.0109 |
2009 |
1 June – 8 June |
20 |
0.1186 |
0.0200 |
2009 |
8 June – 15 June |
20 |
0.0449 |
0.0140 |
2009 |
15 June – 26 June |
20 |
0.0026 |
0.0005 |
2009 |
26 June – 17 July |
19 |
0.0064 |
0.0018 |
2009 |
17 July -24 July |
20 |
0.0704 |
0.0131 |
2010 |
22 May – 30 May |
17 |
0.0492 |
0.0106 |
2010 |
30 May – 8 June |
18 |
0.0333 |
0.0073 |
2010 |
8 June – 17 June |
18 |
0.0147 |
0.0069 |
2010 |
17 June – 6 July |
18 |
0.0010 |
0.0002 |
2010 |
6 July – 17 July |
17 |
0.0297 |
0.0074 |
2010 |
17 July – 6 August |
18 |
0.0010 |
0.0004 |
2011 |
26 May – 7 June |
11 |
0.0033 |
0.0011 |
2011 |
7 June – 16 June |
12 |
0.0049 |
0.0016 |
2011 |
16 June- 5 July |
12 |
0.0045 |
0.0010 |
2011 |
5 July – 21 July |
10 |
0.0010 |
0.0004 |
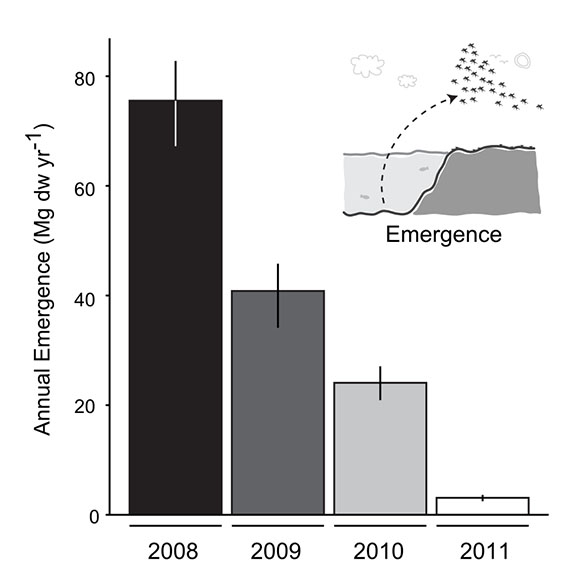
Fig. C1. Total midge emergence (tons dw/yr) from the south basin of Lake Mývatn, Iceland during 2008–2011. Error bars are +/- 95% confidence intervals.