Ecological Archives E096-049-A1
Thierry Chambert, Jay J. Rotells, and Robert A. Garrott. 2015. Female Weddell seals show flexible strategies of colony attendance related to varying environmental conditions. Ecology 96:479488. http://dx.doi.org/10.1890/14-0911.1
Appendix A. Posterior predictive checks.
To assess the goodness-of-fit of our model, we performed posterior predictive checks to evaluate the model's ability to predict several important aspects of data (see Figs A1 to A6). Specifically, we checked the model's predictive ability for: (1) the expected population averages for four 'life history traits' (Fig. A1): (a) minimum observed lifetime after recruitment, which is defined as the number of years between recruitment and last observation and (b) number of reproductive events, (c) number of years on sabbatical from pup production but attending colonies, and (d) number of years on sabbatical from pup production and not attending colonies; (2) the population composition for recruited females (i.e., proportion of females in the different reproductive states defined) for each year of the study (Fig. A2); and (3) individual values for the four life history traits defined above (Figs A3 to A6). These different predictive summaries capture important data features at different levels: (1) population scale, (2) temporal variation; and (3) individual variation. From the figures below, we can see that the model shows good predictive properties for all the data summaries considered, indicating adequate fit.
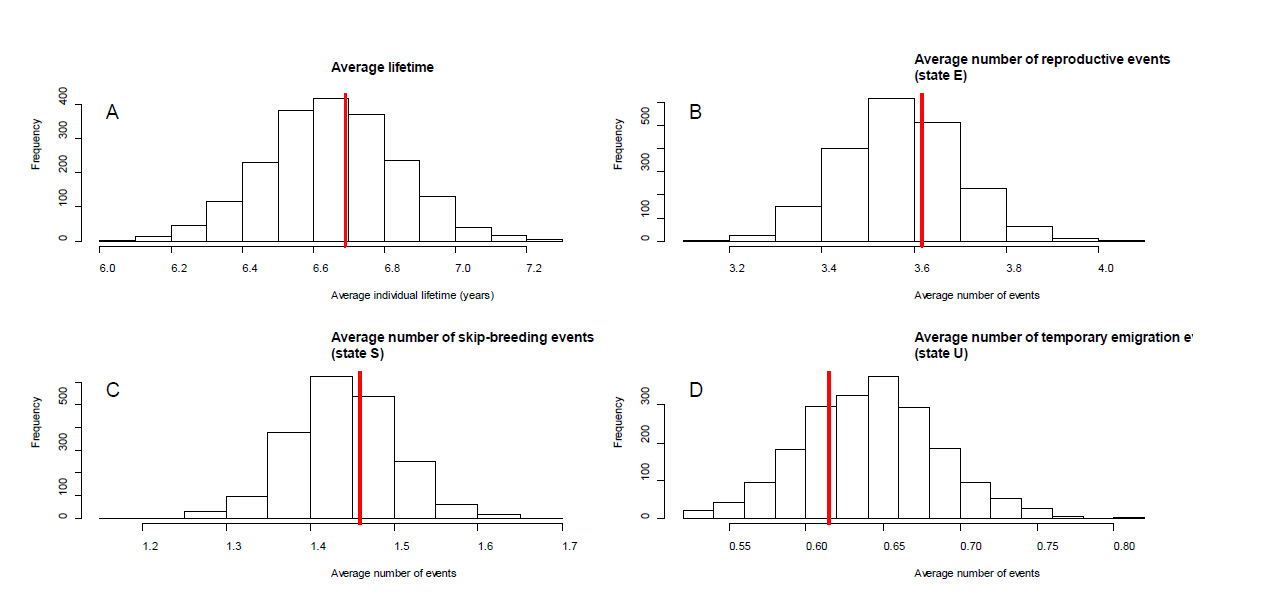
Fig. A1. Posterior predictive distributions for key life events averaged across individual seals: (A) average value of an individual's minimum observed lifetime after recruitment (i.e., number of years between recruitment and last observation), (B) average number of reproductive events (state E), (C) average number of years on sabbatical from pup production while attending Erebus Bay colonies (state S) and (C) average number of years on sabbatical from pup production and temporarily emigrated from Erebus Bay (state U). The histogram represents the distribution of values predicted for 2,000 different draws from the sampled posterior distribution and the red vertical line is the single observed value from the data. The dispersion ('width') of the histogram can be interpreted as predictive model uncertainty, and a misalignment between the histogram and the observed value (red line) would indicate a 'bias' in model predictions (i.e., poor model fit).
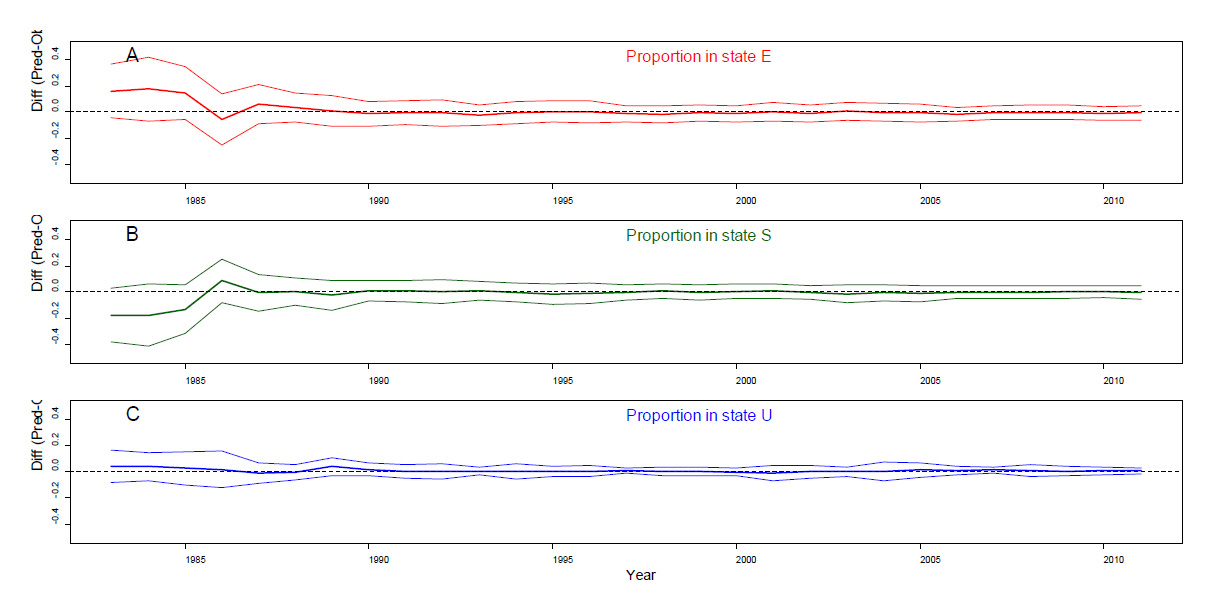
Fig. A2. Differences between predicted values from the model and observed values in the composition of the opulation (i.e., proportion of individuals in each state) for all years of the study (1982-2012). The three states for recruited females each year are shown: (A) females with a pup that year (state E), (B) females on breeding sabbatical but attending Erebus Bay colonies that year (state S), and (C) females on breeding sabbatical and temporarily emigrated from Erebus Bay that year (state U). The horizontal dotted line represents a difference of 0 (no difference) between the observed proportion and the proportion predicted from the model; i.e., an exact match between predictions and observations. The center color line in bold on each plot represents the averaged difference (with the observed value) over 2,000 values predicted, each from a different posterior draw. A misalignment between this color line and the black dotted line would indicate a 'bias' in model predictions (i.e., poor model fit). The two other color lines represent a 95% coverage interval, capturing model predictive uncertainty, of this difference between predictions and observations.
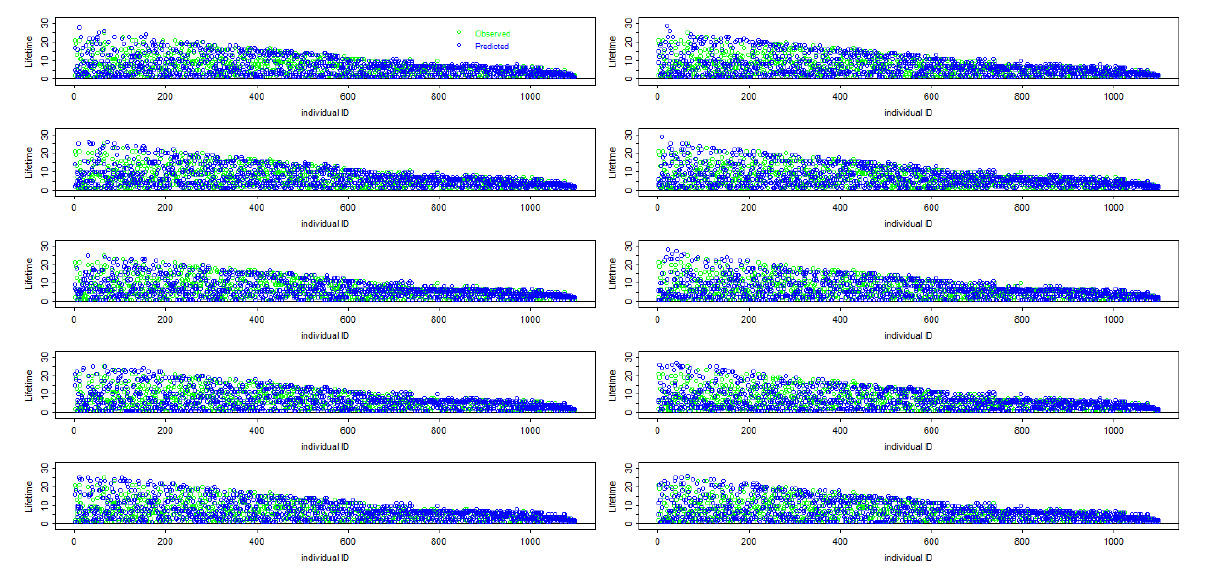
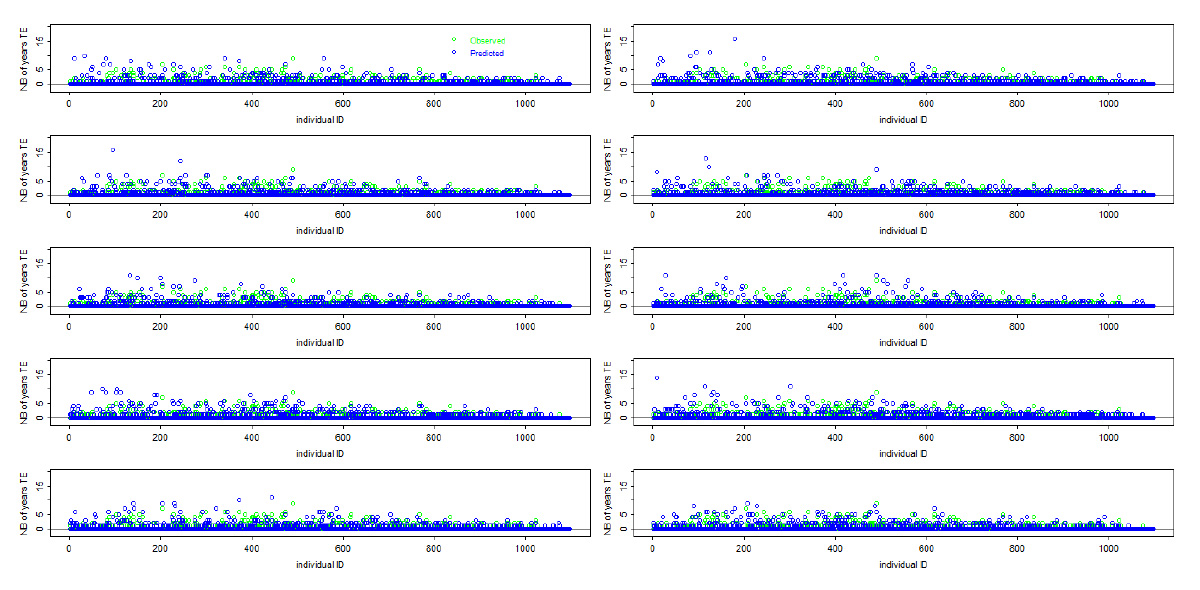
Fig. A3. Observed (green dots) and predicted (blue dots) values of minimum observed lifetime after recruitment ('lifetime' on y-axis, in years) for all individual female seals used in the data (x-axis, total of 1,098 individual females). The minimum observed lifetime after recruitment of an individual is defined as the number of years between its recruitment and last observation. Each panel represents a single replicate of model predictions, from a single posterior draw. Here, only ten replicates (draws) representative of the posterior distribution are shown, because of space constraints, but many more replicates were visually checked.
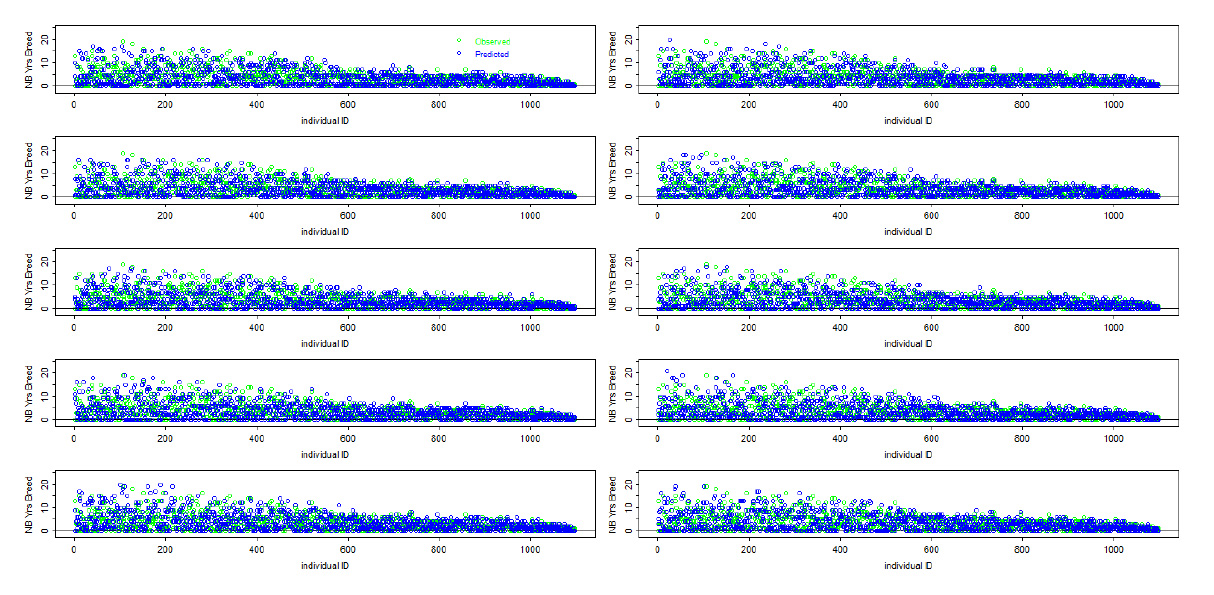
Fig. A4. Observed (green dots) and predicted (blue dots) values of number of reproductive events (state E) (y-axis, in number of years) for all individual female seals used in the data (x-axis, total of 1,098 individual females). Each panel represents a single replicate of model predictions, from a single posterior draw. Here, only ten replicates (draws) representative of the posterior distribution are shown, because of space constraints, but many more replicates were visually checked.
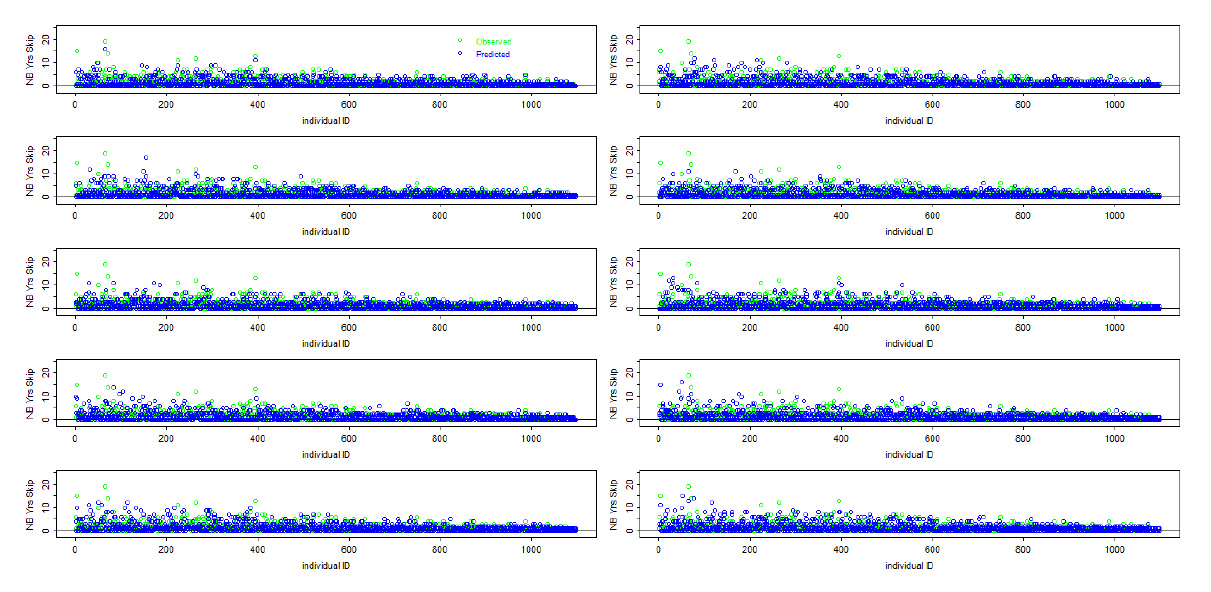
Fig. A5. Observed (green dots) and predicted (blue dots) values of number of skip-reproductive events (state S) while attending colonies (y-axis, in number of years) for all individual female seals used in the data (x-axis, total of 1,098 individual females). Each panel represents a single replicate of model predictions, from a single posterior draw. Here, only ten replicates (draws) representative of the posterior distribution are shown, because of space constraints, but many more replicates were visually checked.
Fig. A6. Observed (green dots) and predicted (blue dots) values of number of temporary emigration events (state U) (y-axis, in number of years) for all individual female seals used in the data (x-axis, total of 1,098 individual females). Each panel represents a single replicate of model predictions, from a single posterior draw. Here, only ten replicates (draws) representative of the posterior distribution are shown, because of space constraints, but more replicates were visually checked.