Ecological Archives E096-047-A5
Katie E. Marshall and Jennifer L. Baltzer. 2015. Decreased competitive interaction drive a reverse species richness latitudinal gradient in subarctic forests. Ecology 96:461470. http://dx.doi.org/10.1890/14-0717.1
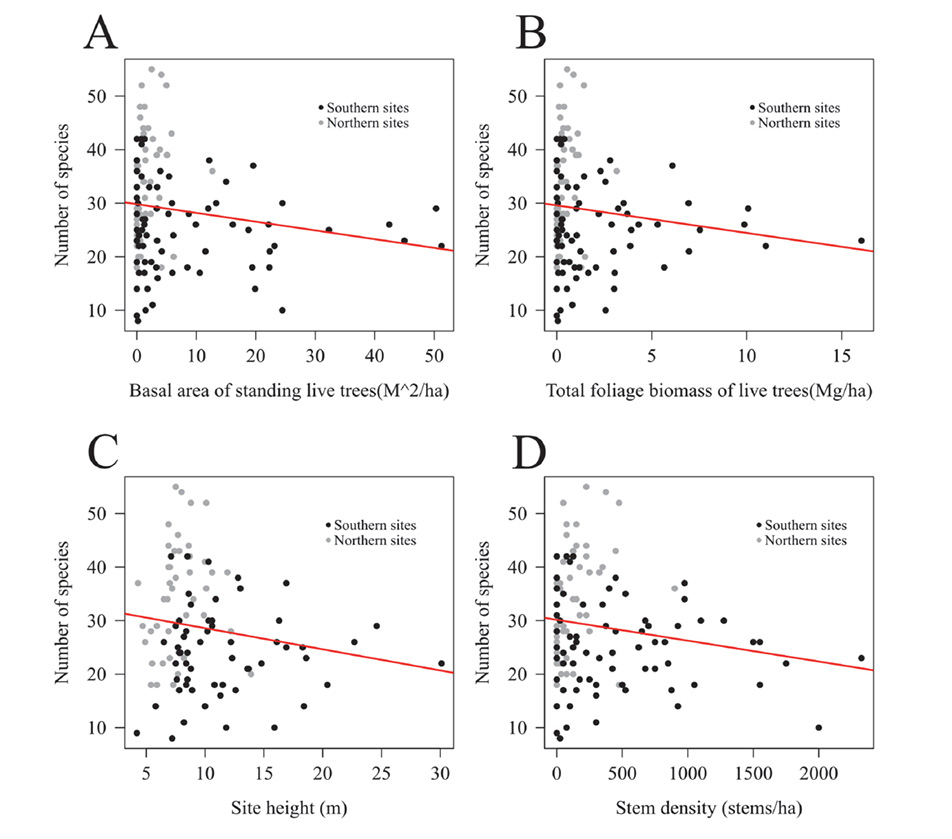
Appendix E. Table showing most significant principal components of principal components analysis of tree stand data, and figures showing relationship of tree stand characteristics with species richness.
Table E1. Loadings of the first two principal components from a principal components analysis of tree stand characteristics of each Permanent Sample Plot in the Taiga Plains ecoregion (n = 125). Loadings with an absolute value > 0.3 are bolded.
PC1 (total standing wood) |
PC2 (Living vs. dead wood) |
|
Average height of main species |
-0.274 |
0.243 |
Average age of trees |
-0.122 |
-0.018 |
Basal area of standing live trees |
-0.316 |
0.227 |
Basal area of standing dead trees |
-0.266 |
-0.376 |
Stem density of standing live trees |
-0.290 |
0.232 |
Stem density of standing dead trees |
-0.230 |
-0.411 |
Total stem wood biomass of live trees |
-0.311 |
0.225 |
Total stem bark biomass of live trees |
-0.314 |
0.216 |
Total branch biomass of live trees |
-0.309 |
0.187 |
Total foliage biomass of live trees |
-0.311 |
0.216 |
Total stem wood biomass of dead trees |
-0.269 |
-0.354 |
Total stem bark biomass of dead trees |
-0.281 |
-0.330 |
Total branch biomass of dead trees |
-0.252 |
-0.334 |
|
|
|
Total variance explained |
65.17% |
21.16% |
Fig. E1. The number of species in a site is negatively correlated with tree stand characteristics including, (A) basal area of standing live trees, (B) total foliage biomass of live trees, (C) average height of standing live trees, and (D) density of stems in each site. Sites >64 ° latitude are plotted in dark gray, while sites < 64 ° latitude are plotted in black. Red lines represent a linear regression between the two parameters plotted (p ranged between 0.056 and 0.157).