Ecological Archives E096-047-A4
Katie E. Marshall and Jennifer L. Baltzer. 2015. Decreased competitive interaction drive a reverse species richness latitudinal gradient in subarctic forests. Ecology 96:461470. http://dx.doi.org/10.1890/14-0717.1
Appendix D. Tables showing most significant principal components of principal components analyses of climate data, with figure showing change in climate parameters over the past 60 years.
Table D1. Loadings of the first two principal components of a principle components analysis of long-term climate data for the Taiga Plains ecoregion (n = 125). Loadings with absolute value of > 0.3 are bolded.
Variable |
PC1 (Temperature) |
PC2 (seasonality) |
Temperature seasonality (coefficient of variation of monthly mean temperature) |
-0.227 |
-0.445 |
Maximum warmest (maximum of monthly mean temperatures) |
0.348 |
-0.21 |
Temperature annual range (difference between maximum of warmest period and minimum of coldest period) |
0.068 |
-0.552 |
Mean temperature of wettest quarter |
0.290 |
0.150 |
Mean temperature of driest quarter |
0.273 |
-0.128 |
Mean temperature of warmest quarter |
0.351 |
-0.185 |
Precipitation of driest month |
0.202 |
0.401 |
Precipitation seasonality (coefficient of variation of monthly mean precipitation) |
0.264 |
0.210 |
Precipitation of driest quarter |
0.235 |
0.238 |
Precipitation of coldest quarter |
0.242 |
0.086 |
End of growing season (Julian day when minimum temperature < -2 °C) |
0.284 |
0.046 |
Mean temperature of growing season |
0.344 |
-0.230 |
Temperature range of growing season |
0.343 |
-0.233 |
|
|
|
Proportion of variance explained |
54.99% |
20.26% |
Table D2. Loadings of the first three principle components of a principal components analysis of climate-related variables from the year immediately prior to vegetation sampling in Taiga Plains ecoregion Permanent Sample Plots. Loadings with absolute value > 0.3 are bolded.
PC1 (temperature) |
PC2 (seasonality) |
PC3 (Winter precipitation, growing season length) |
|
Mean diurnal range (mean of monthly diurnal ranges) |
0.268 |
-0.099 |
-0.183 |
Isothermality (mean diurnal range divided by annual temperature range) |
0.246 |
0.173 |
-0.207 |
Temperature seasonality (coefficient of variation of monthly mean temperature) |
-0.166 |
-0.394 |
0.112 |
Maximum warmest (maximum of monthly maximum temperatures) |
0.244 |
-0.293 |
0.060 |
Minimum coldest (minimum of monthly minimum temperatures) |
0.173 |
0.368 |
0.062 |
Temperature annual range (difference between maximum of warmest period and minimum of coldest period) |
0.064 |
-0.459 |
0.002 |
Mean temperature of warmest quarter |
0.260 |
-0.260 |
0.047 |
Precipitation of wettest quarter |
0.248 |
0.175 |
-0.274 |
Precipitation seasonality (coefficient of variation of monthly mean precipitation) |
0.203 |
0.090 |
-0.396 |
Precipitation of coldest quarter |
-0.075 |
0.059 |
0.365 |
Beginning of growing season (Julian day when mean temperature > 5 ºC for 5 days consecutively) |
-0.163 |
-0.146 |
-0.466 |
End of growing season (Julian day when minimum temperature < -2 °C) |
0.189 |
0.009 |
0.279 |
Length of growing season |
0.201 |
0.093 |
0.433 |
Total growing season precipitation |
0.288 |
0.169 |
-0.050 |
Growing degree days during growing season |
0.280 |
-0.186 |
0.132 |
Annual mean temperature (mean of monthly means) |
0.309 |
0.109 |
0.106 |
Annual maximum temperature (mean of monthly maximums) |
0.319 |
0.069 |
0.047 |
Mean temperature of growing season |
0.211 |
-0.281 |
-0.144 |
Temperature range of growing season |
0.257 |
-0.274 |
0.005 |
|
|
|
|
Proportion of variance explained |
49.68 % |
22.33 % |
13.77 % |
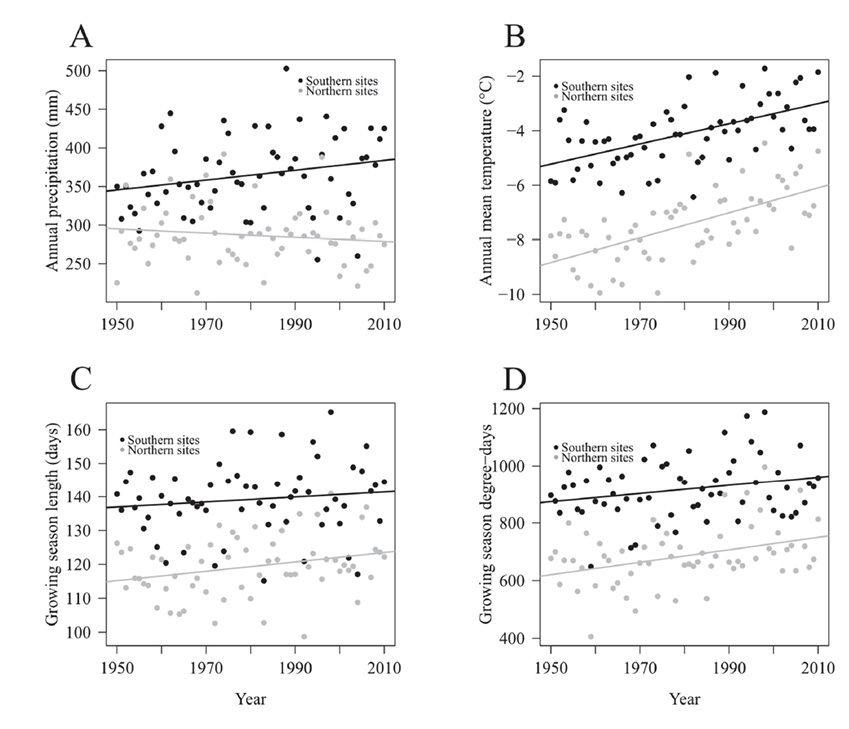
Fig. D1. Climate has significantly shifted in the Taiga Plains over the past 60 years in both northern (> 64 º latitude) and southern sites (<64 º latitude). Each point represents a mean for all sites in the north or south in each year. (A) Annual precipitation is significantly greater in the south than the north (F1,118 = 97.58, p < 0.001), although there is no significant change over time (F1,118 = 0.66, p = 0.4165). (B) Annual mean temperature is significantly higher in the south than the north (F1,118 = 349.43, p < 0.001), and has increased significantly with time (F1,118 = 65.96, p < 0.001). (C) The growing season is longer in the south than the north (F1,118 = 127.47, p < 0.001), and has increased significantly with time (F1,118 = 4.55, p = 0.035). (D) The number of growing season degree-days is significantly greater in the south (F1,118 = 166.27, p < 0.001), and has significantly increased with time (F1,118 = 12.42, p < 0.001).