Ecological Archives E096-046-A2
Marianne Mugabo, Samuel Perret, Beatriz Decencière, Sandrine Meylan, and Jean-Franҫois Le Galliard. 2015. Density-dependent immunity and parasitism risk in experimental populations of lizards naturally infested by ixodid ticks. Ecology 96:450460. http://dx.doi.org/10.1890/14-0524.1
Appendix B. Path analyses.
Path analyses were conducted separately in adults and in yearlings to investigate the relationship between density, local inflammation and tick abundance. We tested three alternative models described by the path diagrams in Fig. B1. Alternative path models were compared using Shipley's d-separation test, which is suitable for data with a hierarchical structure and non-normally distributed variables contrary to structural equations models (Shipley 2000a, b, 2003, 2009). This method tests the full causal hypothesis represented in a path diagram using the statistic  (follows a chi-squared distribution with 2k degrees of freedom), where p is the null probability of the ith independence claims within the basis set of independencies. In directed acyclic graphs, the basis set of independencies consists of each pair of variables in the graph that do not have an arrow between them and the conditioning set for each such pair contains all variables that are their causal parents (see Shipley 2009). In all cases, a causal model is rejected if the P value associated with the C statistic is below the significance level (0.05, Shipley 2000a, 2009) . There were two possible alternative saturated path models to our three unsaturated models: saturated model 1: density has a direct effect on tick abundance and local inflammation and tick abundance has a direct effect on local inflammation; saturated model 2: density has a direct effect on tick abundance and local inflammation and local inflammation has a direct effect on tick abundance. The Shipley's d-separation test is not applicable to saturated path models (Shipley 2000a) because a path model must include at least two unconditionally independent variables (i.e., with no direct path between them) or two conditionally independent variables (i.e., which are independent conditioned on at least one other variable remaining constant, e.g., in A→B→C, A and C are independent conditioned on B remaining constant). However, if a saturated path model was best supported by our data, then our three alternative unsaturated path models would all have been rejected based on C because none of the pairs of variables in the basis set of independencies would have been independent. This was not the case for adults or for yearlings.
In addition, we did not include tick prevalence in our path analyses because prevalence and abundance were correlated (Pearson's product-moment correlation coefficient in adults = 0.33 [0.14, 0.49] 95% CI, t = 3.48, df = 99, P = 0.0007; in yearlings = 0.49 [0.37, 0.58] 95% CI, t = 7.84, df = 99, P < 0.0001). Path models with correlated errors are not directed acyclic graphs and therefore, Shipley's d-separation test (Shipley 2000a) cannot be used (but see Shipley 2003 for extended tests (exact or approximate) applicable to path models with correlated errors). However, because prevalence is a component of abundance, insights gained on the relationship between density, local inflammation and tick abundance using these path analyses are also relevant for tick prevalence. In addition, the same best alternative models were found in adults and in yearlings when prevalence was used in the path models instead of abundance (see results section below), or when both prevalence and abundance were included in path models and approximate d-separation tests were conducted using Bonferroni corrections of the null probabilities pi to account for the non-independence of the two d-separation independence claims in models 2 and 3 due to the correlation between tick prevalence and abundance (see Shipley 2003 for more details on the approximate extended d-separation test), results not shown).
We used the d-separation method to assess the basis set of independencies from each path model (see Table B1). For each independence claim, we used hierarchical linear and generalized linear modeling with the right distribution and link functions as well as with a random enclosure effect and we calculated the null probability of independence between the two variables of the independence claim (Shipley 2009). Based on this, we calculated the C statistic for each path model and compared the support received by each alternative models using Akaike's information criterion (AICc and ΔAICc, Shipley 2013). Models whose ΔAICc are less than 3 are considered to be substantially supported while models whose ΔAICc are more than 10 receive no support (Burnham et al. 2011). In adults, we found that models 2 and 3 were not rejected based on C and were both equally supported based on AICc. In yearlings, model 1 was the only non-rejected and supported model based on C and AICc (Table B1). To draw Figure 4 in the main text, estimates of path regression coefficients (and 95% CI) were then obtained using linear and generalized linear models. Estimation of direct paths of models 2 and 3 in adults enabled us to reject model 2 over model 3 because local inflammation did not affect tick abundance (Fig. 4A, path coefficient = -0.072 [-0.275, 0.131] 95% CI). When prevalence was included in path models instead of abundance, model 3 was the only non-rejected and supported model in adults based on C and AICc (Cmod 3 = 4.43, df = 2, P = 0.11; AICc(mod 3) = 24.41, ΔAICc(mod 1-mod 3) = 3.1; ΔAICc(mod 2-mod 3) = 10.8) and model 1 was the only non-rejected and supported model in yearlings based on C and AICc (Cmod 1 = 0.38, df = 2, P = 0.83; AICc(mod 1) = 24.40, ΔAICc(mod 2-mod 1) = 8.8; ΔAICc(mod 3-mod 1) = 5.1).
Literature cited
Burnham, K. P., D. R. Anderson, and K. P. Huyvaert. 2011. AIC model selection and multimodel inference in behavioral ecology: some background, observations, and comparisons. Behavioral Ecology and Sociobiology 65:23–35.
Shipley, B. 2000a. Cause and correlation in biology: a user's guide to path analysis, structural equations and causal inference. Cambridge University Press, Cambridge, UK.
Shipley, B. 2000b. A new inferential test for path models based on directed acyclic graphs. Structural Equation Modeling-a Multidisciplinary Journal 7:206–218.
Shipley, B. 2003. Testing recursive path models with correlated errors using D-separation. Structural Equation Modeling 10:214–221.
Shipley, B. 2009. Confirmatory path analysis in a generalized multilevel context. Ecology 90:363–368.
Shipley, B. 2013. The AIC model selection method applied to path analytic models compared using a d-separation test. Ecology 94:560–564.
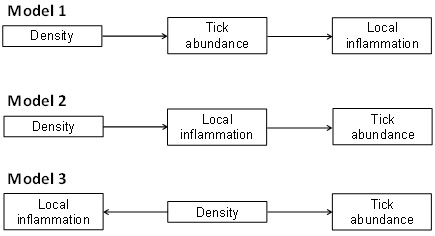
Fig. B1. Alternative path diagrams of the density dependence of local inflammation and tick abundance. In the first scenario (path model 1), density indirectly influences local inflammation through its direct effects on tick abundance. In the second scenario (path model 2), density indirectly affects tick abundance through its direct effects on local inflammation. In the third scenario (path model 3), density affects directly and independently local inflammation and tick abundance.
Table B1. Tests of conditional independence in the basis sets of independencies implied by alternative models 1, 2, and 3 presented in Fig. B1 for adults and yearlings. Notation (1, 3)|{2} means that variables 1 and 3 are independent conditioned on variable 2 remaining constant (Shipley 2009). Standardized estimates (± se) are provided for the variable whose partial regression slope should be zero if the d-separation claim of independence is not rejected, based on the null probabilities pi (Shipley 2009). Partial slopes for tick abundance are provided on the log scale. Non-rejected path models based on the C statistic are in italics and supported path models based on AICc are in bold.
Age class |
Model |
D-sep claim of independence |
Partial slope ±SE |
LRT |
Null probability pi
(distribution) |
C (df, P) |
AICc (K)* |
ΔAICc |
Adults |
1 |
(1, 3)|{2} |
1: -0.250 ± 0.097 |
5.24 |
0.02 (normal) |
7.63 (2, 0.02) |
27.61 (9) |
5.31 |
|
2 |
(1, 2)|{3} |
1: 0.266 ± 0.158 |
2.58 |
0.14 (poisson-lognormal) |
3.98 (2, 0.14) |
23.95 (9) |
1.65 |
|
3 |
(2, 3)|{1} |
2: -0.104 ± 0.097 |
1.14 |
0.31 (normal) |
2.32 (2, 0.31) |
22.30 (9) |
0.0 |
Yearlings |
1 |
(1, 3)|{2} |
1: -0.049 ± 0.085 |
0.33 |
0.57 (normal) |
1.12 (2, 0.57) |
20.05 (9) |
0.0 |
|
2 |
(1, 2)|{3} |
1: -0.291 ± 0.101 |
6.55 |
0.02 (poisson-lognormal) |
8.15 (2, 0.02) |
27.09 (9) |
7.0 |
|
3 |
(2, 3)|{1} |
2: -0.257 ± 0.071 |
12.42 |
0.0004 (normal) |
15.53 (2, 0.004) |
34.47 (9) |
14.4 |
Variables 1: density, 2: tick abundance, 3: local inflammation.
* n = 101 in adults and n = 202 in yearlings.
[Back to E096-046]