Ecological Archives E096-030-D1
Christopher D. Stallings, Alejandra Mickle, James A. Nelson, Michael G. McManus, and Christopher C. Koenig. 2015. Faunal communities and habitat characteristics of the Big Bend seagrass meadows, 20092010. Ecology 96:304. http://dx.doi.org/10.1890/14-1345.1
Introduction
Seagrass meadows are inhabited by an abundant and diverse assemblage of flora and fauna, including species that are ecologically- and economically-important as well as those of great conservation concern (Lindall and Saloman 1997, Gillanders 2006). They can have high natural levels of heterogeneity in both habitat characteristics (e.g., density and height of grass blades, distance to and type of adjacent terrestrial habitats) and associated fauna, making them ideal study systems for understanding species-habitat relationships at multiple spatial scales, biodiversity and community organization patterns, and estimating secondary productivity. Indeed, seagrass systems were among the first in the marine environment for which ecologists applied a landscape approach (termed seascape in marine ecosystems; Robbins and Bell 1994, Bell et al. 1995, Bell et al. 2006). However, seagrass systems worldwide have undergone sharp declines in coverage and increased levels of fragmentation, thus compromising their ecological, societal, and scientific values (Zimmerman and Livingston 1976, Lewis and Estevez 1988, Robblee et al. 1991, Fourqurean and Robblee 1999, Zieman et al. 1999, Orth et al. 2006, Waycott et al. 2009).
The northeastern Gulf of Mexico is home to one of the largest (ca. 3000 km²), least polluted, and most intact seagrass meadows in the world (Zieman and Zieman 1989, Livingston 1990, Mattson 2000). The region extending from the mouth of the St. Marks River, Florida in the north to Anclote River, Florida in the south is colloquially called the "Big Bend" as this is where the Florida panhandle bends to the peninsula (Fig. 1). Human populations are quite low and sparsely-located in the region, which has extensive areas of undeveloped coastal habitats. Although previous and ongoing scientific efforts in the Big Bend seagrass meadows have addressed many important issues, most have been conducted at relatively local scales or on select taxa. The only exceptions have been inventories on the presence of seagrasses conducted in 1974–1980 (Iverson and Bittaker 1986) and repeated in 2000 (Hale et al. 2004), which covered a large spatial extent of the greater Big Bend, although not its entirety as defined here and by others (e.g., Mattson 2000). No previous effort has set out to characterize the seagrass habitats and associated faunal communities across the entire region.
Here we present a data set collected on the habitats and associated macrofauna from seagrass meadows in the Big Bend. To date, these data represent the most spatially- and taxonomically-extensive information for seagrass habitats in the region. Our efforts can help to address a number of research objectives involving species-habitat relationships and biodiversity metrics across a large, relatively undisturbed coastal habitat.
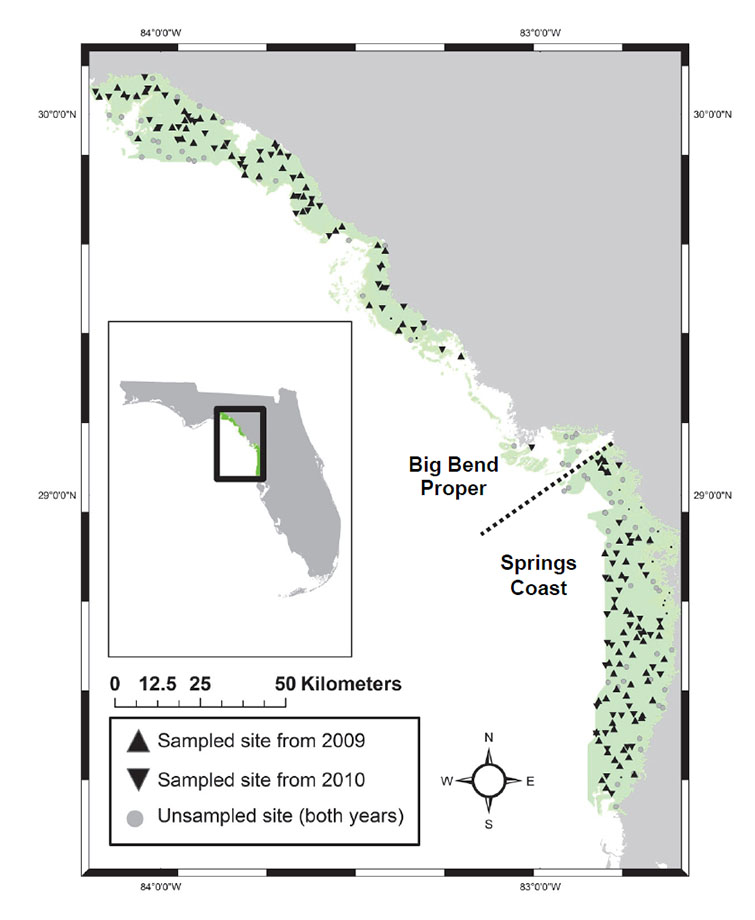
Fig 1. Map of study region showing the Big Bend seagrass beds and the locations of sites that were both sampled (separated by years) and visited but not sampled (across years). The northern (Big Bend Proper) and southern (Springs Coast) sections are labeled and delineated with a hashed line.
Metadata
Class I. Data set descriptors
A. Data set identity: Macrofaunal community (fishes and invertebrates) and habitat data from seagrass beds in the Big Bend region of Florida, USA
B. Data set identification code: BBSG_2009-2010_*
C. Data set description: These data sets include faunal community data from the Big Bend Seagrass (BBSG) beds located in the northeastern Gulf of Mexico off the coast of Florida, USA. Sites were selected using a spatially-balanced approach (Stevens and Olsen 2004, Olsen et al. 2012) and sampling was conducted with beam trawls during the summers of 2009 and 2010. All animals were identified to lowest taxonomic level possible, counted and their sizes measured. Habitat characteristics were concurrently measured at both local- (e.g., seagrass areal coverage and composition, volume of drift algae) and regional-scales (e.g., latitude, type of adjacent coastal habitat).
Principal Investigators: Christopher D. Stallings, College of Marine Science, University of South Florida 33701, USA
Christopher C. Koenig, Florida State University Coastal and Marine Laboratory, St. Teresa, FL 32358, USA
Abstract: Seagrass meadows are important habitats that serve as nursery, feeding, and sheltering grounds for many marine species. In addition to the ecosystem functions and services they provide, seagrass habitats and associated fauna are commonly observed to have naturally high levels of heterogeneity, making them ideal for the study of ecological patterns and processes across multiple spatial scales. However, seagrass systems worldwide have undergone sharp declines in coverage and increased levels of fragmentation at both local and regional spatial scales, thus compromising their ecological functions and services and reducing their value as unaltered marine systems in which to conduct ecological studies. Covering nearly 3000 km², the seagrass meadows of the Big Bend region in the eastern Gulf of Mexico represents one of the largest in the world, and given its separation from human population centers and coastal development, is also considered to be one of the most intact and least disturbed. The objective of our study was to provide the first region-wide characterization of the habitats and faunal communities in seagrass meadows of the Big Bend. This two-year study occurred in 2009 and 2010 during the summers when peak productivity in seagrass systems is highest. Sites were selected using a spatially-balanced approach and sampling was conducted with beam trawls. A total of 170 sites was sampled, and all animals were identified to lowest taxonomic level possible, counted, and their sizes measured. Habitat characteristics were concurrently measured at both local (e.g., seagrass areal coverage and composition, volume of drift algae) and regional scales (e.g., latitude, type of adjacent coastal habitat).
D. Key words: beam trawl; Geographic Information Systems; habitat heterogeneity; seagrass; seascape ecology; secondary productivity; spatially-balanced sampling; submerged aquatic vegetation (SAV).
Class II. Research origin descriptors
A. Overall project description
Identity: Macrofaunal community (fishes and invertebrates) and habitat data from seagrass beds in the Big Bend region of Florida, USA
Originators: C. D. Stallings, C. C. Koenig
Period of study: 2009–2010
Objectives: Our objectives for collecting these data were to (1) Spatially characterize the communities of fish and macro-invertebrates across the Big Bend region and identify subregions of different seagrass habitat and animal communities and (2) Identify species-habitat relationships at local and regional spatial scales. Our research represents the first effort to characterize the faunal communities in seagrass meadows across the entire Big Bend region, and provides the most comprehensive data set on associated species distributions, abundances, and densities. In addition to addressing questions concerning species-habitat relationships, biodiversity, etc., these data may serve as a baseline in the event of future chronic (e.g., land development and urbanization, climate change) or acute (e.g., natural disasters, oil spills) disturbances to the region.
Sources of Funding: Funding for the field surveys was provided to C. D. Stallings and C. C. Koenig by the U.S. Fish and Wildlife Service/State Wildlife federal grant number T-15, Florida Fish and Wildlife Conservation Commission agreement number 08007. Additional funding was provided by the U.S. National Oceanic and Atmospheric Administration (Northern Gulf of Mexico Cooperative Institute 191001-363558-01).
System description: The Big Bend region of the northeastern Gulf of Mexico, named for the area in Florida where the panhandle bends to the peninsula, is located from approximately the mouth of the St. Marks River in the north (N 30.1, W -84.1) to Anclote River in the south (N 28.2, W -82.6) (Fig. 1). It has a wide (~ 150 km), gently sloping shelf and is a rare example of a zero-energy coastline (Murali 1982, Dawes et al. 2004). The region is commonly divided into two segments based on geology, hydrology and climate. The northern section (the "Big Bend Proper") extends from the St. Marks River southward to Waccasassa Bay, has eight freshwater stream systems feeding into it (the St. Marks, Aucilla, Econfina, Fenholloway, Steinhatchee, Suwannee, and Waccasassa Rivers and Spring Warrior Creek) including both surface-water runoff from drainage basins and spring-fed groundwater from the Floridan aquifer, which typically undergo river flood seasons in the winter (January – March) (Mattson et al. 2006). The Big Bend Proper can be further divided into four subregions based on embayment, listed here from north to south: (1) Apalachee Bay, (2) Deadman Bay, (3) Suwannee Sound, and (4) Waccasassa Bay. The southern section (the "Springs Coast") extends from Withlacoochee Bay southward to Anclote River and has seven freshwater streams feeding into it (the Withlacoochee, Crystal, Homosassa, Chassahowitzka, Weeki Wachee, Pithlachascotee, and Anclote Rivers). With the exception of the Withlacoochee River, which has both spring and surface runoff, the other six rivers are entirely spring fed. River flood season on the Springs Coast typically occurs in the late summer (July – September) (Mattson et al. 2006).
The coastal region of the greater Big Bend is considered to be one of the least disturbed in North America (Zieman and Zieman 1989, Livingston 1990, Mattson 2000), likely a result of limited anthropogenic influences. Generally, the townships and other areas of development in the region are small and sparsely-located. The main exception is pulp-mill effluent from the Fenholloway River which drains into Apalachee Bay (Big Bend Proper) and has high levels of sulfate and other nutrients, high biochemical oxygen demand (BOD), and suspended solids. Localized reductions in water clarity and seagrass coverage have been observed near the mouth of the Fenholloway River (Livingston et al. 1998). The southern end of the Springs Coast is also undergoing increased development as the urban expanse of the greater Tampa Bay region progresses northward. However, most of the adjacent terrestrial habitat in the region is undeveloped and removed from obvious and pervasive anthropogenic effects. Extensive saltmarsh (primarily Juncus roemerianus, Spartina patens and S. alterniflora) is the primary coastal habitat adjacent to the extensive seagrass meadows of the greater Big Bend, with the presence of mangroves (mostly Rhizophora mangle) increasing towards the southern portion.
B. Survey design
B.1. Site selection and evaluation: We used a design that allowed for an equal distribution of sampling locations. Spatially-balanced sampling approaches have recently been developed (e.g., Stevens and Olsen 2004, Olsen et al. 2012) that incorporate similar characteristics as random or systematic ones, but also guarantee that all samples are evenly distributed across the entire sampling frame (rather than clumping commonly associated with random sampling or distinct intervals associated with systematic sampling). Sites were chosen from Florida's Statewide Seagrass polygon Geographic Information System (GIS) data set, compiled by the Florida Fish and Wildlife Conservation Commission-Fish and Wildlife Research Institute, Center for Spatial Analysis (FWRI 2007). We used an Albers Equal Area projection for the shapefile. The file, which includes all seagrass coverage across the state of Florida, was clipped to include only the Big Bend region from the St. Marks River in the north and the Anclote River in the south. From the clipped polygon, we then chose sites using the spsurvey package (Kincaid et al. 2008) in the R software environment (R Development Core Team 2008). We choose a target of100 sites per sampling season (example R code for 2009 site selection provided in BBSG_2009-2010_site_selection_code_2009.txt; see Class V.C.). However, because we anticipated that sampling could not be conducted at some sites (e.g., due to lack of target habitat, logistical constraints), we also chose additional "oversampling" sites to replace target sites that had to be dropped from the initial sample. Based on pilot trials conducted in the northern region of our study area during the summer of 2008, we chose a 23% oversample for our 2009 season (100 target + 23 oversample). Based on the 2009 sampling season, we chose a 27% oversample in 2010 (100 target + 27 oversample). Ideally, sampling would proceed by first visiting all target sites, then visiting the required number of oversampled sites to meet the target sample size. However, this two-step approach was not possible in the current study given the large area over which sites were located. We therefore visited all oversampled sites as we visited target ones (i.e., we did not back track). Fourteen of the 123 sites that were drawn in 2009, and nine of the 127 sites from 2010 were dropped due to navigational hazards; typically this meant the site was located in a channel used by other boaters, was located in extremely shallow water that we were unable to access or trawl, or there was a physical barrier such as an oyster bar or shoal that precluded access. The remaining 109 sites from 2009 and 118 sites from 2010 were evaluated for suitable habitat to conduct sampling.
Once we arrived at a site, we determined whether it could be sampled based on two criteria: (1) it had to include ≥ 10% seagrass cover and (2) there were no hazards present, to the trawl (e.g., due to presence of rocks or other hard substrate), the research vessel or researchers (e.g., due to navigational hazards such as extremely shallow water), or other boaters (e.g., due to presence of other boats anchored or heavy boat traffic). If the site did not meet both criteria, we began piloting the research vessel in a spiraling manner around the site location to determine if there was suitable habitat nearby. We continued the spiraling until we had traveled 250 m from the original site (i.e., 500 m diameter circle, 196,350 m² area around site). If no suitable habitat was found, we dropped the site and noted the reason. Among the sites evaluated, 91 of the 109 in 2009 and 79 of the 118 in 2010 met the two criteria. The primary reason for a site not meeting both criteria was that it had less than 10% seagrass cover (usually with no seagrass), often with other floral (e.g., attached macroalgae), faunal (e.g., octocorals, sponges), or geological characteristics (e.g., rocky reefs) that may have been incorrectly interpreted as seagrass from the aerial photos used to inform the GIS shapefile.
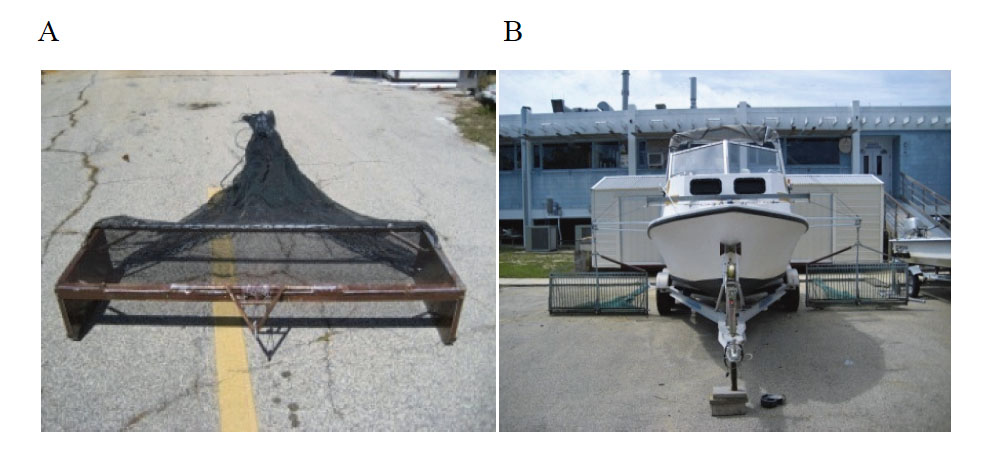
B.2. Faunal data collection: If suitable habitat was found either at the site or from our spiraling search, we sampled it using beam trawls (mouth opening: 1.87 meter (m) wide by 0.40 m tall; bag dimensions: 19 mm mesh with 3 mm mesh liner) towed on both sides of a 6.1 m research vessel (Fig. 2). Beam trawls were the most appropriate gear for our study for several reasons. First, water depths in the region exceeded 5 m at some sites, precluding the use of seine nets and drop traps that are commonly used in shallow seagrass beds (Edgar et al. 2001). Additionally, we sought to sample across a large area within each site, thus requiring a towed trawl gear. Beam trawls are advantageous over otter trawls (which is a commonly used towed gear in seagrass systems) because they retain a constant sampling volume during tows both across sites (otter trawl sampling volume can be affected by bottom substrate, which varies across the study region) and within them (otter trawl sampling volume decreases as the net fills because the doors are pulled inward) (Rozas and Minello 1997, Stallings et al. 2014a). Higher and less variable capture efficiencies in beam trawls have also been attributed to the fixed mouth opening (Kuipers et al. 1992). Indeed, Zimmerman et al. (1986) demonstrated that beam trawls had markedly higher capture efficiencies of penaeid shrimp (a common seagrass fauna) than seines and otter trawls. Additionally, otter trawls tend to ride on top of submerged aquatic vegetation, allowing animals to escape underneath the net, resulting in low capture efficiency (Leber and Greening 1986, Stallings et al. 2014a). Conversely, we demonstrated in pilot trials that the beam trawls remained in contact with the seafloor while being towed at varying depths, on different substrates (e.g., soft sand, compacted sand), and in different seagrass compositions and areal coverage.
Fig 2. Photos showing (A) the beam trawls used in the current study and (B) the research vessel with paired trawling booms (Note: the trawls connected to the booms in photo (B) were not beam trawls these were from a different study that used the same system; Stallings et al. 2014). Photo credit: C. D. Stallings.
We towed the trawls from the sides of the boat (instead of astern) to eliminate problems with prop-wash on catch rates in shallow water. The trawls were towed for 2.5 minutes at a standard rate of 1.8–2.0 km/h (ca. 85 m). This tow speed (based on direct underwater observation) was determined to be the most efficient; faster tows caused the net to ride off the bottom and slower tows allowed animals to escape (personal observation during gear trials). The towing direction was determined a priori with a random number generator from 1-360 (i.e., the heading direction in degrees). However, the trawl gears operate most efficiently and safely (i.e., avoiding contact with boat motor propeller) when towed downwind, so we adjusted accordingly. The locations of the start and end of each tow were marked in decimal degrees using a Global Positioning System (GPS), which allowed us to measure tow distance and calculate the area sampled.
All captured animals were identified to the lowest possible taxon, and most were counted, and measured in size classes. We did not count or measure the sizes of colonial fauna (e.g., ectoprocts, ascidians), the tests of tube worms (e.g., sabellariids) or the shells of worm snails (e.g., vermetids), but we noted their presence. Among the major groups of fauna observed, we were able to identify 93.4% of the taxa to species for actinopterygian fishes (92 taxa), 85.2% for bivalves (34 taxa), 85.0% for echinoderms (20 taxa), 76.8% for gastropods (95 taxa), and 70.1% for arthropods (87 taxa). Due to the large quantity of animals that had to be measured, we used size classes to expedite the process. Based on previous research using trawl gears in seagrass beds (e.g., Stallings et al. 2010), we used six size classes for the current study: (1) 1-25 mm, (2) 26-50 mm, (3) 51-75 mm, (4) 76-100 mm, (5) 101-150 mm, (6) ≥ 151 mm. We measured the total length for teleosts, carapace width for crabs, post-orbital head length for shrimp, diameter for echinoderms, and longest plane for molluscs. Once animals were identified, counted, and measured, they were then released back into the water. Care was taken to minimize harm to the animals. Some animals were retained to allow for identification in the laboratory, where microscopes and detailed taxonomic keys were present (keys used: Schultz 1969, Morris 1973, Hoese and Moore 1977, Lindner 1978, Abbott et al. 1985, Abele and Kim 1986, Robbins et al. 1986, Kaplan 1988, Littler 1989, Kensley and Schotte 1989, Humann and DeLoach 1992, Humann and DeLoach 1994, Abbott et al. 1995, Hendler 1995, Hoese and Moore 1998, McEachran and Fechhelm 1998, Voss 2002, Pomory 2007, Mikkelsen and Bieler 2008; supplemental online resources used: http://www.algaebase.org/, http://www.fishbase.org/, http://www.gastropods.com/, http://www.itis.gov/, http://www.jaxshells.org/, http://www.marinespecies.org/, http://www.sealifebase.org/ ).
In addition to fauna, the catch in trawl nets often included seagrass blades and drift algae. It was important to remove animals that were attached to the seagrass and entrained in the drift algae. During the 2009 field season, we did this by vigorously rinsing all plant materials in 19 liter buckets filled with seawater. The seawater was then drained through a 0.5 mm wire sieve and remaining materials, which were mostly fauna mixed with sediments and plant debris, were placed in a plastic bag labeled with site location. The sample was frozen and animals were identified and measured in the laboratory.
The seawater rinse did well to remove most animals attached to the plant materials. This was readily confirmed by visual inspection of seagrass blades where no animals remained attached after the rinse. However, we were concerned at the end of the 2009 field season that a more careful approach was needed to accurately count the number of very small arthropods and molluscs commonly associated with the drift algae. We therefore slightly altered our protocols to separate fauna from drift algae for the 2010 field season. We continued to use a vigorous seawater rinse of seagrass blades in 2010. For the drift algae, we would first separate all large fauna (e.g., most fishes, large crabs) leaving only the smallest arthropods and molluscs. The total volume of the drift algae captured was then measured using a calibrated 19 liter bucket. In 2009, the median volume of drift algae per tow was 15,142 mL. In 2010, we collected a 3785 mL subsample of drift algae, which was approximately 25% of this median value. The 3785 mL subsample was taken by haphazardly grabbing small clumps from the algae collected in the trawl. We used this haphazard selection to avoid subsampling a single small section of the algae. The entire subsample was bagged, labeled, frozen, and taken back to the laboratory. In the laboratory, the algae was first vigorously rinsed in 19 liter buckets containing seawater and remaining sample sieved, as was done during the 2009 field season. The rinsed algae was then carefully inspected for the presence of remaining fauna. As suspected, small arthropods and molluscs remained entrained in the algae. These animals were meticulously removed by picking each individual with forceps. Animals were then identified, counted, and measured. Site abundances for these subsampled animals were calculated as the number of animals counted multiplied by the percent of subsampled algae (total volume of captured drift algae / volume of subsampled drift algae).
B.3. Habitat and environmental data collection: We measured several parameters concurrently with our sampling efforts of fauna. To characterize the benthic habitats, we used rapid assessment protocols which can perform well at spatial scales relevant to our trawling methods (Neckles et al. 2012). Once the trawl tow was completed, we piloted the research vessel to the start location of the tow recorded by GPS. A free diver entered the water and swam behind the research vessel as it drifted or was slowly piloted over the trawled area using the track from the GPS. The diver estimated the areal coverage of each major habitat-forming seagrass species, attached macroalgae and sand over a belt transect of 8 m wide (4 m on either side of the vessel's track) * ~85 m long (determined by length of trawl tow). The diver also estimated the range (minimum – maximum) and mode of seagrass blade lengths for each species. Additional information about the orientation of the habitat was recorded (e.g., Thalassia testudinum and Syringodium filiforme intermixed or in separate patches). We measured the volume of drift algae captured in the trawls [later corrected as a density (mL/m²) -- for area trawled] using a calibrated 19 liter bucket. Last, we measured depth using a transom-mounted bottom sounder and temperature, salinity, conductivity, and dissolved oxygen) at the site using a YSI-85.
In addition to local-scale parameters measured in the field, our data set also includes regional-scale parameters that were measured in ArcMap 10.1 using available GIS data. These include latitude, longitude, distance from shore (i.e., shortest straight distance from site to nearest land), distance to offshore edge (i.e., shortest straight distance from site to seagrass edge as defined by GIS), and the primary and secondary types of adjacent shore habitat (e.g., salt marsh, mangrove, urban residential) estimated from Florida's Statewide Seagrass polygon Geographic Information System (GIS) dataset (FWRI 2002).
Class III. Data set status and accessibility
A. Status
Latest data update: May 2012
Latest metadata update: Metadata are complete.
Data verification: Data were reviewed and corrected for any input errors
B. Accessibility
Storage location and medium: Raw data sheets and digital data are stored with C. D. Stallings on multiple hard drives in two physical locations. Digital data are also backed up on a commercial cloud-based server at an off-site location.
Contact person(s): C. D. Stallings, Assistant Professor, College of Marine Science, University of South Florida, 140 7th Avenue Southeast, St. Petersburg, Florida, 33701, USA. [email protected]
Copyright or proprietary restrictions: There are no copyright or proprietary restrictions for research or teaching purposes. Usage of the data set must be cited with the below citation.
Citation: Stallings, C. D., A. Mickle, J. A. Nelson, M. G. McManus, and C. C. Koenig. 2015. Faunal communities and habitat characteristics of the Big Bend seagrass meadows, 2009–2010. Ecology 96: 304. http://dx.doi.org/10.1890/14-1345.1
Disclaimers: No sampling gear or method has 100% capture efficiency. Beam trawls are the recommended gear to use in seagrass beds when researchers need to sample large areas across depths exceeding 5 m (Edgar et al. 2001). However, our beam trawls were likely best at capturing fishes and invertebrate macrofauna that were closely associated with the seagrass habitat. Conversely, upper water column fishes commonly found near seagrass beds (e.g., anchovies) and smaller invertebrate epifauna (e.g., amphipods, isopods) may have been underrepresented in our catch and caution is warranted when interpreting their relative abundances in this data set. We also cannot rule out the possibility of missing some animals in seagrass beds with canopy heights exceeding that of the beam trawl. However, we do not believe this would have been a strong effect, if it existed at all, due to two observations. First, as the beam trawl is towed over seagrass, the blades are temporarily pushed downward and pass through the mouth opening of the gear. Second, seagrass-associated fauna tend to exhibit a strong flight response of moving downward towards in the seagrass habitat for refugia, rather than upwards into the water column (peronal observation). Although species-specific capture efficiency may differ, we have no reason to believe this varied with canopy height. Last, we suggest the data user should use caution when attributing potential non-methodological explanations to inter-annual variation in the abundances of small fauna (i.e., amphipods and small molluscs) associated with drift algae, due to the slight modification for removing them between sampling years 2009 and 2010. We think the user can proceed with examinations of species-habitat relationships using both years of data, but suggest adding a blocking term for year to account for the changes to the protocols for these small fauna. The overwhelming majority of fauna were not affected by the modifications (i.e., between-year protocols were consistent).
Costs: None
Class IV. Data structural descriptors
A. Data Set Files
Identity and Size:
BBSG_2009-2010.zip (zipped CSV and txt files), 63 KB
Included in BBSG_2009-2010.zip:
BBSG_2009-2010_data_dictionary.csv, 8 KB
BBSG_2009-2010_species_codes.csv, 37 KB
BBSG_2009-2010_species_count_and_size_data.csv, 197 KB
BBSG_2009-2010_species_presence_data.csv, 14 KB
Note: the file "BBSG_2009-2010_species_presence_data.csv" does not contain information on the species reported in file "BBSG_2009-2010_species_count_and_size_data.csv". Flora (e.g., drift algae) and fauna (e.g., sponges) reported in the "presence" data were those captured at the site but for which quantifying abundance was not possible. In order to run analyses on all flora or fauna present at the site, the investigator will need to combine the two data sets.
BBSG_2009-2010_habitat_and_trawl-tow_data.csv, 35 KB
bigbend_grass.zip (zipped GIS shapefiles), 5,418 KB
Note: includes associated .dbf, .prj, .sbn, .shp, .xml, and .shx files
Format and storage mode: All files are text files (*.csv)
Header information: Found in BBSG_2009-2010_data_dictionary.csv
B. Variable information
Storage type
Hard copy data sheets are housed with C. D. Stallings at the University of South Florida. Digital data files are in comma-delimited text files (*.csv)
List and definition of variable codes: Found in BBSG_2009-2010_data_dictionary.csv
Missing value codes
Blank cells indicate no data due to missing values. Cells with "NA" indicate data were not available (e.g., blade length for a species if seagrass that was not present)
Data anomalies
Our target tow distance at each site was 85 m, based on a 2.5 minute deployment at a constant speed. We generally hit our target very well (mean = 84.9 m, median = 84.0 m, SE = 1.1 m). However, we had to reduce our towing times (and thus towing distances) at seven sites for two different reasons: (1) four sites (BB09_002, BB09_084, BB10_010, and BB10_062) had only small, isolated patches of seagrass that we towed along the longest available dimension from edge to edge, and (2) three sites (BB09_074, BB10_046, and BB10_081) had extremely high densities of drift algae, which would cause the net to rapidly fill and therefore not give accurate estimates of associated fauna.
Class V. Supplemental descriptors
A. Data acquisition
Data forms: N/A
Location of completed data forms: The raw data sheets are stored at the University of South Florida with C. D. Stallings.
B. Quality assurance / quality control procedures: Data were entered and verified by independent personnel. Problematic entries were verified with raw data sheets.
C. Computer programs and algorithms: Example R code used for 2009 site selection with spsurvey package: BBSG_2009-2010_site_selection_code_2009.txt
D. Publications using the data set: These data were directly used in Nelson et al. (2013) and informed Stallings et al. (2014a,b).
Acknowledgments
Josh Brower, Alex Cruz Benitez, Emily Field, Brittany Hall-Scharf, Erin Simmons, Michele Sosa, and Rachel Wilson provided assistance in the field. Lab assistance was provided by Christine Gerrity, Emily Hutchinson, Sam Kelling, and Chris Matechik. Dean Grubbs helped identify difficult fishes. Gustav Paulay and John Slapcinsky from the Florida Museum of Natural History provided consultation to verify species identification which proved especially helpful with animals for which there was little or no guidance from existing taxonomic keys. Janie Wulff and Mariah Pfleger identified the sponges collected from the 2010 field season. Shawn Lewers and Rene Baumstark assisted with various GIS needs. We thank the staff at the Florida State University Coastal and Marine Laboratory, particularly Bobby Henderson for keeping the research vessel running and both designing and building the trawls and trawl-boom system. Staff members Dennis Tinsley, Maranda Marxsen, Sharon Thoman, Mark Daniels, and Bob Williams also contributed in various functions to make the work possible. This manuscript has been subjected to peer and administrative review at the US Environmental Protection Agency (USEPA), Office of Research and Development, National Center for Environmental Assessment, Cincinnati Division and approved for publication. The views expressed in this manuscript are those of the authors and do not necessarily reflect the views or policies of the USEPA. The mention of trade names or commercial products does not constitute endorsement or recommendation for use. The senior author dedicates this paper in the memory of Delilah.
Literature cited
Abbott, R. T., H. S. Zim, and G. F. Sandstrom. 1985. Seashells of the world: a guide to the better-known species. Golden Press, New York.
Abbott, R. T., and P. A. Morris. 1995. A field guide to shells: Atlantic and Gulf coasts and the West Indies. Houghton Mifflin, Boston, Massachusetts, USA.
Abele, L. G., and W. Kim. 1986. An illustrated guide to the marine decapod crustaceans of Florida. Tallahassee, Fla., State of Florida, Dept. of Environmental Regulation.
Bell, S. S., M. S. Fonseca, and N. B. Stafford. 2006. Seagrass ecology: new contributions from a landscape perspective. Pages 625–645 in A. W. D. Larkum, R. J. Orth, and C. M. Duarte, editors. Seagrasses: Biology, Ecology and Conservation Springer, the Netherlands.
Bell, S. S., M. O. Hall, and B. D. Robbins. 1995. Toward a landscape approach in seagrass beds - using macroalgal accumulation to address questions of scale. Oecologia 104:163–168.
Dawes, C. J., R. C. Phillips, and G. Morrison. 2004. Seagrass communities of the Gulf Coast of Florida: status and ecology. FWC and Wildlife Research Institute, and Tampa Bay Estuary Program., St. Petersburg, Florida, USA.
Edgar, G. J., H. Mukai, and R. J. Orth. 2001. Fish, crabs, shrimps and other large mobile epibenthos: Measurement methods for their biomass and abundance in seagrass. Pages 255–270 in F. T. Short and R. G. Coles, editors. Global seagrass research methods. Elsevier Science, Amsterdam, The Netherlands.
Florida Fish and Wildlife Research Institute (FWRI). 2002. Florida's statewide land cover. Downloadable Data, St. Petersburg, Florida, USA.
Florida Fish and Wildlife Research Institute (FWRI). 2007. Florida's statewide seagrass. Downloadable Data, St. Petersburg, Florida, USA.
Fourqurean, J. W., and M. B. Robblee. 1999. Florida Bay: A history of recent ecological changes. Estuaries 22:345–357.
Gillanders, B. M. 2006. Seagrasses, fish, and fisheries. Pages 503–536 in A. W. D. Larkum, R. J. Orth, and C. M. Duarte, editors. Seagrasses: biology, ecology and conservation. Springer, Dordrecht, The Netherlands.
Hale, J. A., T. K. Frazer, D. A. Tomasko, and M. O. Hall. 2004. Changes in the distribution of seagrass species along Florida's central Gulf Coast: Iverson and Bittaker revisited. Estuaries 27:36–43.
Hendler, G. 1995. Sea stars, sea urchins, and allies: echinoderms of Florida and the Caribbean. Washington, Smithsonian Institution Press.
Hoese, H. D., and R. H. Moore. 1977. Fishes of the Gulf of Mexico, Texas, Louisiana, and adjacent waters. College Station, Texas A&M University Press.
Hoese, H. D., and R. H. Moore. 1998. Fishes of the Gulf of Mexico, Texas, Louisiana, and adjacent waters. College Station, Texas A&M University Press.
Humann, P., and N. DeLoach. 1992. Reef creature identification: Florida, Caribbean, Bahamas, New World Publications.
Humann, P., and N. DeLoach. 1994. Reef fish identification: Florida, Caribbean, Bahamas, New World Publications.
Iverson, R. L., and H. F. Bittaker. 1986. Seagrass distribution and abundance in eastern Gulf of Mexico waters. Estuarine Coastal and Shelf Science 22:577–602.
Kensley, B. F., and M. Schotte. 1989. Guide to the marine isopod crustaceans of the Caribbean. Washington, D.C., Smithsonian Institution Press.
Kincaid, T., T. Olsen, D. Stevens, C. Platt, D. White, and R. Remington. 2008. spsurvey: Spatial Survey Design and Analysis. R package version 1.7.2. http://www.epa.gov/nheerl/arm/.
Koenig, C. C., and F. C. Coleman. 1998. Absolute abundance and survival of juvenile gags in sea grass beds of the Northeastern Gulf of Mexico. Transactions of the American Fisheries Society 127:44–55.
Kuipers, B. R., B. Maccurrin, J. M. Miller, H. W. Vanderveer, and J. I. J. Witte. 1992. Small trawls in juvenile flatfish research - their development and efficiency. Netherlands Journal of Sea Research 29:109–117.
Lewis, III, R. R., and E. D. Estevez. 1988. The ecology of Tampa Bay, Florida: An estuarine profile. Biological Report No. 85 (7.18). U.S. Fish and Wildlife Service. National Wetlands Research Center, Slidell, Louisiana, USA.
Lindall, W. N., and C. H. Saloman. 1997. Alteration and destruction of estuaries affecting fisheries resources in the Gulf of Mexico. Marine Fisheries Review 399:1–7.
Lindner, G. 1978. Field guide to seashells of the world. New York, Van Nostrand Reinhold.
Littler, D. S. 1989. Marine plants of the Caribbean: a field guide from Florida to Brazil. Washington, D.C., Smithsonian Institution Press.
Livingston, R. J. 1990. The relationship of physical factors and biological response in coastal seagrass meadows. Estuaries 7:377–390.
Livingston, R. J., S. E. McGlynn, and X. F. Niu. 1998. Factors controlling seagrass growth in a gulf coastal system: Water and sediment quality and light. Aquatic Botany 60:135–159.
Mattson, R. A. 2000. Seagrass ecosystem characteristics, research, and management needs in the Florida Big Bend. Pages 259–277 in S. A. Bortone, editor. Seagrasses: monitoring, ecology, physiology, and management. CRC Press, Boca Raton, Florida, USA.
Mattson, R. A., T. K. Frazer, J. A. Hale, S. Blitch, and L. Ahijevych. 2006. Florida Big Bend. USGS.
McEachran, J. D., and J. D. Fechhelm. 1998. Fishes of the Gulf of Mexico. Austin, University of Texas Press.
Mikkelsen, P. M., and R. D. Bieler. 2008. Seashells of southern Florida: living marine mollusks of the Florida Keys and adjacent regions, bivalves. Princeton, Princeton University Press.
Morris, P. A. 1973. A field guide to shells of the Atlantic and gulf coasts and the West Indies. Boston, Houghton Mifflin.
Murali, R.S. 1982. Zero-energy coast. Pages 883 in M. K. Swartz, editor. The Encyclopedia of Beaches and Coastal Environments. Hutchinson and Ross Publishers, Stroudsburg, Pennsylvania, USA.
Neckles, H. A., B. S. Kopp, B. J. Peterson, and P. S. Pooler. 2012. Integrating Scales of Seagrass Monitoring to Meet Conservation Needs. Estuaries and Coasts 35:23–46.
Nelson, J. A., C. D. Stallings, W. M. Landing, and J. Chanton. 2013. Biomass transfer subsidizes nitrogen to offshore food webs. Ecosystems 16:1130–1138.
Olsen, A. R., T. M. Kincaid, and Q. Payton. 2012. Spatially balanced survey designs for natural resources. Pages 126–150 in R. A. Gitzen, J. J. Millspaugh, A. B. Cooper, and D. S. Licht, editors. Design and Analysis of Long-Term Ecological Monitoring Studies. Cambridge University Press, Cambridge, UK.
Orth, R. J., T. J. B. Carruthers, W. C. Dennison, C. M. Duarte, J. W. Fourqurean, K. L. Heck, A. R. Hughes, G. A. Kendrick, W. J. Kenworthy, S. Olyarnik, F. T. Short, M. Waycott, and S. L. Williams. 2006. A global crisis for seagrass ecosystems. Bioscience 56:987–996.
Pomory, C. M. 2007. Key to the common shallow-water brittle stars (Echinodermata: Ophiuroidea) of the Gulf of Mexico and Caribbean Sea. Caribbean Journal of Science:1–42.
R Development Core Team. 2008. R: A language and environment for statistical computing. R Foundation for Statistical Computing, Vienna, Austria. ISBN 3-900051-07-0, URL http://www.R-project.org.
Robblee, M. B., T. R. Barber, P. R. Carlson, M. J. Durako, J. W. Fourqurean, L. K. Muehlstein, D. Porter, L. A. Yarbro, R. T. Zieman, and J. C. Zieman. 1991. Mass mortality of the tropical seagrass Thalassia testudinum in Florida Bay (USA) Marine Ecology Progress Series 71:297–299.
Robbins, B. D., and S. S. Bell. 1994. Seagrass landscapes - a terrestrial approach to the marine subtidal environment. Trends in Ecology & Evolution 9:301–304.
Robins, C. R., G. C. Ray, and J. Douglass. 1986. A field guide to Atlantic Coast fishes of North America. Houghton Mifflin, Boston, Massachusetts, USA.
Schultz, G. A. 1969. The marine isopod crustaceans. W. C. Brown Co., Dubuque, Iowa, USA.
Stallings, C. D., F. C. Coleman, C. C. Koenig, and D. A. Markiewicz. 2010. Energy allocation in juveniles of a warm-temperate reef fish. Environmental Biology of Fishes 88:389–398.
Stallings, C. D., J. P. Brower, J. M. Heinlein Loch, and A. Mickle. 2014a. Catch comparison between otter and rollerframe trawls: implications for sampling in seagrass beds. Fisheries Research 155:177–184.
Stallings, C. D., J. P. Brower, J. M. Heinlein Loch, and A. Mickle. 2014b. Commercial trawling in seagrass beds: bycatch and long-term trends in effort of a major shrimp fishery Marine Ecology Progress Series 513:143–153.
Stevens, D. L., and A. R. Olsen. 2004. Spatially balanced sampling of natural resources. Journal of the American Statistical Association 99:262–278.
Voss, G. L. 2002. Seashore life of Florida and the Caribbean. Dover, Mineola, New York, USA.
Waycott, M., C. M. Duarte, T. J. B. Carruthers, R. J. Orth, W. C. Dennison, S. Olyarnik, A. Calladine, J. W. Fourqurean, K. L. Heck, A. R. Hughes, G. A. Kendrick, W. J. Kenworthy, F. T. Short, and S. L. Williams. 2009. Accelerating loss of seagrasses across the globe threatens coastal ecosystems. Proceedings of the National Academy of Sciences of the United States of America 106:12377-12381.
Zieman, J. C., and R. T. Zieman. 1989. The ecology of seagrass meadows of the west coast of Florida: a community profile. Pages 167 in FWS, editor.
Zieman, J. C., J. W. Fourqurean, and T. A. Frankovich. 1999. Seagrass die-off in Florida Bay: Long-term trends in abundance and growth of turtle grass, Thalassia testudinum. Estuaries 22:460–470.
Zimmerman, M. S., and R. J. Livingston. 1976. Effects of kraft mill effluents on benthic macrophyte assemblages in a shallow bay system (Apalachee Bay, north Florida, USA). Marine Biology 34:297–312.
Zimmerman, R. J., T. K. Minello, G. Zamora, and E. Martinez. 1986. Measurements of estuarine shrimp densities applied to catch predictions. Pages 37–55 in A. M. Landry and E. F. Klima, editors. Proceedings of the Shrimp Yield Prediction Workshop. Texas A & M University Sea Grant College Program Galveston, Texas, USA.