Ecological Archives E096-029-A4
Sonia Kéfi, Eric L. Berlow, Evie A. Wieters, Lucas N. Joppa, Spencer A. Wood, Ulrich Brose, and Sergio A. Navarrete. 2015. Network structure beyond food webs: mapping non-trophic and trophic interactions on Chilean rocky shores. Ecology 96:291303. http://dx.doi.org/10.1890/13-1424.1
Appendix D. Details about modularity and nestedness.
Using Guimera and Amaral's algorithm (2005), we investigated whether the trophic and the non-trophic webs were compartmentalized into groups of species, or "modules", that interact preferentially among each other than across the entire web. There are a large number of ways in which a network can be partitioned into modules, especially when the number and size of modules are unknown. The approach of Guimera and Amaral (2005) investigates whether there is a particular division of the network in a number of modules of varying sizes which maximizes a function called "modularity" (Newman and Girvan 2004). Modularity measures the fraction of links falling within modules minus the expected value in an equivalent network where links are placed at random (Newman and Girvan 2004). Guimera and Amaral (2005) proposed to use "simulated annealing" to find the maximal modularity of all possible divisions of the network in modules (see Guimera and Amaral 2005 for methods). The procedure gives the number of modules, their size and species composition. Calculated in this way, modularity is a value between 0 and 1, with 1 corresponding to a perfectly modular matrix. Calculations were run using an interaction factor of 1.0 and a cooling factor of 0.95 (see Guimera and Amaral 2005 for details).
Table D1. Modularity and compartments identified in the different webs. From left to right, the columns correspond to: modularity, number of compartments identified, number of species in each compartment, total number of within-compartment links, number of links from each of the compartment to others, average modularity of 100 randomized networks with the same connectivity (and standard deviation of the modularity of the randomized networks).
|
Modularity |
# comp. |
# species in comp. |
Within comp. links |
Links from comp. to outside |
Modularity of a random network (same connectivity) |
Troph. |
0.179 |
3 |
26 42 36 |
161 396 222 |
388 523 441 |
0.118 (0.003) |
NT all |
0.091 |
3 |
33 44 22 |
72 944 101 |
284 605 441 |
0.091 (0.050) |
NT neg. |
0.046 |
4 |
2 45 10 20 |
1 989 9 120 |
0 561 56 527 |
0.025 (0.002) |
NTI pos. |
0.363 |
4 |
10 17 31 8 |
13 20 52 13 |
25 12 33 32 |
0.306 (0.009) |
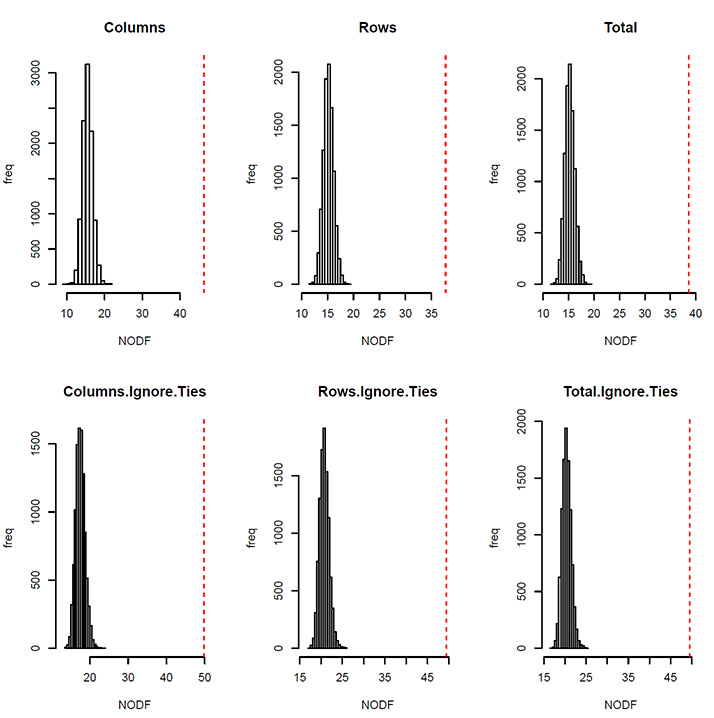
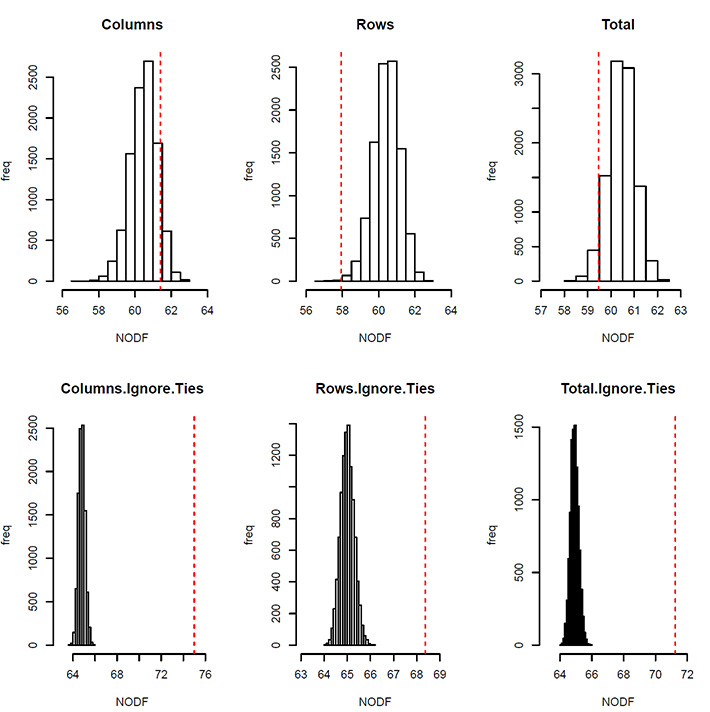
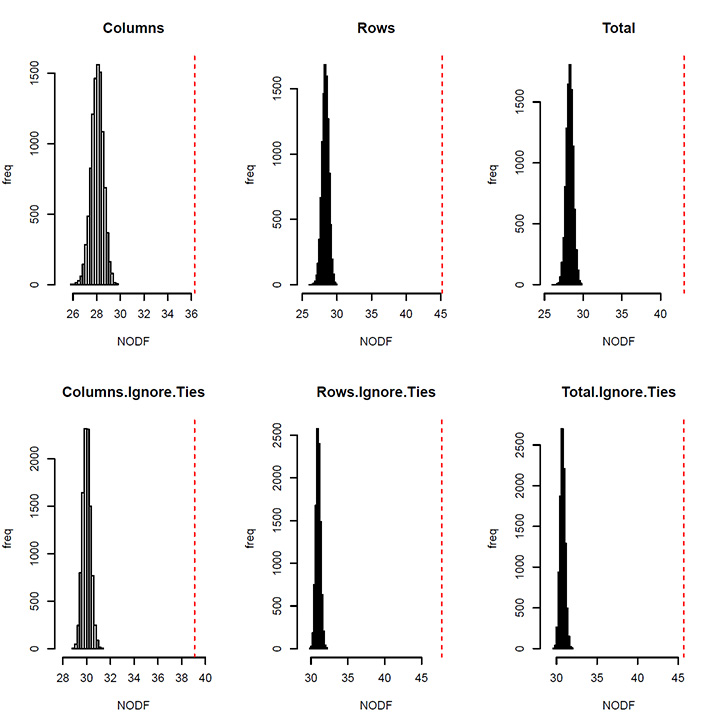
We used a common nestedness metric termed NODF (Almeida-Neto et al. 2008). Earlier attempts to quantify nestedness dealt primarily with data describing species occurrences in metacommunities, where the question was whether species present at species-poor sites were a subset of those species present at species-rich sites. The same approach can be followed with the networks of trophic and non-trophic interactions. First, we used the trophic network to ask two questions: (1) were the prey of specialist consumers subsets of the prey consumed by more generalist consumers and (2) were the consumers of prey with few consumers subsets of the consumers of prey with many consumers? Second, using the non-trophic networks, we assessed whether (1) species impacted by few species are a subset of species impacted by many species and (2) species impacting few species are a subset of those impacting many species.
Table D2. NODF for the different webs.
|
NODF Col |
NODF Rows |
NODF Tot |
T |
36** |
45** |
43** |
NT neg |
61 |
58* |
59 |
NT pos |
46** |
38** |
39** |
*,**statistically lower than expected by chance for the fixed-fixed model (** p < 0.001, * p < 0.005)
A. Trophic web
B. Negative non-trophic interaction web
C. Positive non-trophic interaction web
Fig. D1. Frequency of NODF values observed in 10000 randomized networks keeping the connectance and the number of species fixed (identical to the ones of the data set). The dashed red lines indicate the NODF value observed in the data set. A: trophic web, B: negative non-trophic interaction web, C: positive interaction web.
Literature cited
Almeida-Neto, M., P. Guimaraes, P. R. J. Guimaraes, R. D. Loyola, and W. Ulrich. 2008. A consistent metric for nestedness analysis in ecological systems: reconciling concept and measurement. Oikos 117:227–239.
Guimera, R., and L. A. N. Amaral. 2005. Functional cartography of complex metabolic networks. Nature 433:895–900.
Newman, M. E. J., and M. Girvan. 2004. Finding and evaluating community structure in networks. Physical Review E 69:026113.