Ecological Archives E096-029-A3
Sonia Kéfi, Eric L. Berlow, Evie A. Wieters, Lucas N. Joppa, Spencer A. Wood, Ulrich Brose, and Sergio A. Navarrete. 2015. Network structure beyond food webs: mapping non-trophic and trophic interactions on Chilean rocky shores. Ecology 96:291303. http://dx.doi.org/10.1890/13-1424.1
Appendix C. Does the number of non-trophic interactions per trophic level deviate from a null model?
To determine if the distribution of non-trophic interactions throughout the trophic network was different than expected by chance, we compared the observed distributions to those obtained in randomized networks using two different null models. First, we only randomized the non-trophic interactions while keeping the trophic network structure fixed (i.e., as the one observed in the empirical network). Second, we randomized the location of both the trophic and the non-trophic interactions.
Randomization 1: fixed trophic web
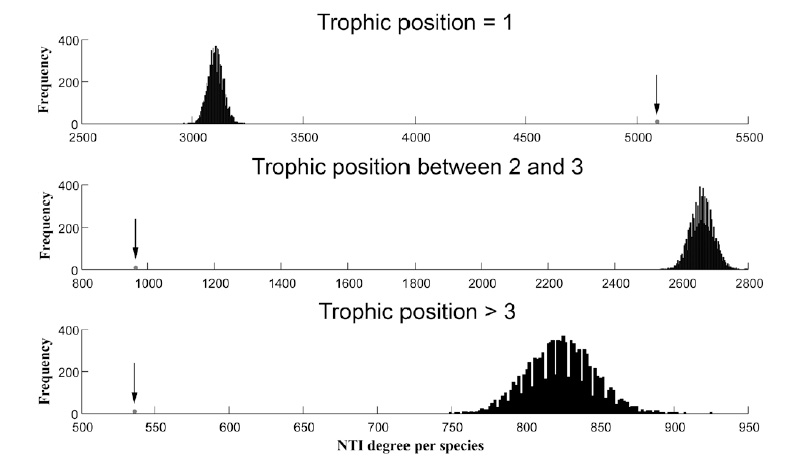
For each species of the real web, we recorded its trophic level and the number of non-trophic interactions in which it was involved (non-trophic degree, i.e., the sum of incoming and outgoing links). We distinguished three trophic levels: the basal level (trophic position = 1), the species whose trophic position is between 2 and 3 and the species whose trophic position is higher or equal to 3 (secondary and top consumers). We then counted the total number of non-trophic interactions in each of these three categories. We compared these three values to those expected given the null hypothesis that these non-trophic links occurred at random with respect to trophic levels.
We generated 10000 randomizations of the web with the only constraint that the total number of non-trophic interactions (i.e., the number of links in the interaction matrix) and that the trophic structure (trophic links) were the same as in the data set, i.e., fixed trophic structure. Note that maximum non-trophic degree per species achieved in the randomizations was always inferior to the maximum degree observed in the data.
Fig. C1. Histogram of the distribution of total number of non-trophic interactions (NTI) observed in each trophic level in 10000 randomizations. The arrow indicates the total number of non-trophic interactions observed in the data set.
The total number of non-trophic interactions at the basal trophic level, 5093 in our data set, was significantly larger than the average number in the 10000 randomized networks was 3106 ±34.1 (95% confidence interval based on 10000 randomizations; Fig. C1). At the second and third trophic levels, the total numbers of non-trophic interactions observed in the empirical network, 963 and 536 respectively were significantly lower than those expected by chance occurrence. The average numbers in the randomized webs are 2662±33.6 and 823.9±22.5 (Fig. C1).
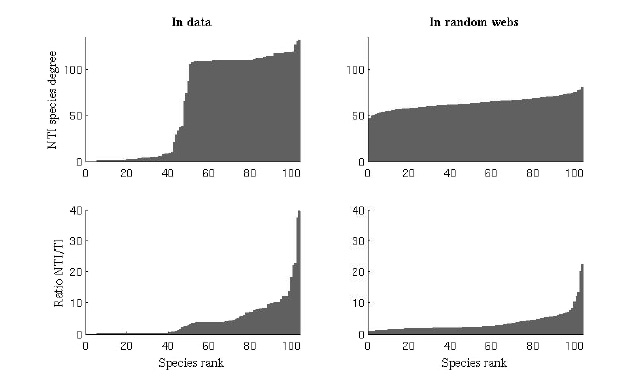
We also looked at the distributions of interactions per species in the data set compared to the 10000 randomized webs. The distribution of non-trophic interactions per species clearly differs in the data set compared to the randomizations. While the mean non-trophic degree per species is equal in both the data and the 10000 randomizations (63.4), the maximum non-trophic degree is 132 in the data vs. 96 in the randomizations and the minimum non-trophic degree is 0 in the data vs. 31 in the randomizations. The distribution of non-trophic interactions was also much more gaussian in the randomizations than the data. The ratio of non-trophic to trophic interactions (bottom panels) was similar between the randomizations (slightly more continuous) and the data (more stepped function); in both cases, the few most highly connected species are in that position by virtue of a disproportionate increase in non-trophic over trophic interactions.
Fig. C2. Rank distributions of non-trophic degree and non-trophic/trophic ratio per species ordered by increasing ranking. Left panels show the distributions observed in the empirical data set. Right panels show the distribution of average values observed in the 10000 randomizations (averaged after ordering the species by degree).
Randomization 2: randomization of both trophic and non-trophic interactions
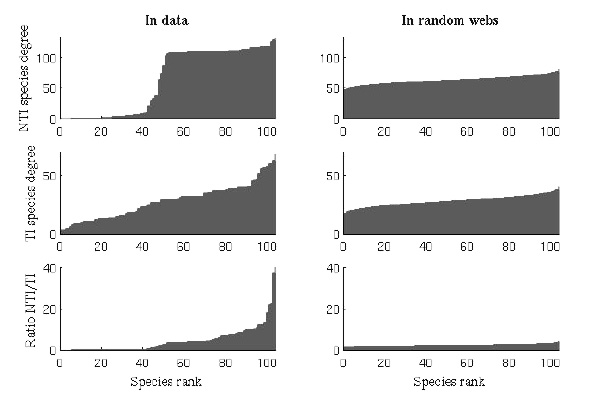
In this case, we generate 10000 randomizations of both trophic and non-trophic interactions within the web, keeping the total number of non-trophic interactions as well as trophic interactions fixed at the numbers observed in the empirical web. We also constrained the distribution of links per species to the maximum observed in the empirical web + one standard deviation.
We compared the number of non-trophic, trophic and the ratio non-trophic/trophic interactions between the data set and the random webs.
Comparing the non-trophic degree per species between the data and the randomized webs shows similar results as with the previous randomization. However, the distribution of non-trophic/trophic ratio is very different than for the previous randomization illustrating that the pattern observed in the data set is due to the structure of the trophic links (which were not randomized in the previous randomization).
Fig. C3. Distribution of total number of interactions per species. First row: non-trophic degree, second row: trophic degree, third row: ratio of non-trophic/trophic per species. Left: data set, right: average value observed in the randomizations (mean calculated after ordering the distributions by degree).