Ecological Archives E096-029-A2
Sonia Kéfi, Eric L. Berlow, Evie A. Wieters, Lucas N. Joppa, Spencer A. Wood, Ulrich Brose, and Sergio A. Navarrete. 2015. Network structure beyond food webs: mapping non-trophic and trophic interactions on Chilean rocky shores. Ecology 96:291303. http://dx.doi.org/10.1890/13-1424.1
Appendix B. Details about the degree distributions.
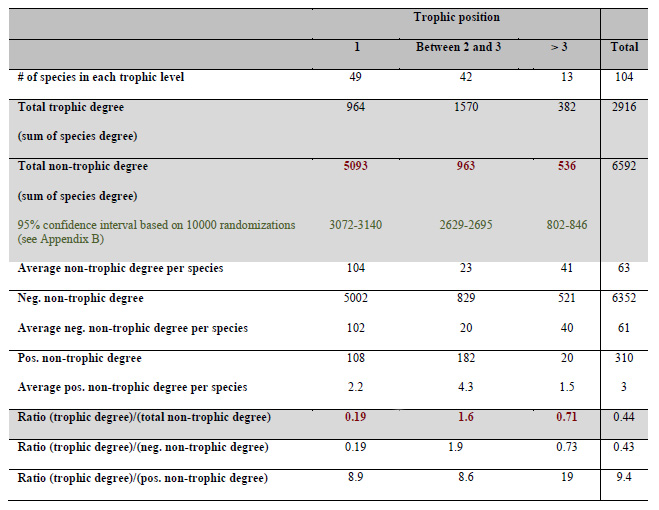
Table B1. Partitioning of the degree of species involved in trophic and non-trophic interactions across trophic levels(the degree was calculated as the sum of incoming and outgoing links for each species).
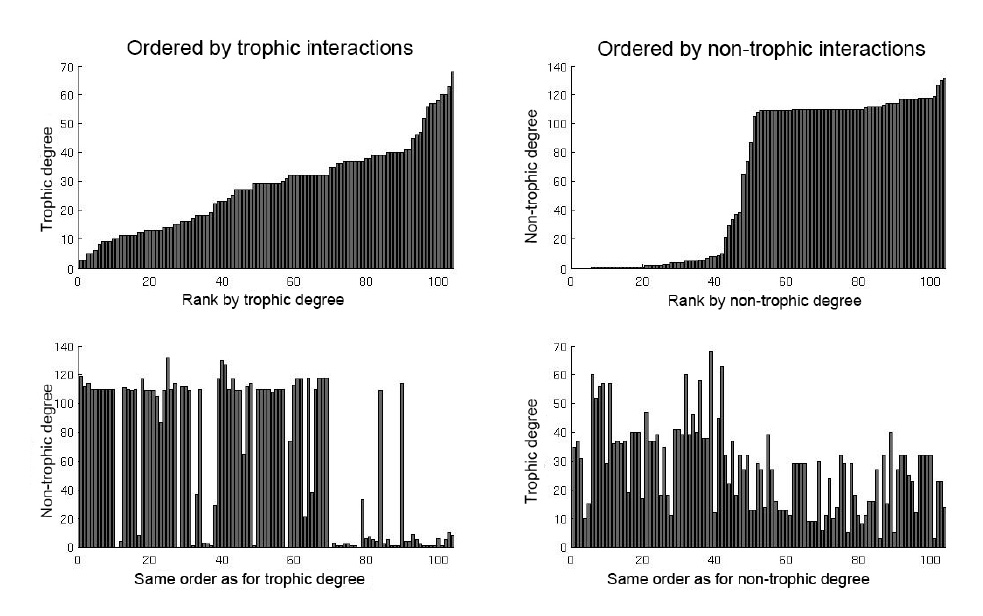
Fig. B1. Comparison of the trophic and non-trophic degree. Top panels show the distribution of the trophic (left) and non-trophic (right) degrees sorted by ascending ranking of species. Bottom panels show the non-trophic degrees on the left and trophic degrees on the right using the species ranking in the top panel. The opposite correspondence in the species rank based on trophic and non-trophic degree is apparent when comparing top and bottom panels.
Species at the base of the web and sessile species have many negative non-trophic interactions, whereas mobile species at higher trophic levels tend to have a low number of non-trophic interactions. The opposite was true for trophic interactions. Positive non-trophic interactions showed no clear trend.