Ecological Archives E096-025-A1
Luke E. Painter, Robert L. Beschta, Eric J. Larsen, and William J. Ripple. 2015. Recovering aspen follow changing elk dynamics in Yellowstone: evidence of a trophic cascade? Ecology 96:252263. http://dx.doi.org/10.1890/14-0712.1
Appendix A. Multiple regression results, height and browsing rate by range sector, and snow-water-equivalent 19852012.
Table A1. Results of multiple regression analysis: variables tested, selected models, and reduced models for five response variables. The sign for each term indicates the sign of the regression coefficient. Columns list difference in AICc score compared to selected model (dAICc); adjusted R²; and degrees of freedom (df) for the regression model.
Regression Model |
dAICc |
adj R² |
df |
BROWSING RATE IN SAMPLING PLOTS |
|
|
|
(Browsing)~ +Central +West +LeaderLength +Logs** –Riparian +ConiferDistance** |
6 |
0.21 |
6, 80 |
(Browsing)*~ +Central +West +(Leader Length) |
0 |
0.23 |
3, 83 |
(Browsing)~ +Central +West |
4 |
0.19 |
2, 84 |
|
|
|
|
HEIGHT OF YOUNG ASPEN IN SAMPLING PLOTS |
|
|
|
ln(Height)*~ –Browsing +LeaderLength |
0 |
0.64 |
2, 84 |
ln(Height)~ –Browsing |
3 |
0.62 |
1, 85 |
ln(Height)~ +LeaderLength |
86 |
0.02 |
1, 85 |
|
|
|
|
HEIGHT OF FIVE TALLEST YOUNG ASPEN IN STAND |
|
|
|
Height~ –Central –West +Logs +Riparian –ConDistance** –LeaderLength** |
0 |
0.35 |
6, 80 |
Height*~ –Central –West +Logs +Riparian |
1 |
0.32 |
4, 82 |
Height~ –Central –West +Riparian |
5 |
0.28 |
3, 83 |
Height~ –Central –West +Logs |
7 |
0.27 |
3, 83 |
Height~ –Central –West |
11 |
0.22 |
2, 84 |
Height~ –LeaderLength** |
31 |
0.004 |
1, 85 |
|
|
|
|
ELK SCAT DENSITY |
|
|
|
ln(ElkScat)~ +Central +West –View** –Slope +SouthAspect –BisonScat |
2 |
0.37 |
6, 80 |
ln(ElkScat)*~ +Central +West –View** |
0 |
0.36 |
3, 83 |
ln(ElkScat)~ +Central +West |
8 |
0.29 |
2, 84 |
ln(ElkScat)~ –BisonScat |
23 |
0.15 |
1, 85 |
|
|
|
|
BISON SCAT DENSITY |
|
|
|
ln(BisonScat)~ –Central –West –Slope +View –SouthAspect** |
3 |
0.53 |
5, 81 |
ln(BisonScat)*~ –Central –West –Slope |
0 |
0.54 |
3, 83 |
ln(BisonScat)~ –Central –West |
4 |
0.51 |
2, 84 |
*selected model |
|
|
|
**Sign of coefficient opposite of expected |
|
|
|
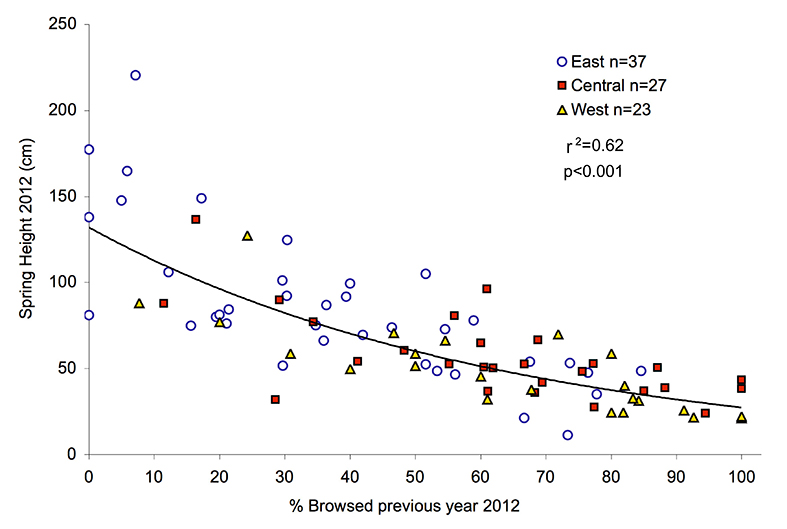
Fig. A1. Mean spring height of young aspen as a function of browsing rate in 87 aspen stand sampling plots, coded by range sector. Line is fitted to the logarithm of height.
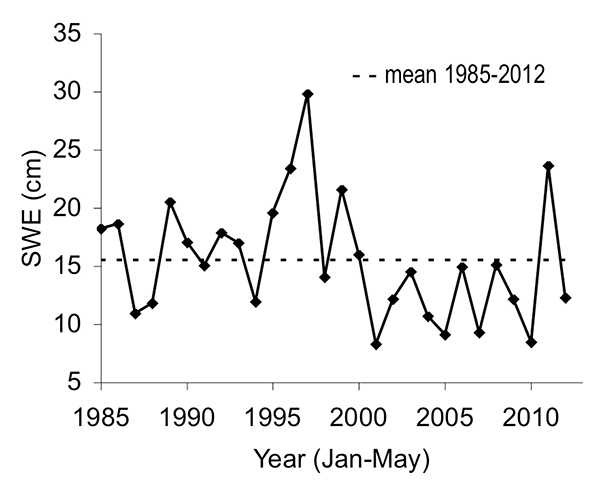
Fig. A2. Mean monthly SWE from Lupine Creek and Northeast Entrance snow courses. Data from National Resource Conservation Service.