Ecological Archives E096-018-A1
Jiajia Liu, Xinxin Zhang, Feifan Song, Shurong Zhou, Marc W. Cadotte, and Corey J. A. Bradshaw. 2015. Explaining maximum variation in productivity requires phylogenetic diversity and single functional traits. Ecology 96:176183. http://dx.doi.org/10.1890/14-1034.1
Appendix A. Species list (Table A1), measures of diversity (Table A2) and their correlations (Table A3, Fig. A3),full GLM results (Tables A4and A5), phylogenetic trees (Fig. A1), the removal treatment test (Fig. A2), and correlation between two PDs (Fig. A4).
Table A1. Species list categorized by taxonomic group (TG) and family.
TG |
Family |
Genus species |
Asteraceae |
Asteraceae |
Ligularia virgaurea |
Asteraceae |
Asteraceae |
Saussurea pulchra |
Asteraceae |
Asteraceae |
Artemisia mongolica |
Asteraceae |
Asteraceae |
Taraxacum mongolicum |
Asteraceae |
Asteraceae |
Anaphalis lactea |
Asteraceae |
Asteraceae |
Saussurea nigrescens |
Asteraceae |
Asteraceae |
Saussurea leontodontoides |
Asteraceae |
Asteraceae |
Ajania tenuifolia |
Asteraceae |
Asteraceae |
Leontopodium haplophylloides |
Asteraceae |
Asteraceae |
Saussurea stella |
Asteraceae |
Asteraceae |
Aster diplostephioides |
Fabaceae |
Fabaceae |
Astragalus polycladus |
Fabaceae |
Fabaceae |
Oxytropis kansuensis |
Fabaceae |
Fabaceae |
Tibetia himalaica |
Fabaceae |
Fabaceae |
Thermopsis lanceolala |
Fabaceae |
Fabaceae |
Medicago lupulina |
others |
Apiaceae |
Chamaesium paradoxum |
others |
Caryophyllaceae |
Cerastium fontanum |
others |
Scrophulariaceae |
Euphrasia regelii |
others |
Rosaceae |
Potentilla anserina |
others |
Rosaceae |
Potentilla bifurca |
others |
Geraniaceae |
Geranium pylzowianum |
others |
Lamiaceae |
Scutellaria rehderiana |
others |
Alliaceae |
Allium sikkimense |
others |
Ranunculaceae |
Thalictrum alpinum |
others |
Ranunculaceae |
Ranunculus tanguticus |
others |
Rosaceae |
Potentilla potaninii |
others |
Orchidaceae |
Herminium monorchis |
others |
Scrophulariaceae |
Lancea tibetica |
others |
Gentianaceae |
Lomatogonium carinthiacum |
others |
Scrophulariaceae |
Veronica eriogyne |
others |
Plantaginaceae |
Plantago depressa |
others |
Saxifragaceae |
Parnassia trinervis |
others |
Caryophyllaceae |
Stellaria uda |
others |
Gentianaceae |
Gentianopsis paludosa |
others |
Ranunculaceae |
Anemone obtusiloba |
others |
Scrophulariaceae |
Pedicularis szetschuanica |
others |
Polygonaceae |
Rumex acetosa |
others |
Ranunculaceae |
Anemone trullifolia |
others |
Gentianaceae |
Halenia elliptica |
others |
Gentianaceae |
Gentiana farreri |
others |
Ranunculaceae |
Anemone rivularis |
others |
Polygonaceae |
Polygonum macrophyllum |
others |
Euphorbiaceae |
Euphorbia helioscopia |
others |
Ranunculaceae |
Delphinium kamaonense |
Poaceae and Cyperaceae |
Cyperaceae |
Scirpus distigmaticus |
Poaceae and Cyperaceae |
Cyperaceae |
Kobresia capillifolia |
Poaceae and Cyperaceae |
Cyperaceae |
Kobresia myosuroides |
Poaceae and Cyperaceae |
Poaceae |
Poa pratensis |
Poaceae and Cyperaceae |
Poaceae |
Elymus nutans |
Poaceae and Cyperaceae |
Poaceae |
Agrostis hugoniana |
Poaceae and Cyperaceae |
Poaceae |
Koeleria litvinowii |
Poaceae and Cyperaceae |
Poaceae |
Stipa aliena |
Poaceae and Cyperaceae |
Poaceae |
Festuca sinensis |
Table A2. Measures of diversity considered in the analysis. Variables selected for model construction in boldface.
Diversity measure |
Description |
References |
S |
Realized species richness of plot |
Tilman, Wedin and Knops 1996 |
H' |
Shannon's diversity index |
Tilman, Wedin and Knops 1996 |
D |
Simpson's diversity |
Tilman, Wedin and Knops 1996 |
PD |
Phylogenetic diversity (the sum of all hylogentic branch lengths connecting species together) |
Cardinale et al. 2006 |
MNND |
Mean nearest-neighbor distance (the mean of the shortest distances connecting each species to any other species in the assemblage) |
Webb et al. 2002 |
MPD |
Mean pairwise distance (the mean of all the distances connecting species in an assemblage) |
Webb et al. 2002 |
MNNDab |
Abundance-weighted MNND |
Webb et al. 2002 |
MPDab |
Abundance-weighted MPD |
Webb et al. 2002 |
Hed |
Entropic measure of the distribution of evolutionary distinctiveness in an assemblage |
Gamfeldt, Hillebrand and Jonsson 2008 |
Haed |
Abundance-weighted Hed |
Gamfeldt, Hillebrand and Jonsson 2008 |
Heed |
Equitability of Haed |
Gamfeldt, Hillebrand and Jonsson 2008 |
PAE |
Phylogenetic abundance evenness: measures the skew in abundances along terminal branches |
Gamfeldt, Hillebrand and Jonsson 2008 |
IAC |
Imbalance of abundances among clades: measures the deviation in abundance distribution among internal splits from a null |
|
FD |
Functional diversity: the sum of all branch lengths connecting species together in a hierarchical clustering dendrogram based on a multivariate distance matrix |
Petchey and Gaston 2002 |
FAD |
Functional attribute diversity: the sum of all pairwise species distances calculated as the Euclidean distance between species |
Walker, Kinzig and Langridge 1999 |
|
|
|
FEve |
Functional Evenness: abundance-weighted pairwise functional distances |
Villéger, Mason and Mouillot 2008 |
FDis |
Functional dispersion: weighted distances from a weighted centroid in multi trait space |
Villéger, Mason and Mouillot 2008 |
FDiv
|
Functional divergence: mean abundance-weighted deviance from an absolute abundance-weighted deviance |
Villéger, Mason and Mouillot 2008 |
FRic |
Functional richness: convex hull volume of the trait space |
Cornwell et al. 2006, Villéger et al. 2008 |
RaoQ |
Quadratic entropy |
Botta-Dukát 2005 |
Table A3. Spearman's r correlation matrix for raw input variables. Shown are species richness (S), Shannon's evenness (H'), phylogenetic diversity (PD), mean pairwise distance (MPD), distribution of evolutionary distinctiveness (Hed), functional diversity (FD), functional attribute diversity (FAD), maximum plant height (Hmax), leaf phosphorus (P) and nitrogen (N) content, mean seed mass (SM) and specific leaf area (SLA). ρ > 0.3 in boldface.
S |
H |
PD |
Hed |
MPD |
FD |
FAD |
Hmax |
SM |
N |
P |
|
H |
0.938 |
||||||||||
PD |
0.975 |
0.924 |
|||||||||
Hed |
0.997 |
0.937 |
0.971 |
||||||||
MPD |
0.858 |
0.864 |
0.908 |
0.857 |
|||||||
FD |
0.848 |
0.767 |
0.775 |
0.843 |
0.634 |
||||||
FAD |
0.973 |
0.903 |
0.925 |
0.969 |
0.807 |
0.933 |
|||||
Hmax |
0.143 |
0.152 |
0.099 |
0.133 |
0.140 |
0.473 |
0.278 |
||||
SM |
0.091 |
0.196 |
0.144 |
0.094 |
0.291 |
0.204 |
0.148 |
0.607 |
|||
N |
0.087 |
0.116 |
0.129 |
0.101 |
0.159 |
-0.043 |
0.039 |
-0.411 |
-0.005 |
||
P |
0.207 |
0.190 |
0.154 |
0.197 |
0.066 |
0.451 |
0.284 |
0.449 |
0.000 |
-0.387 |
|
SLA |
-0.224 |
-0.169 |
-0.268 |
-0.227 |
-0.208 |
-0.030 |
-0.158 |
0.319 |
0.182 |
-0.258 |
0.412 |
Table A4. Generalized linear model (GLM) results for biomass production as a function of number of species (S), Shannon's evenness (H'), phylogenetic diversity (PD = phylogenetic diversity, MPD = mean pairwise distance and Hed = evolutionary distinctiveness), and various community-level means of single functional traits (Hmax = maximum plant height, P = leaf phosphorus content, N = leaf nitrogen content, SM = mean seed mass and SLA = specific leaf area) or multivariate functional trait indices (FD = functional diversity, FAD = functional attribute diversity). Shown are the estimated number of model parameters (k), maximum log-likelihood (LL), the information-theoretic Akaike's information criterion corrected for small samples (AICc), change in AICc relative to the top-ranked model (ΔAICc), AICc weight (wAICc = model probability) and the percent deviance explained (%DE) as a measure of the model's goodness-of-fit.
Model |
LL |
k |
AICc |
DAICc |
wAICc |
%DE |
~Hed+Hmax |
-271.463 |
3 |
551.497 |
0.000 |
0.574 |
77.7 |
~PD+Hmax |
-271.856 |
3 |
552.283 |
0.786 |
0.388 |
77.5 |
~S+Hmax |
-274.217 |
3 |
557.006 |
5.509 |
0.037 |
76.0 |
~MPD+Hmax |
-277.387 |
3 |
563.345 |
11.848 |
0.002 |
74.0 |
~H'+Hmax |
-280.501 |
3 |
569.574 |
18.077 |
<0.001 |
71.7 |
~Hed+N+SM |
-285.986 |
4 |
582.841 |
31.344 |
<0.001 |
67.4 |
~S+N+SM |
-286.326 |
4 |
583.521 |
32.024 |
<0.001 |
67.1 |
~Hed+N+SM+SLA |
-285.980 |
5 |
585.195 |
33.698 |
<0.001 |
67.4 |
~S+N+SM+SLA |
-286.273 |
5 |
585.782 |
34.285 |
<0.001 |
67.1 |
~H'+N+SM |
-289.698 |
4 |
590.266 |
38.770 |
<0.001 |
64.0 |
~H'+N+SM+SLA |
-289.467 |
5 |
592.169 |
40.672 |
<0.001 |
64.2 |
~MPD+N+SM |
-291.528 |
4 |
593.927 |
42.430 |
<0.001 |
62.3 |
~PD+N+SM |
-291.803 |
4 |
594.476 |
42.979 |
<0.001 |
62.0 |
~MPD+N+SM+SLA |
-291.528 |
5 |
596.292 |
44.795 |
<0.001 |
62.3 |
~PD+N+SM+SLA |
-291.791 |
5 |
596.818 |
45.321 |
<0.001 |
62.0 |
~Hed+P+SM |
-293.852 |
4 |
598.574 |
47.078 |
<0.001 |
59.9 |
~Hed+N |
-295.878 |
3 |
600.327 |
48.830 |
<0.001 |
57.7 |
~Hed+SM |
-296.253 |
3 |
601.078 |
49.581 |
<0.001 |
57.3 |
~H'+N |
-296.959 |
3 |
602.489 |
50.993 |
<0.001 |
56.5 |
~Hed+N+SLA |
-295.832 |
4 |
602.534 |
51.037 |
<0.001 |
57.8 |
~Hed+SM+SLA |
-295.835 |
4 |
602.540 |
51.044 |
<0.001 |
57.8 |
~S+P+SM |
-296.104 |
4 |
603.077 |
51.581 |
<0.001 |
57.5 |
~H'+N+SLA |
-296.940 |
4 |
604.750 |
53.253 |
<0.001 |
56.6 |
~H'+P+SM |
-297.194 |
4 |
605.259 |
53.762 |
<0.001 |
56.3 |
~S+SM |
-298.644 |
3 |
605.860 |
54.363 |
<0.001 |
54.6 |
~H'+SM |
-298.702 |
3 |
605.975 |
54.478 |
<0.001 |
54.5 |
~MPD+N |
-298.832 |
3 |
606.235 |
54.738 |
<0.001 |
54.4 |
~S+SM+SLA |
-298.354 |
4 |
607.578 |
56.081 |
<0.001 |
54.9 |
~H'+SM+SLA |
-298.664 |
4 |
608.198 |
56.701 |
<0.001 |
54.6 |
~MPD+N+SLA |
-298.736 |
4 |
608.342 |
56.845 |
<0.001 |
54.5 |
~MPD+P+SM |
-298.901 |
4 |
608.671 |
57.175 |
<0.001 |
54.3 |
~Hed+P |
-300.239 |
3 |
609.049 |
57.552 |
<0.001 |
52.7 |
~FD |
-302.065 |
2 |
610.467 |
58.971 |
<0.001 |
50.4 |
~S+N |
-301.423 |
3 |
611.417 |
59.921 |
<0.001 |
51.2 |
~H'+P |
-301.483 |
3 |
611.538 |
60.041 |
<0.001 |
51.1 |
~PD+P+SM |
-300.715 |
4 |
612.299 |
60.802 |
<0.001 |
52.1 |
~Hed |
-303.261 |
2 |
612.861 |
61.364 |
<0.001 |
48.8 |
~H' |
-303.488 |
2 |
613.314 |
61.817 |
<0.001 |
48.5 |
~MPD+P |
-302.496 |
3 |
613.563 |
62.066 |
<0.001 |
49.8 |
~S+N+SLA |
-301.415 |
4 |
613.700 |
62.203 |
<0.001 |
51.2 |
~Hed+SLA |
-302.577 |
3 |
613.725 |
62.228 |
<0.001 |
49.7 |
~H'+SLA |
-303.323 |
3 |
615.218 |
63.721 |
<0.001 |
48.7 |
~PD+N |
-304.420 |
3 |
617.411 |
65.915 |
<0.001 |
47.2 |
~PD+SM |
-304.707 |
3 |
617.985 |
66.488 |
<0.001 |
46.9 |
~PD+SM+SLA |
-304.280 |
4 |
619.429 |
67.933 |
<0.001 |
47.4 |
~PD+N+SLA |
-304.369 |
4 |
619.607 |
68.110 |
<0.001 |
47.3 |
~MPD+SM |
-305.589 |
3 |
619.750 |
68.253 |
<0.001 |
45.6 |
~MPD+SM+SLA |
-304.947 |
4 |
620.764 |
69.267 |
<0.001 |
46.5 |
~S+P |
-306.727 |
3 |
622.026 |
70.530 |
<0.001 |
44.0 |
~S |
-309.802 |
2 |
625.942 |
74.445 |
<0.001 |
39.4 |
~S+SLA |
-309.248 |
3 |
627.068 |
75.572 |
<0.001 |
40.2 |
~PD+P |
-309.484 |
3 |
627.539 |
76.042 |
<0.001 |
39.9 |
~MPD+SLA |
-309.968 |
3 |
628.506 |
77.010 |
<0.001 |
39.1 |
~MPD |
-311.139 |
2 |
628.617 |
77.120 |
<0.001 |
37.3 |
~FAD |
-312.941 |
2 |
632.220 |
80.723 |
<0.001 |
34.3 |
~PD |
-314.134 |
2 |
634.606 |
83.110 |
<0.001 |
32.2 |
~PD+SLA |
-313.311 |
3 |
635.193 |
83.696 |
<0.001 |
33.6 |
~N+SM+SLA |
-314.022 |
4 |
638.914 |
87.418 |
<0.001 |
32.4 |
~N+SM |
-316.040 |
3 |
640.652 |
89.155 |
<0.001 |
28.8 |
~Hmax |
-318.529 |
2 |
643.396 |
91.899 |
<0.001 |
24.2 |
~SM |
-322.101 |
2 |
650.540 |
99.043 |
<0.001 |
16.9 |
~P+SM |
-321.426 |
3 |
651.424 |
99.927 |
<0.001 |
18.3 |
~SM+SLA |
-321.584 |
3 |
651.740 |
100.243 |
<0.001 |
18.0 |
~N+SLA |
-323.393 |
3 |
655.357 |
103.860 |
<0.001 |
14.1 |
~N |
-324.636 |
2 |
655.610 |
104.113 |
<0.001 |
11.4 |
~1 |
-329.409 |
1 |
662.985 |
111.488 |
<0.001 |
0.0 |
~P |
-328.601 |
2 |
663.540 |
112.043 |
<0.001 |
2.0 |
~SLA |
-329.159 |
2 |
664.656 |
113.159 |
<0.001 |
0.6 |
Table A5. After substituting the five original control quadrats with 10 quadrats where rare species were removed (see Methods), generalized linear model (GLM) results for biomass production as a function of number of species (S), Shannon's evenness (H') and phylogenetic diversity (PD = phylogenetic diversity, MPD = mean pairwise distance and Hed = evolutionary distinctiveness), and various community-level means of single functional traits (Hmax = maximum plant height, P = leaf phosphorus content, N = leaf nitrogen content, SM = mean seed mass and SLA = specific leaf area) or multivariate functional trait indices (FD = functional diversity, FAD = functional attribute diversity). Shown are the estimated number of model parameters (k), maximum log-likelihood (LL), the information-theoretic Akaike's information criterion corrected for small samples (AICc), change in AICc relative to the top-ranked model (ΔAICc), AICc weight (wAICc = model probability) and the percent deviance explained (%DE) as a measure of the model's goodness-of-fit.
Model |
LL |
k |
AICc |
ΔAICc |
wAICc |
%DE |
~Hed+Hmax |
-290.438 |
3 |
589.410 |
0.000 |
0.665 |
77.7 |
~PD+Hmax |
-291.421 |
3 |
591.375 |
1.965 |
0.249 |
77.1 |
~S+Hmax |
-292.509 |
3 |
593.552 |
4.143 |
0.084 |
76.5 |
~MPD+Hmax |
-296.914 |
3 |
602.362 |
12.952 |
0.001 |
73.8 |
~H'+Hmax |
-297.543 |
3 |
603.619 |
14.210 |
0.001 |
73.4 |
~Hed+N+SM |
-303.915 |
4 |
618.642 |
29.232 |
<0.001 |
68.9 |
~S+N+SM |
-304.273 |
4 |
619.357 |
29.948 |
<0.001 |
68.6 |
~Hed+N+SM+SLA |
-303.904 |
5 |
620.959 |
31.549 |
<0.001 |
68.9 |
~S+N+SM+SLA |
-304.258 |
5 |
621.666 |
32.257 |
<0.001 |
68.6 |
~H'+N+SM |
-307.244 |
4 |
625.299 |
35.890 |
<0.001 |
66.2 |
~H'+N+SM+SLA |
-307.170 |
5 |
627.490 |
38.081 |
<0.001 |
66.3 |
~PD+N+SM |
-310.341 |
4 |
631.494 |
42.084 |
<0.001 |
63.6 |
~PD+N+SM+SLA |
-310.335 |
5 |
633.820 |
44.410 |
<0.001 |
63.6 |
~Hed+P+SM |
-313.346 |
4 |
637.503 |
48.093 |
<0.001 |
60.8 |
~Hed+SM |
-315.403 |
3 |
639.340 |
49.931 |
<0.001 |
58.8 |
~Hed+SM+SLA |
-314.760 |
4 |
640.331 |
50.921 |
<0.001 |
59.4 |
~Hed+N |
-316.028 |
3 |
640.589 |
51.179 |
<0.001 |
58.1 |
~H'+N |
-316.407 |
3 |
641.347 |
51.938 |
<0.001 |
57.8 |
~S+P+SM |
-315.629 |
4 |
642.070 |
52.660 |
<0.001 |
58.5 |
~Hed+N+SLA |
-315.845 |
4 |
642.501 |
53.091 |
<0.001 |
58.3 |
~H'+P+SM |
-316.208 |
4 |
643.228 |
53.818 |
<0.001 |
58.0 |
~H'+SM |
-317.529 |
3 |
643.592 |
54.182 |
<0.001 |
56.6 |
~H'+N+SLA |
-316.395 |
4 |
643.600 |
54.191 |
<0.001 |
57.8 |
~S+SM |
-317.840 |
3 |
644.212 |
54.803 |
<0.001 |
56.2 |
~H'+SM+SLA |
-317.389 |
4 |
645.590 |
56.180 |
<0.001 |
56.7 |
~MPD+N |
-318.585 |
3 |
645.704 |
56.294 |
<0.001 |
55.4 |
~S+SM+SLA |
-317.448 |
4 |
645.708 |
56.298 |
<0.001 |
56.7 |
~MPD+N+SLA |
-318.146 |
4 |
647.103 |
57.693 |
<0.001 |
55.9 |
~Hed+P |
-321.392 |
3 |
651.318 |
61.908 |
<0.001 |
52.3 |
~H'+P |
-321.822 |
3 |
652.178 |
62.769 |
<0.001 |
51.8 |
~S+N |
-321.915 |
3 |
652.363 |
62.953 |
<0.001 |
51.7 |
~PD+P+SM |
-320.845 |
4 |
652.502 |
63.092 |
<0.001 |
52.9 |
~H' |
-323.513 |
2 |
653.342 |
63.932 |
<0.001 |
49.8 |
~FD |
-323.729 |
2 |
653.774 |
64.364 |
<0.001 |
49.5 |
~Hed |
-323.873 |
2 |
654.063 |
64.653 |
<0.001 |
49.3 |
~Hed+SLA |
-322.886 |
3 |
654.305 |
64.895 |
<0.001 |
50.5 |
~S+N+SLA |
-321.854 |
4 |
654.518 |
65.108 |
<0.001 |
51.7 |
~H'+SLA |
-323.148 |
3 |
654.829 |
65.420 |
<0.001 |
50.2 |
~MPD+P |
-323.869 |
3 |
656.271 |
66.862 |
<0.001 |
49.3 |
~PD+SM |
-324.457 |
3 |
657.447 |
68.038 |
<0.001 |
48.6 |
~PD+SM+SLA |
-323.775 |
4 |
658.361 |
68.952 |
<0.001 |
49.4 |
~PD+N |
-325.344 |
3 |
659.222 |
69.812 |
<0.001 |
47.5 |
~PD+N+SLA |
-325.117 |
4 |
661.045 |
71.635 |
<0.001 |
47.8 |
~S+P |
-328.381 |
3 |
665.296 |
75.886 |
<0.001 |
43.5 |
~S |
-330.864 |
2 |
668.044 |
78.635 |
<0.001 |
39.9 |
~MPD+SLA |
-330.018 |
3 |
668.569 |
79.159 |
<0.001 |
41.2 |
~S+SLA |
-330.114 |
3 |
668.761 |
79.351 |
<0.001 |
41.0 |
~MPD |
-331.951 |
2 |
670.218 |
80.809 |
<0.001 |
38.3 |
~PD+P |
-331.694 |
3 |
671.921 |
82.511 |
<0.001 |
38.7 |
~FAD |
-334.467 |
2 |
675.249 |
85.840 |
<0.001 |
34.5 |
~N+SM |
-334.052 |
3 |
676.637 |
87.228 |
<0.001 |
35.1 |
~N+SM+SLA |
-332.952 |
4 |
676.714 |
87.305 |
<0.001 |
36.8 |
~PD+SLA |
-334.443 |
3 |
677.419 |
88.010 |
<0.001 |
34.5 |
~PD |
-335.723 |
2 |
677.762 |
88.353 |
<0.001 |
32.5 |
~Hmax |
-341.253 |
2 |
688.821 |
99.411 |
<0.001 |
22.9 |
~SM |
-342.079 |
2 |
690.473 |
101.064 |
<0.001 |
21.3 |
~P+SM |
-341.582 |
3 |
691.698 |
102.288 |
<0.001 |
22.3 |
~SM+SLA |
-341.944 |
3 |
692.421 |
103.012 |
<0.001 |
21.6 |
~N |
-345.920 |
2 |
698.156 |
108.747 |
<0.001 |
13.7 |
~N+SLA |
-345.507 |
3 |
699.548 |
110.138 |
<0.001 |
14.6 |
~1 |
-352.136 |
1 |
708.428 |
119.018 |
<0.001 |
0.0 |
~P |
-351.718 |
2 |
709.752 |
120.342 |
<0.001 |
1.0 |
~SLA |
-352.131 |
2 |
710.577 |
121.167 |
<0.001 |
0.0 |
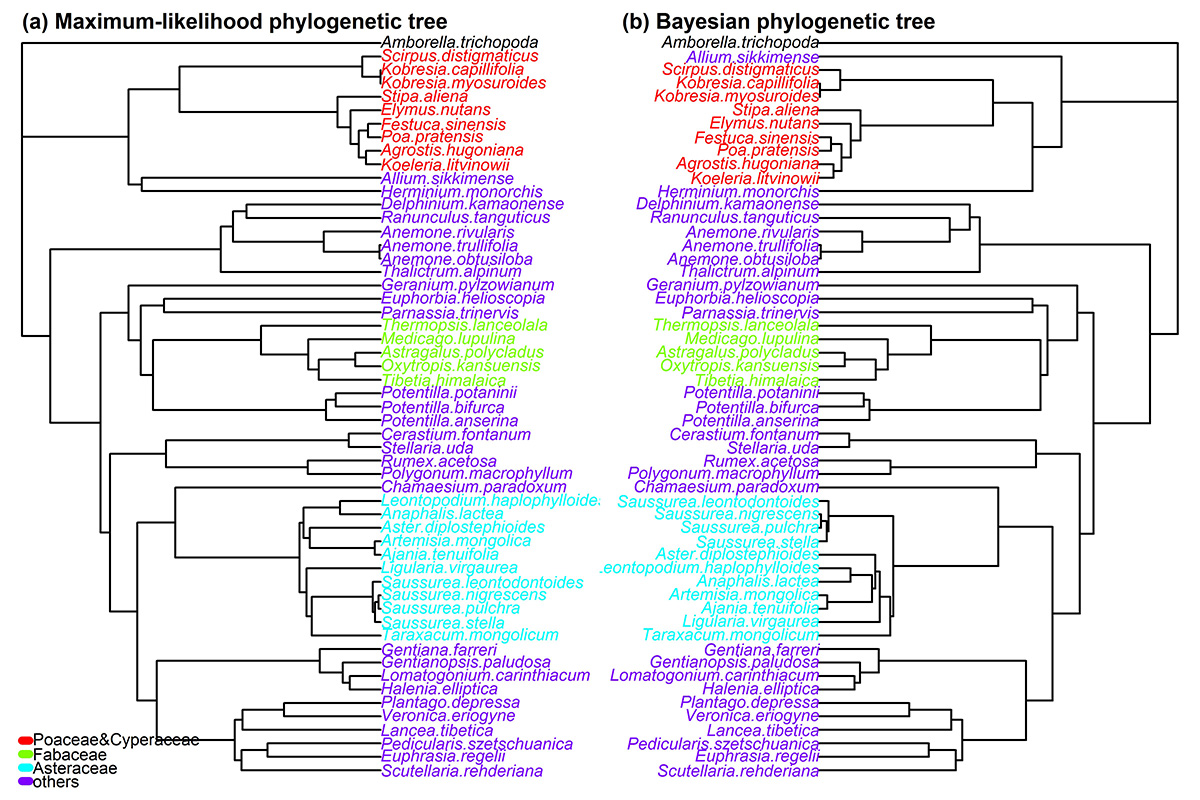
Fig. A1. (a) Maximum-likelihood and (b) Bayesian phylogenetic trees.
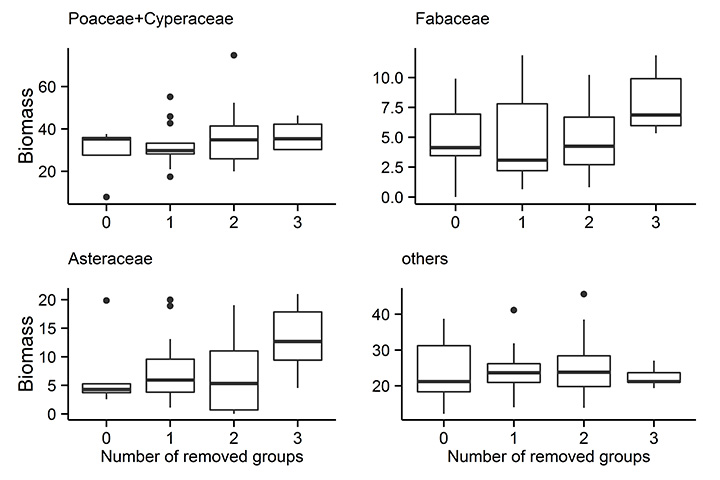
Fig. A2. The effect of number of removed groups on the biomass of each taxonomic group.
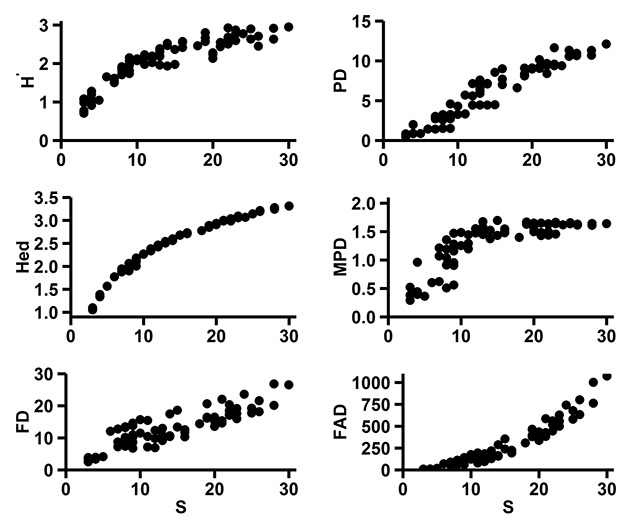
Fig. A3. Bivariate plots of the raw species (S and H'), phylogenetic (PD), evolutionary distinctiveness (Hed), mean pairwise distance (MPD) and multivariate functional diversity (FD, FAD) indices.
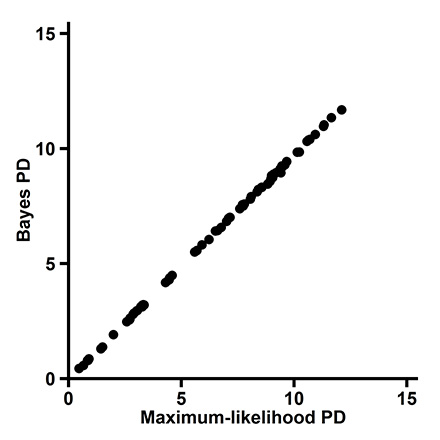
Fig. A4. Correlation between phylogenetic diversity (PD) determined via maximum likelihood and Bayes theorem (Spearman's ρ = 0.999).
Literature cited
Botta-Dukát, Z. 2005. Rao's quadratic entropy as a measure of functional diversity based on multiple traits. Journal of Vegetation Science 16:533–540.
Cardinale, B. J., D. S. Srivastava, J. Emmett Duffy, J. P. Wright, A. L. Downing, M. Sankaran, and C. Jouseau. 2006. Effects of biodiversity on the functioning of trophic groups and ecosystems. Nature 443:989–992.
Cornwell, W. K., D. W. Schwilk, and D. D. Ackerly. 2006. A trait-based test for habitat filtering: convex hull volume. Ecology 87:1465–1471.
Gamfeldt, L., H. Hillebrand, and P. R. Jonsson. 2008. Multiple functions increase the importance of biodiversity for overall ecosystem functioning. Ecology 89:1223–1231.
Petchey, O. L., and K. J. Gaston. 2002. Functional diversity (FD), species richness and community composition. Ecology Letters 5:402–411.
Tilman, D., D. Wedin, and J. Knops. 1996. Productivity and sustainability influenced by biodiversity in grassland ecosystems. Nature 379:718–720.
Villéger, S., N. W. H. Mason, and D. Mouillot. 2008. New multidimensional functional diversity indices for a multifaceted framework in functional ecology. Ecology 89:2290–2301.
Walker, B., A. Kinzig, and J. Langridge. 1999. Plant attribute diversity, resilience, and ecosystem function: the nature and significance of dominant and minor species. Ecosystems 2:95–113.
Webb, C. O., D. D. Ackerly, M. A. McPeek, and M. J. Donoghue. 2002. Phylogenies and community ecology. Annual Review of Ecology and Systematics 33:475–505.