Ecological Archives E096-002-A4
Onja H. Razafindratsima and Amy E. Dunham. 2015. Assessing the impacts of nonrandom seed dispersal by multiple frugivore partners on plant recruitment. Ecology 96:2430. http://dx.doi.org/10.1890/14-0684.1
Appendix D. Estimation of dispersal parameters and demographic rates, and creation of probability recruitment models.
Quantity of dispersed seeds
We estimated the quantity of Cryptocarya seeds dispersed per tree for each individual lemur group during the tree species' fruiting season (March-October). These estimates were based on the average observed hourly rates of defecation of Cryptocarya seeds per lemur relative to the density of adult Cryptocarya trees in their respective territory (from transect data). We extrapolated from hourly dispersal rates, the per capita number of seeds per tree dispersed per fruiting season (240 days), assuming a 12 h day for each frugivore species. It is important to note that while this allowed us to standardize our comparison between the dispersers, all three lemur species have been observed to exhibit some level of cathemerality in Ranomafana (Eulemur spp.: Overdorff 1988, Overdorff and Rasmussen 1995, Overdorff 1996; V. v. editorum: Johnson, personal communication, and Balko, personal communication in Wright 1999), introducing uncertainty to our estimates since potential nighttime feeding rates are unknown. We then multiplied our per capita (frugivore) estimates of dispersal rate by the disperser's average density in the park (E. rubriventer: 5.46 individuals / km² ; E. rufifrons: 6.70 individuals / km² ; V. v. editorum : 2.23 individuals / km² , Wright et al. 2012) and divided by the estimated density of adult Cryptocarya trees in each species' territory. Seed dispersal rates per frugivore species used in our probability recruitment models were calculated using averages across groups.
Dispersal bias into different microhabitats
For each frugivore species, we determined the pattern of seed deposition into the different microhabitat categories (gap: <55%; medium-shaded: 55–75%; shaded: >75%; and under a conspecific adult) with data from direct observations of dispersal events. We calculated the relative availability of each microhabitat category at each study area as the proportion of occurrence from the transect data. Canopy cover categories were calculated separately from the availability of microhabitats under conspecific adults. The "preference" of each frugivore species for depositing seeds into each microhabitat category was estimated as the proportion of dispersal events in a given microhabitat category (i.e., under each of the different canopy covers described above) divided by the relative availability of that category in the study site where the lemur groups were observed. Results were then subtracted from one such that positive numbers represented "preference" and negative numbers represented "avoidance".
Demographic rates
Relative germination rates were calculated as the proportion of seeds that germinated in the exclosure plots during the 3-month initial experiment relative to the number of seeds planted. We estimated removal/predation rates as the proportion of seeds that were being preyed upon or removed in the open subplots during the 3-month experiment. We estimated survival from the initial set-up to 3 months as the number of intact seeds and seedlings at 3 months in open subplots relative to the number of seeds planted. The one year seedling transition probabilities were estimated as the mean proportion of surviving seedlings from the paired subplots after a year of experiment initiation relative to the total number of intact seeds and seedlings at 3 months. And finally, transition probabilities from one year seedling to three year old sapling were estimated from the number of saplings at year 3 relative to seedlings at year 1.
Three-year recruitment model
We assessed the relative contribution of each disperser to the 3-year recruitment of their host plant with a simulated recruitment model performed in MATLAB R2011a (The MathWorks Inc., Natick, MA) parameterized by our observational and experimental data (Fig. D1). To do this, we used the following model:
![]()
For each microhabitat "i" (i = 1 … n), Qi represents the average number of Cryptocarya seeds dispersed per adult tree into microhabitat i during the species' fruiting season. Si represents the 3 month survival of seeds and seedlings in each microhabitat "i", and TP1iand TP2i respectively, represent the 3 month - 1 year and 1 year - 3 year transition probabilities of seedlings in microhabitat "i". The simulation modelled the quantity of seeds dispersed per tree per fruiting season by each disperser with a Poisson distribution, which is appropriate for counting the number of occurrences of a random event in a given time (Quinn and Keough 2002). We used a multinomial distribution to model the probabilities of seed deposition into the different microhabitats and a binomial function to model the vital rates (germination and transition rates). A multinomial distribution is often used to model the probability of success from multiple mutually exclusive outcomes (Quinn and Keough 2002). Simulations were run 1000 times.
We used our model to estimate the contribution of each disperser to per capita seed recruitment by dividing the number of recruited saplings with the number of seeds dispersed as estimated in the model. "No dispersal" assumes that all seeds fall under the parent tree. "Random dispersal" assumes that seeds fall into different microhabitat categories with probabilities based on availability in the habitat. We calculated "random dispersal" separately for each species such that estimates of availability of Cryptocarya trees and each microhabitat category were based on the same distribution used in the individual species models.
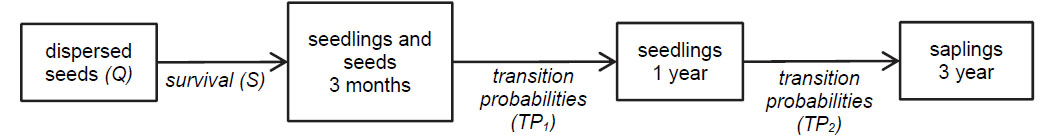
Fig. D1. Schematic representation of Cryptocarya's recruitment dynamics in each microhabitat category in this study.
Literature cited
Overdorff, D. 1988. Preliminary report on the activity cycle and diet of the red-bellied Lemur (Lemur rubriventer) in Madagascar. American Journal of Primatology 16:143–153.
Overdorff, D. and M. Rasmussen. 1995. Determinants of nighttime activity in 'diurnal' lemurid primates. Pages 61–74 in L. Alterman, editor. Creatures of the dark: the nocturnal prosimians. Plenum, New York, USA.
Overdorff, D. J. 1996. Ecological correlates to activity and habitat use of two prosimian primates: Eulemur rubriventer and Eulemur fulvus rufus in Madagascar. American Journal of Primatology 40:327–342.
Quinn, G. P. and M. J. Keough. 2002. Experimental design and data analysis for biologists. Cambridge University Press.
Wright, P. C. 1999. Lemur traits and Madagascar ecology: Coping with an island environment. Pages 31–72 Yearbook of Physical Anthropology 1999, Vol 42.
Wright, P. C., E. M. Erhart, S. Tecot, A. L. Baden, S. J. Arrigo-Nelson, J. Herrera, T. L. Morelli, M. B. Blanco, A. Deppe, and S. Atsalis. 2012. Long-Term Lemur Research at Centre Valbio, Ranomafana National Park, Madagascar. Pages 67–100 in P. M. Kappeler and D. P. Watts, editors. Long-Term Field Studies of Primates. Springer-Verlag, New York, USA.