Ecological Archives E095-204-A5
Masato Yamamichi, Takehito Yoshida, and Akira Sasaki. 2014. Timing and propagule size of invasion determine its success by a time-varying threshold of demographic regime shift. Ecology 95:23032315. http://dx.doi.org/10.1890/13-1527.1
Appendix E. Three-dimensional views of the time-varying dose–response curve and the phase space representation.
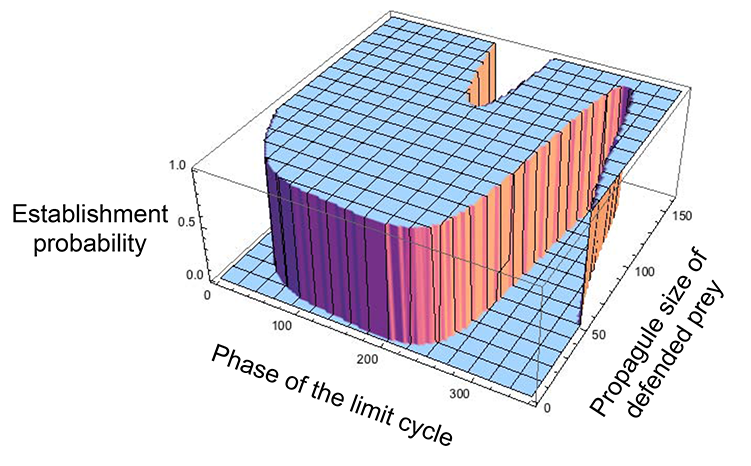
Fig. E1. Three-dimensional view of the time-varying dose–response curve as Fig. 2E. X- and Y-axis are phase of the limit cycle and propagule size of defended prey, respectively, and Z-axis is establishment probability (0 or 1). Note that large propagule size can prevent invasion of defended prey because of the complicated shape of basins of attraction.
Image E1. Three-dimensional view of the phase space representation of the dynamics as Fig. 2F, showing the surface separating the basins of attraction of the resident limit cycle (gray orbit) and the invaded equilibrium (black point).
