Ecological Archives E095-204-A4
Masato Yamamichi, Takehito Yoshida, and Akira Sasaki. 2014. Timing and propagule size of invasion determine its success by a time-varying threshold of demographic regime shift. Ecology 95:23032315. http://dx.doi.org/10.1890/13-1527.1
Appendix D. Effects of invasion timing and propagule size in the bistabilities 1a, 1b, 2b, 3a, and 3b of the chemostat model.
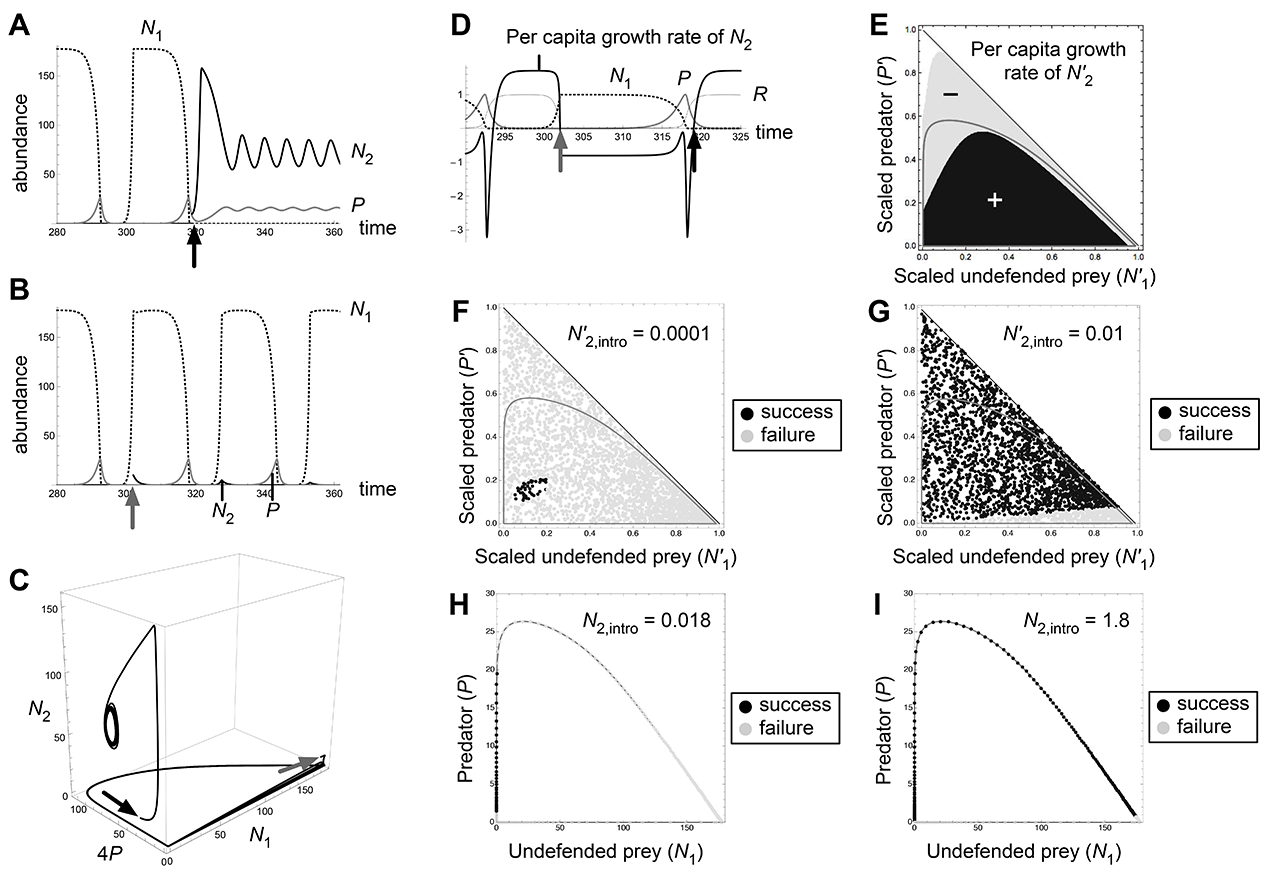
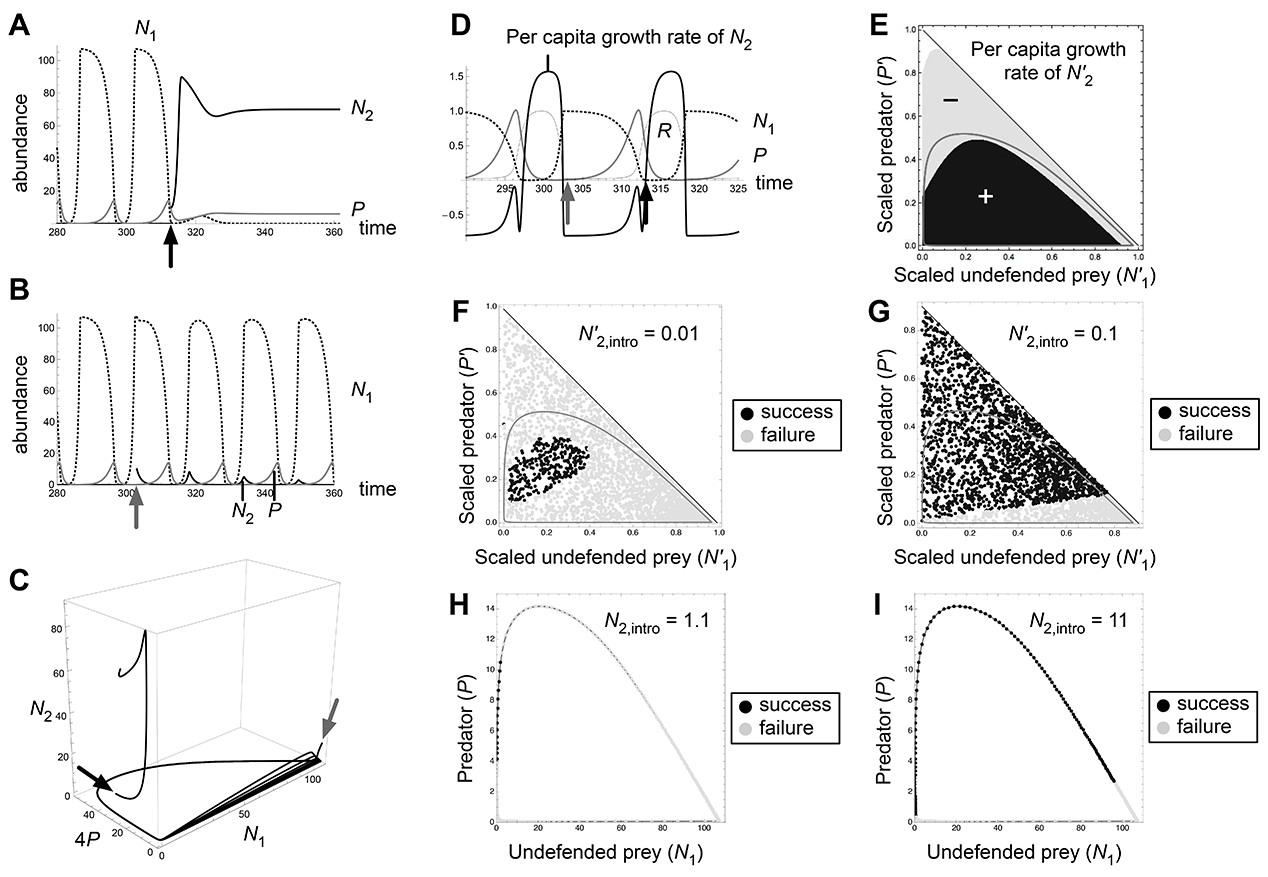
Fig. D1. Effects of invasion timing and propagule size in the bistability 1a (O1/E2) of the chemostat model (c2 = 0.3, δ = 1.4, RI = 110). Introduction at t = 313 (black arrows) results in invasion success and that at t = 303 (gray arrows) results in failure (A, B, C, D). We changed the parameter value as δ = 1.45 for quasi-equilibrium dynamics (E, F, G) so that the system shows bistability. This is because we assume the predator mortality rate to be zero (m = 0) for quasi-equilibrium dynamics.
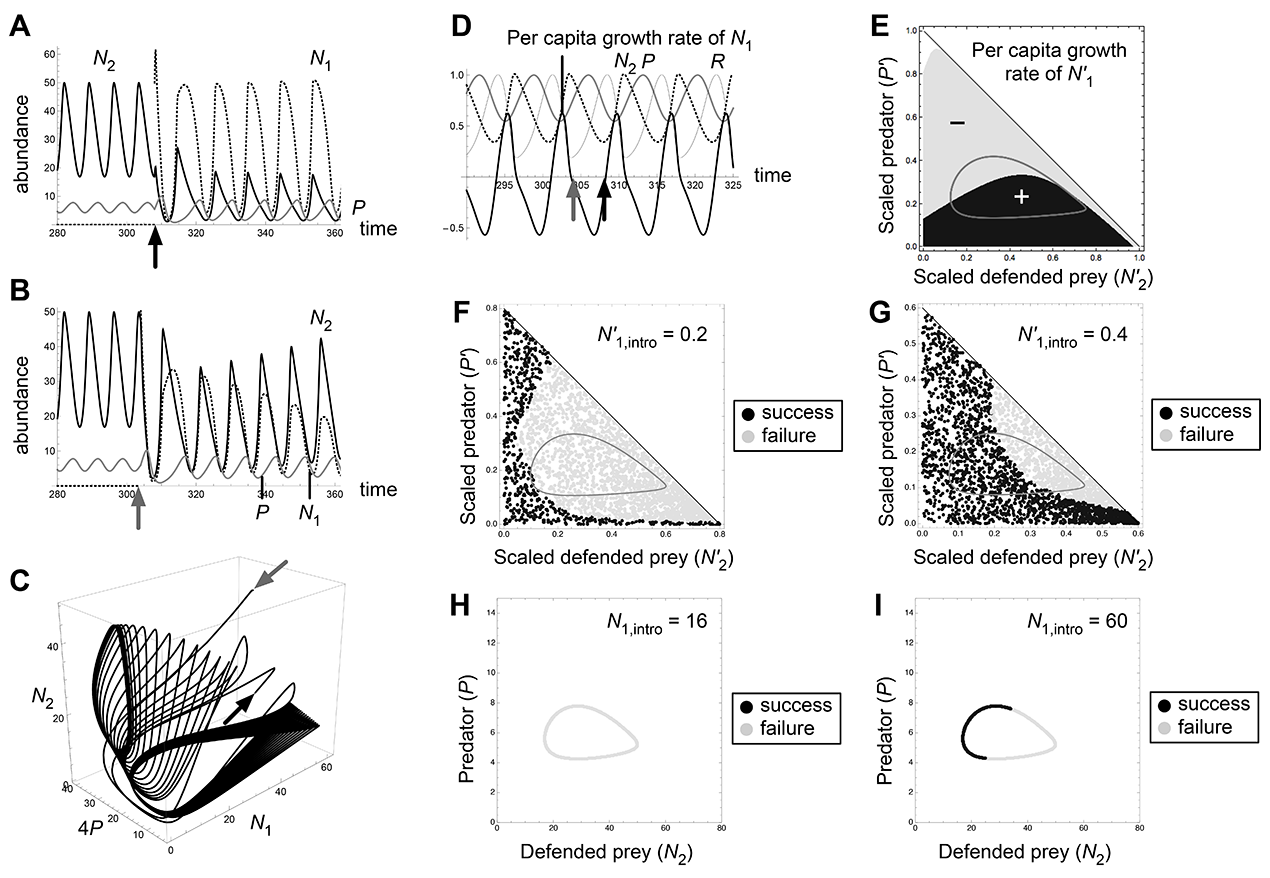
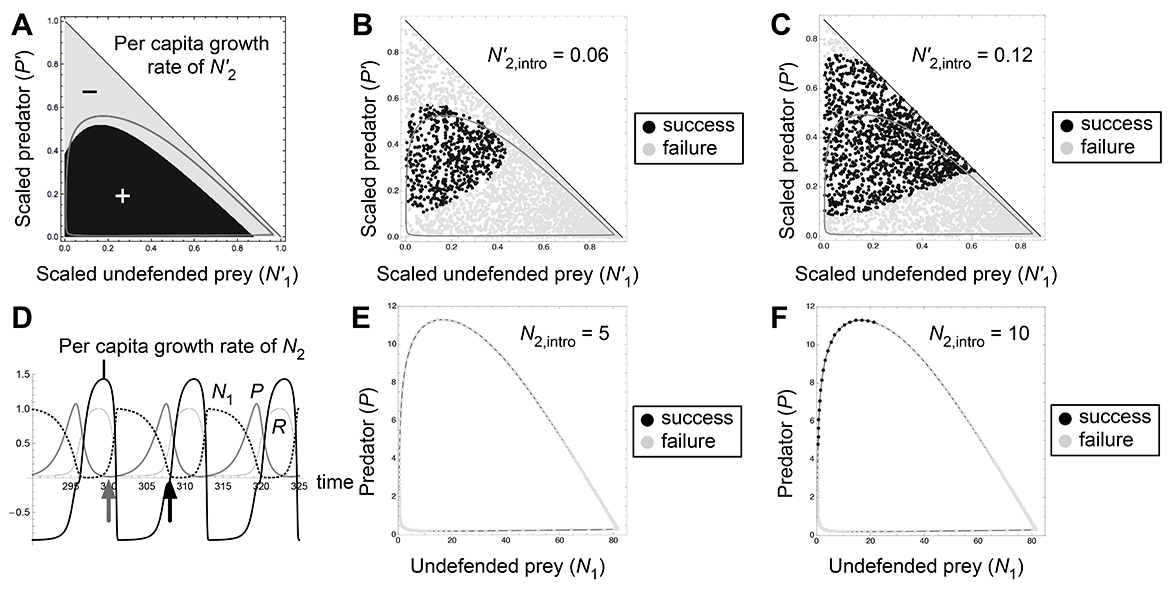
Fig. D2. Effects of invasion timing and propagule size in the bistability 1b (O1/O2) of the chemostat model (c2 = 0.3, δ = 1.4, RI = 180) when defended prey is invading. Introduction at t = 319 (black arrows) results in invasion success and that at t = 302 (gray arrows) results in failure (A, B, C, D). We changed the parameter value as δ = 1.47 for quasi-equilibrium dynamics (E, F, G) so that the system shows the bistability 1b.
Fig. D3. Effects of invasion timing and propagule size in the bistability 1b (O1/O2) of the chemostat model (c2 = 0.7, δ = 1.4, RI = 80, α = 0.5) when undefended prey is invading. Introduction at t = 308 (black arrows) results in invasion success and that at t = 304 (gray arrows) results in failure (A, B, C, D).
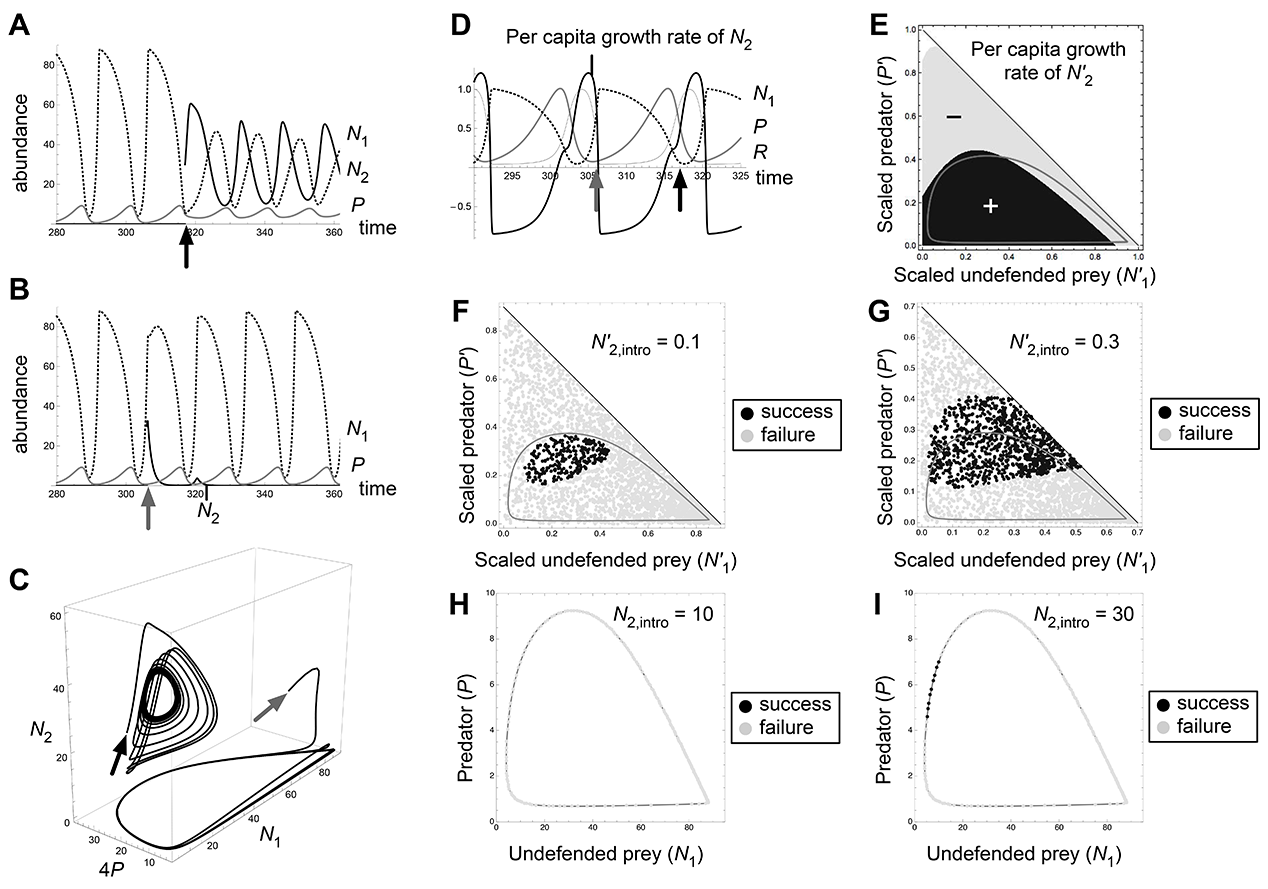
Fig. D4. Effects of invasion timing and propagule size in the bistability 2b (O1/O12) of the chemostat model (c2 = 0.3, δ = 1.6, RI = 95). Introduced defended prey is 30 here (A, B, C). Introduction at t = 317 (black arrows) results in invasion success and that at t = 306 (gray arrows) results in failure (A, B, C, D).
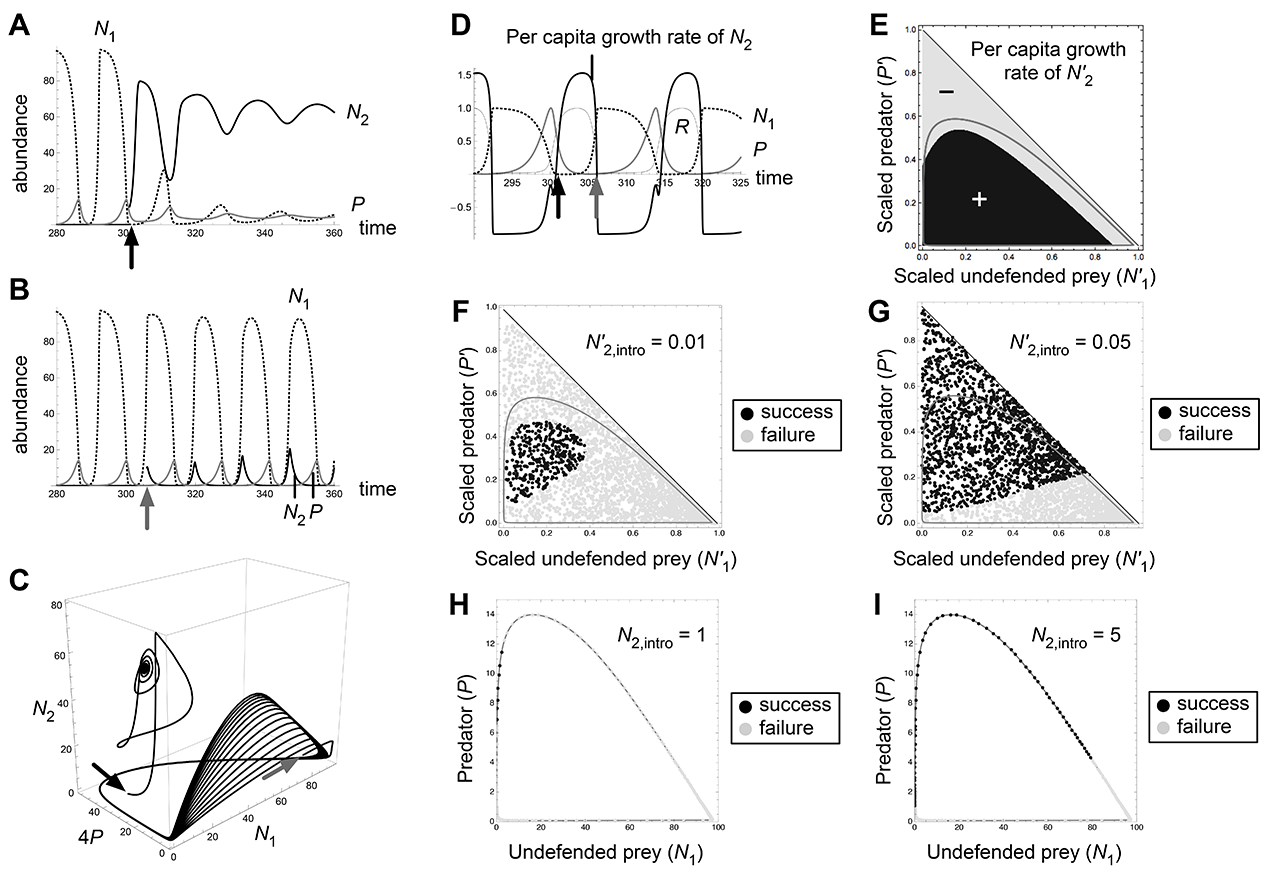
Fig. D5. Effects of invasion timing and propagule size in the bistability 3a (O12/E12) of the chemostat model (c2 = 0.2, δ = 1.27, RI = 100). Introduction at t = 301 (black arrows) results in the stable equilibrium and that at t = 306 (gray arrows) results in the limit cycle (A, B, C, D). We changed the parameter value as c2 = 0.175 for quasi-equilibrium dynamics (E, F, G) so that the system shows the bistability 3a.
Fig. D6. Effects of invasion timing and propagule size in the bistability 3b (O12/O12) of the chemostat model (c2 = 0.2, δ = 1.27, RI = 85). We changed the parameter value as c2 = 0.19 for quasi-equilibrium dynamics (A, B, C) so that the system shows the bistability 3b. Black and gray arrows (D) show the invasion timings in Fig. 5.