Ecological Archives E094-195-D1
Bourg, Norman A., William J. McShea, Jonathan R. Thompson, Jennifer C. McGarvey, and Xiaoli Shen. 2013. Initial census, woody seedling, seed rain, and stand structure data for the SCBI SIGEO Large Forest Dynamics Plot. Ecology 94:2111. http://dx.doi.org/10.1890/13-0010.1
Metadata
Abstract: We present data from the first five years (20082012) of the establishment of the 25.6-ha Smithsonian Conservation Biology Institute (SCBI) Large Forest Dynamics Plot, comprising the initial woody stem census, woody seedling plot surveys, seed rain, and dendrochronological data. The plot is in mature secondary mixed deciduous forest 5 km south of Front Royal, Virginia, USA. The initial plot census enumerated 38,932 free-standing living stems and 29,991 living individuals >1 cm DBH comprising 62 species, 38 genera, and 26 families, along with an additional 1248 dead/missing standing stems, for a total of 40,180 stems. Dominant canopy trees include tulip poplar (Liriodendron tulipifera), hickories (Carya spp.), oaks (Quercus spp.), white ash (Fraxinus americana), and black gum (Nyssa sylvatica). Prominent understory components include spicebush (Lindera benzoin), pawpaw (Asimina triloba), American hornbeam (Carpinus caroliniana), witchhazel (Hamamelis virginiana), and eastern redbud (Cercis canadensis). Few species predominate numerically on the plot; seven species have >1000 individuals (71.3% of the total). Mean stand density was 1179 living individuals/ha, while mean basal area was 34.1 m²/ha. Of the total plot area, 4 ha have had white-tailed deer (Odocoileus virginianus) exclusion since 1990. Woody seedling surveys from 20102012 in 354 1-m² plots measured 19,415 seedlings of 47 species, from new germinants up to 1 cm DBH. Community-wide seed rain data from 200 0.5-m² litterfall traps yielded a total of 9197 records from 37 species. Long-term seed data collected from 19862011 for Quercus and Carya within the exclosure and two replicate sites are also presented, documenting considerable annual variation in mast production. Dendrochronological data from 492 tree cores suggested the major canopy trees established circa 1900, but scattered trees of several species existed earlier. Large-scale forest dynamics plots employing standardized methodology have a long, rich history in the tropics. Similar plots in the temperate zone have been largely lacking, however. The SCBI plot represents one of the first of its kind in the Smithsonian Global Earth Observatorys recently established network of such plots, complementing its well-known network of tropical forest plots and enabling comparative studies on forest ecology and climate change at the global scale.
D. Key words: census; deer exclusion; dendrochronology; mast production; seed rain; seedling dynamics; temperate forest; temperate trees.
Introduction
Here we present data gathered during the first five years of the establishment of the 25.6 ha (400 m x 640 m) Smithsonian Conservation Biology Institute (SCBI) temperate Large Forest Dynamics Plot (LFDP), consisting of the initial woody stem census, woody seedling plot surveys, seed rain data collected from litterfall traps, and dendrochronological data from tree core collection. The SCBI plot was begun in April 2008 using the methodology of Condit (1998). Permanent tagging and diameter-at-breast-height (DBH) measurements of virtually all stems > 1 cm DBH were completed by the end of 2008 (273 stems missed in the initial year were measured in subsequent years), ensuring that initial size measurements were collected in the same growing year. Mapping and identification of stems continued through 2010, and identifications were finalized in 2011. Woody seedling plot surveys were initiated in 2010, and repeated annually in the growing seasons of 2011 and 2012. Seed rain data were collected from litterfall traps on a biweekly or monthly basis (dependent upon season) from 2009–2011. The plot is located in mature secondary mixed deciduous forest on the SCBI approximately five km south of Front Royal, Virginia, USA at the intersection of the Blue Ridge, Ridge and Valley, and Piedmont physiographic provinces (38°53'36.6" N, 78°8'43.4" W).It is classified as Upper Piedmont/Northern Blue Ridge Basic Mesic Hardwood Forest in the U.S. National Vegetation Classification system (USNVC code CEGL006186; Fleming and Patterson 2012). The plot is primarily underlain by Myersville and Montalto series silty loam soils, which are stony, steep, and well-drained. Mean elevation is 302 m a.s.l. (range 273 – 338 m; Fig. 1A), and mean annual temperature and precipitation for the area based on a nearby site is 12.7° C and 97 cm respectively (D. E. Carr 2011, Blandy Experimental Farm, Boyce, VA, unpublished data).
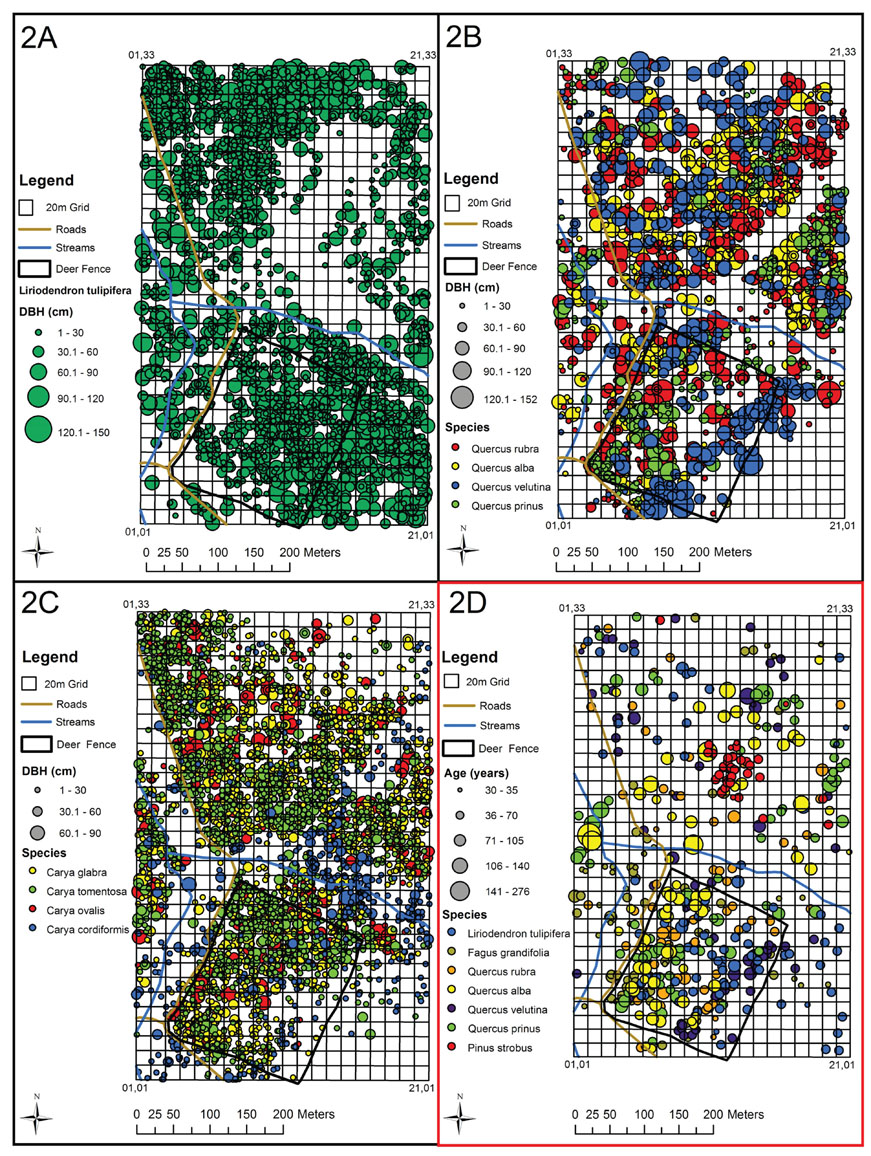
The initial plot census enumerated 38,932 free-standing living stems (i.e., all woody stems other than climbing vines >1 cm DBH of multiple-stemmed individuals) and 29,991 living individuals >1 cm DBH comprising 62 species, 38 genera, and 26 families, based on Angiosperm Phylogeny Group (APG) classifications (Stevens 2001). An additional 1,242 dead standing stems and six missing stems of uncertain status >1 cm DBH were tallied, for a total of 40,180 stems in the census (Fig. 1B). Dominant canopy trees include tulip poplar (Liriodendron tulipifera), pignut, red and mockernut hickory (Carya glabra, C. ovalis and C. tomentosa), black gum (Nyssa sylvatica), white ash (Fraxinus americana), white and red oak (Quercus alba, Q. rubra), slippery elm (Ulmus rubra), and American beech (Fagus grandifolia) (Fig. 1C; Fig. 2A, B, C). Prominent understory components include spicebush (Lindera benzoin), pawpaw (Asimina triloba), American hornbeam (Carpinus caroliniana), witchhazel (Hamamelis virginiana),eastern redbud (Cercis canadensis), flowering dogwood (Cornus florida), blackhaw (Viburnum prunifolium), and common serviceberry (Amelanchier arborea) (Fig. 1D). Typical of temperate forests, the SCBI plot is characterized by a numerical predominance of a small number of species; seven species are represented by more than 1,000 individuals, together making up 71.3% of all individuals. Mean stand density from the first census was 1,179 living individuals/ha, while mean basal area was 34.1 m²/ha. Of the total plot area, 4-ha have had white-tailed deer (Odocoileus virginianus Zimmermann) exclusion since 1990. Woody seedling surveys conducted from 2010–2012 in 354 1 m² seedling quadrats randomly stratified across the plot to adequately sample all habitats (upland, riparian, and deer exclosure) measured 19,415 seedlings of 47 species ranging in size from new germinants up to 1cm DBH. Seed rain data compiled between 2009–2011 from a network of two hundred 0.5 m² litterfall traps yielded a total of 9,197 records from 37 species. Additionally, long-term seed data were collected from 1986 – 2011 for Quercus and Carya within the deer exclosure and two nearby replicate sites, documenting considerable annual variation in mast production. Dendrochronological data from 492 tree cores (Fig. 2D) suggested that the major canopy trees established circa 1900, but that scattered trees of several species existed prior to that time. Growth increments in tree cores also show several periods of reduced growth corresponding to regional droughts.
Site history and characteristics
For more than 10,000 years, native people cleared areas along waterways and in some uplands with sporadic understory burning throughout the Eastern Deciduous Forest region of North America (Clark and Royall 1995, Delcourt and Delcourt 1998, Chilton 1999, Black et al. 2006; but see also Russell 1983). Nonetheless, the region was overwhelmingly forested and chiefly governed by non-anthropogenic disturbances and successional dynamics. Beginning in the mid-17th century and accelerating through the 19th century, a region-wide campaign of logging and agricultural clearing removed more than half of the forest cover and cut over almost all of the rest (Whitney 1994). Few primary forests remain today. The SCBI LFDP is part of this expansive Eastern Deciduous Forest and lies within its Oak-Chestnut/Appalachian Oak region, which encompasses the ridges of the Appalachian mountain range from northern Georgia to southern Maine (Braun 1950, Dyer 2006). American chestnut (Castanea dentata), once common in the region, suffered a near complete extirpation as a canopy tree in the early 20th century due to the introduced chestnut fungal blight (Cryphonectria parasitica) (Merkel 1905, Peattie 1950, Nash 1988, Wang et al. 2013).
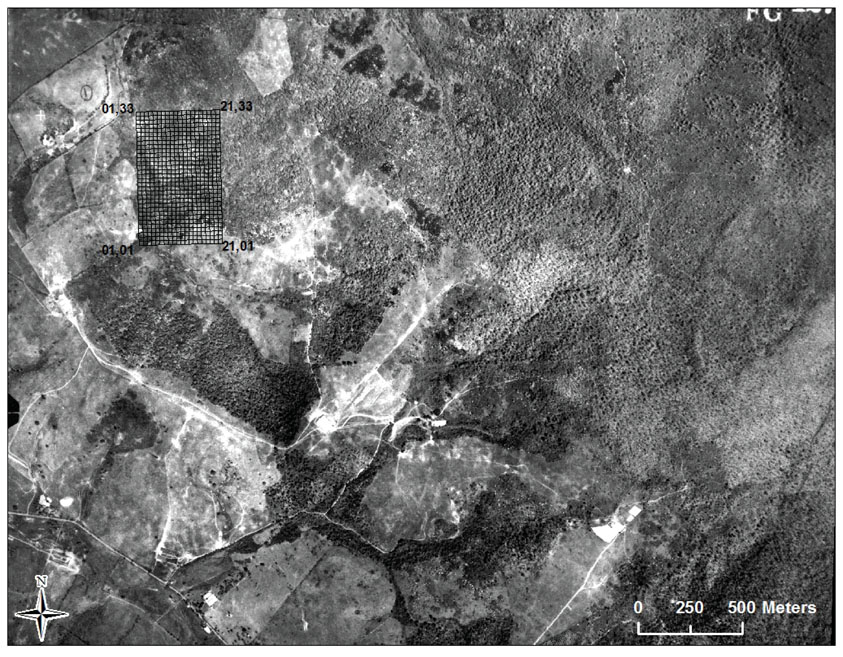
The forest habitat on the SCBI site is secondary forest with a well-known history over the past 120 years because it was part of a 1,700 ha federal purchase of 42 farms that was completed in 1909. This larger landholding was originally two land parcels in 1797 and subdivided into multiple farm parcels by 1848. With the federal purchase in 1909 the land became part of the Ayleshire Quartermaster Remount Depot which produced horses and mules for cavalry units. All the land purchased was considered farmland and pasture, and the earliest available maps (1937; 1944) show the plot area as a fenced field, with areas to the west and south as heavily used-pasture. Internal documents describe fields as lightly forested pastures on steep slopes that were suitable for horses. In a 1937 aerial map (Fig. 3), 20–25% of the entire Depot was forested, similar to a 1946 staff estimate (Sunquist 1982). The 1946 report indicated all forests had been previously grazed and wood for fence materials removed annually. Small sawmills operated on the Depot until the 1960’s. The Posey Field, where the plot is located, was considered the best timber site within the Depot in a 1953 report (Sunquist 1982). The current dirt road through the plot was present in the early maps and continues through the property to a state road. The Depot was transferred in 1948 to the USDA as a cattle breeding station and the same pastures and fields were maintained according to internal reports (Sunquist 1982). The cattle station was decommissioned in 1973 and the land was transferred to the Smithsonian Institution in 1975 (McShea et al. 1993). The Smithsonian discontinued all livestock use of pastures and fields within the Posey Creek drainage upon assuming ownership. Sporadic bushhogging (mowing of woody vegetation with tractor-mounted rotary cutting blade machines) of the old pastures west, but not south, of the plot area continue through the present day.
Internal army records indicate that hunting for white-tailed deer and other wildlife was common within the property (McShea et al. 1993). Browsing by white-tailed deer was not an issue within the study area until the SCBI started construction of a 1.8–2.4 m perimeter fence around the entire facility in 1975 (completed in 1980). The initial response to the perimeter fence was increased deer densities throughout the property, as evidenced by the loss of the hay crop from 68 to 8 metric tons between 1978 and 1980 (McShea et al. 1993). Deer densities were estimated at 35 deer/km² in 1981 (Seidensticker 1984) and subsequent estimates over the past 30 years have fluctuated around 30 deer/km² (McShea et al. 1993; McShea 2000; Heckel et al. 2010). Efforts to control the deer within the research center in the 1980’s were not successful (McShea et al. 1993; McShea and Rappole 1997) and deer densities were not managed in the plot area until sporadic culling was initiated in 2008.
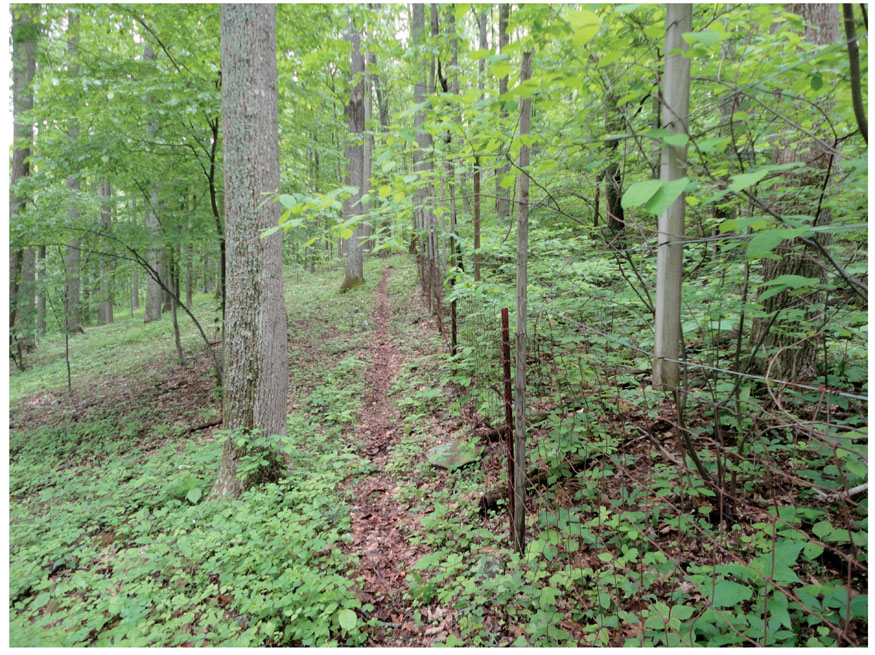
The SCBI LFDP is located within an area that has been the focus of multiple studies on white-tailed deer, including part of a larger, multi-site deer exclosure experiment started in 1990. The 4-ha exclosure was erected in 1990 and maintained through the creation of the SCBI LFDP in 2008 into the present time (Fig. 4). It is located in the southern portion of the LFDP (Fig. 1A). The exclosure fence is constructed of woven wire (American Wire Company, Inc.) designed for livestock with larger openings (15 × 15 cm) at the top, surmounted by six strands of high tensile fence wire for a total height of 2 m. The woven wire was placed “upside down” with the larger openings at the bottom to allow movement of medium-sized mammals through the fence and is attached to 1.5 m T posts driven into the ground at 5 m intervals. The high tensile wire is supported by pressure-treated posts (5 cm × 5 cm × 2.4 m) that have six slots cut at a 10° angle. The high tensile wire is kept taut by fencing cranks and springs on each line at 30 m intervals. The fence is maintained by regular inspections to remove all trees and limbs that depress the wires. Any deer that manage to gain entry into the exclosure are driven out via a corner gate.
Due to the importance of hard mast as a food resource for wildlife in Eastern deciduous forests (McShea 2000, McShea and Healy 2002), Quercus and Carya seed production was estimated within the area of the 4-ha deer exclosure from 1986 onward. We studied the movement of white-footed mice (Peromyscus leucopus) (McShea and Gilles 1992; Smallwood et al. 1998) and deer (McShea and Schwede 1993) relative to the spatial and temporal distribution of these seeds, as well as small mammal population fluctuations relative to annual variations (McShea 2000). Variable acorn production across the region was identified as a critical driver of wildlife populations (McShea et al. 2007).
The 4-ha exclosure is one of six maintained by W.J. McShea and has been a critical tool for studies of deer impacts on forest plant and animal communities (McShea and Rappole 1992; Heckel et al. 2010). The composition of woody seedlings and saplings in the forest has been strongly affected by deer browsing. Average woody seedling height is 2.25 times greater and sapling density is 4.1 times greater where deer have been excluded compared to where deer browse is unrestricted (McGarvey et al. 2013). The exclusion of deer in this and similar plots changed understory density such that breeding bird populations shifted to include more ground- and understory-nesting species (McShea and Rappole 2000). Increased understory was correlated with lower predation rates on artificial bird nests (Leimgruber et al. 1994). The reduction in acorn consumption within the exclosure grids reduced the annual fluctuations in small mammal populations (McShea 2000). Exclusion of deer resulted in increased flowering rates of native wildflowers (Fletcher et al. 2001; Heckel et al. 2010).High deer densities were correlated with the loss of the Kentucky Warbler (Geothlypis formosa) within the study site due to reduced understory shrub density (McShea et al. 1995). Single treefall disturbances within the plot that resulted in standing dead snags and increased vine coverage were identified as nesting sites for Scarlet Tanagers (Piranga olivacea) (Vega Rivera et al. 2003).
The SCBI LFDP is particularly well-suited for expanded studies of herbivore effects on temperate forest structure, composition and function due to the inclusion of a large, long-term deer exclosure within its borders and the intense and repeated censuses of woody plants that are part of its standard research schedule. The plot will also acquire even more ecological importance in the near future due to its location at the SCBI, the core site for the Mid-Atlantic domain of the National Ecological Observatory Network (NEON), a designation which will include the construction and operation of an advanced eddy covariance flux tower near the plot’s eastern boundary (Fig. 1A, large inset) as well as a designated research emphasis on invasive species for the domain. We are currently working on projections of future forest conditions in relation to deer densities, and we plan to conduct multi-site analyses of long-term deer herbivory effects using the replicated exclosures and controls we have in adjacent forest, portions of which were brought up to SIGEO census standards in the 2012 field season. Another of our active research interests lies in understanding the ecological metrics for mast seed production in oaks and hickories, particularly the interrelationships between climate change, phenological variation, animal abundances, and mast crops. A third active research interest is the interactions between deer densities and forest composition and physical properties on the distribution of exotic invasive plant species. We are currently pursuing this interest with an analysis of the distributions of the four major exotic invasive understory species present on the LFDP. Finally, we are continuing to pursue interests in the relationships between functional and phylogenetic diversity that we recently began (Swenson et al. 2012), and plan to complete a DNA barcode phylogeny of the entire LFDP vascular plant community in 2013. The SCBI stem census data has also been used in a recent multi-plot analysis of scale dependent relationships in tree species richness and ecosystem function (Chisholm et al. 2013), and is currently being employed in a number of other cross-site studies examining issues such as spatial variation in forest biomass and its implications for carbon stock remote sensing, as well as seedling dynamics in relation to adult tree densities. We encourage researchers to use these data to address their own research questions, and would welcome contacts from researchers with overlapping interests.
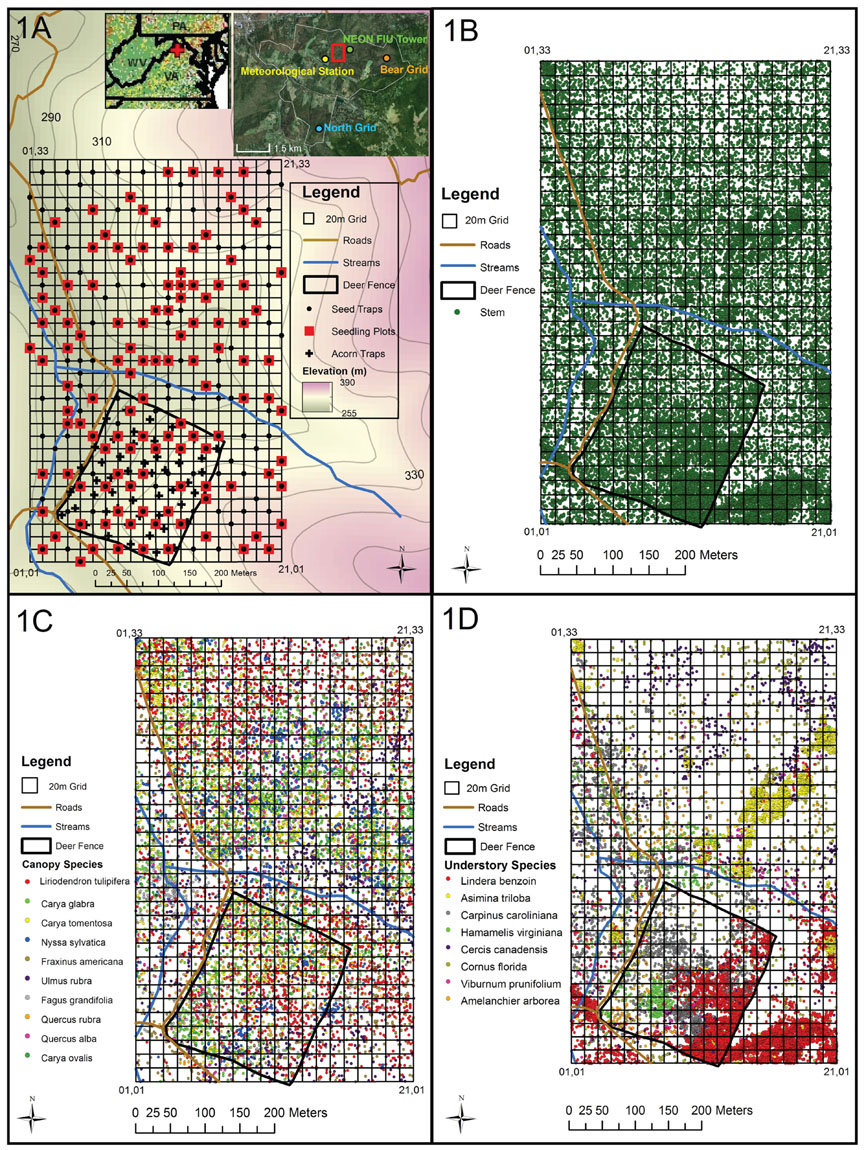
Fig. 1. Locational and stem maps of the SCBI LFDP. From top left: (A) Location of the Smithsonian Conservation Biology Institute (SCBI; small inset); SCBI property with general SCBI LFDP location in red, NEON Fundamental Instrument Unit (FIU) eddy covariance flux tower location, SIGEO-SCBI meteorological station location, and locations of the Bear and North 4 ha study grids (large inset); and LFDP detail, with x,y coordinates of the four plot corner stakes indicated (01,01 – Southwest; 01,33 – Northwest; 21,33 – Northeast; and 21,01 – Southeast). (B) Distribution of all 40,180 stems recorded in the initial census; (C) Distributions of the 10 most common canopy tree species, in decreasing order of abundance - the first four species have more than 1,000 individuals; and (D) Distributions of the 8 most common woody understory species, in decreasing order of abundance - the first three species have more than 1,000 individuals. Projection is NAD 1983, UTM Zone 17S. Note: maps have been reoriented to true north for display purposes.
Fig. 2. Stem maps of the SCBI LFDP for three major canopy tree species/generic groups and trees sampled for dendrochronological analysis. From top left: (A) Distribution and size classes of tulip poplar (Liriodendron tulipifera); (B) Distributions and size classes of the four major oak (Quercus) species; (C) Distributions and size classes of the four hickory (Carya) species; and (D) Distributions, species identities and age classes of trees sampled for dendrochronological analysis in 2010. Projection is NAD 1983, UTM Zone 17S. Note: maps have been reoriented to true north for display purposes.
Fig. 3. 1937 aerial photo of the landscape of the U.S. Army Ayleshire Quartermaster Remount Depot (present-day Smithsonian Conservation Biology Institute, SCBI), with the location of the current SCBI SIGEO Large Forest Dynamics Plot (LFDP) indicated by the black grid.
Fig. 4. Northern side of the 4 ha deer exclosure located within the SCBI SIGEO Large Forest Dynamics Plot, showing the metal wire exclosure fence running through the center of the photo, the forest on the left having chronic high deer densities, and the forest to the right inside the fence having long-term deer exclusion since 1990. Photo credit: X. Shen.
Class I. Data set descriptors
A. Data set identity: Title: Woody plant data from the 25.6-ha SCBI Large Forest Dynamics Plot, 2008–2012
B. Data set identification code: Suggested data set identification code: SCBI_woodyplants_2008_2012
C. Data set description
Principal Investigators:
William J. McShea, Smithsonian Conservation Biology Institute, National Zoological Park, 1500 Remount Road, Front Royal, VA 22630 USA
Norman A. Bourg, Smithsonian Conservation Biology Institute, National Zoological Park, 1500 Remount Road, Front Royal, VA 22630 USA and 519 Elm Avenue, Apt. B, Takoma Park, MD 20912 USA (residence)
Abstract: We present data from the first five years (2008–2012) of the establishment of the 25.6 ha Smithsonian Conservation Biology Institute (SCBI) Large Forest Dynamics Plot, comprising the initial woody stem census, woody seedling plot surveys, seed rain, and dendrochronological data. The plot is in mature secondary mixed deciduous forest 5 km south of Front Royal, Virginia, USA. The initial plot census enumerated 38,932 free-standing living stems and 29,991 living individuals >1 cm DBH comprising 62 species, 38 genera and 26 families, along with an additional 1,248 dead/missing standing stems, for a total of 40,180 stems. Dominant canopy trees include tulip poplar (Liriodendron tulipifera), hickories (Carya spp.), oaks (Quercus spp.), white ash (Fraxinus americana), and black gum (Nyssa sylvatica). Prominent understory components include spicebush (Lindera benzoin), pawpaw (Asimina triloba), American hornbeam (Carpinus caroliniana), witchhazel (Hamamelis virginiana), and eastern redbud (Cercis canadensis). Few species predominate numerically on the plot; seven species have >1,000 individuals (71.3% of the total). Mean stand density was 1,179 living individuals/ha, while mean basal area was 34.1 m²/ha. Of the total plot area, 4-ha have had white-tailed deer (Odocoileus virginianus) exclusion since 1990. Woody seedling surveys from 2010–2012 in 354 1 m² plots measured 19,415 seedlings of 47 species, from new germinants up to 1 cm DBH. Community-wide seed rain data from 200 0.5 m² litterfall traps yielded a total of 9,197 records from 37 species. Long-term seed data collected from 1986–2011 for Quercus and Carya within the exclosure and two replicate sites are also presented, documenting considerable annual variation in mast production. Dendrochronological data from 492 tree cores suggested the major canopy trees established circa 1900, but scattered trees of several species existed earlier. Large-scale forest dynamics plots employing standardized methodology have a long, rich history in the tropics. Similar plots in the temperate zone have been largely lacking, however. The SCBI plot represents one of the first of its kind in the Smithsonian Global Earth Observatory’s recently established network of such plots, complementing its well-known network of tropical forest plots and enabling comparative studies on forest ecology at the global scale.
D. Key words: temperate forest, temperate trees, census, seedling dynamics, seed rain, mast production, dendrochronology, deer exclusion
Class II. Research origin descriptors
A. Overall project description
Identity: Initial census temperate forest woody plant ecology
Originators: W. J. McShea, N. A. Bourg, J. R. Thompson, J. C. McGarvey, and X. Shen
Period of Study: June 2008–Present
Objectives: This project sought to create a large temperate forest dynamics plot to serve as an important comparative complement for the global network of large tropical forest dynamics plots coordinated by the Center for Tropical Forest Science, with the purpose of enhancing the understanding of the ecological forces influencing the diversity, biomass, productivity, and structure of the Earth’s forest biome. In particular, the SCBI LFDP has a research emphasis on the global change impacts to forest communities of chronic white-tailed deer overabundance and its interactions with invasive plant species competition and ecological processes.
Abstract: This study is designed to establish the baseline census, seedling, and seed dynamics, and dendrochronology necessary to track and interpret the demography of all free-standing woody stems >1 cm DBH present in a 25.6 ha mature secondary forest in Virginia, USA broadly representative of the eastern mixed deciduous forest ecosystem. The study will be long-term, with complete recensuses conducted at 5-year intervals, so that woody plant survival, growth and performance can be related to climate, microsite, and physical variables.
Sources of funding: HSBC Climate Partnership, Smithsonian Institution Global Earth Observatory (SIGEO), Smithsonian Institution, National Zoological Park.
Background: The SCBI plot is part of an unparalleled global research network of large forest dynamics plots (LFDPs) coordinated by The Center for Tropical Forest Science (CTFS) based at the Smithsonian Tropical Research Institute (STRI). This research program began with the establishment by STRI scientists of the 50 hectare (ha) LFDP on Barro Colorado Island (BCI), Panama in 1980 and expanded as the protocol was replicated across the tropics (Manokaran 1990, Condit 1998, Hall et al. 1998, Ashton et al. 1990), eventually resulting in a network of 20 long-term plots typically 25 to 52 ha in size in tropical America, Africa, Asia, and the Caribbean. The standard census protocol undertaken at all of these sites involved surveying and gridding plots into quadrats ranging in size from 5 × 5 meters (m) to 20 × 20 m, and then identifying to species and measuring diameter at breast height (DBH) of all free-standing woody stems at least 1 cm DBH, marking them with permanent tags, and mapping them on an x.y coordinate system. These plots were then recensused at approximately 5-year intervals, with the broad goal of gaining a better understanding of the ecological mechanisms shaping the diversity, biomass, productivity, and structure of tropical forests, the most biodiverse terrestrial ecosystems on Earth (Corlett and Primack 2010). A similar plot network in the temperate zone to enable comparative global forest ecology studies was lacking, however.
Beginning in 2005, the Smithsonian Institution (SI) substantially increased the size and scope of the CTFS network. The Smithsonian Institution Global Earth Observatory (SIGEO) is the product of this effort, currently consisting of 48 LFDPs (the original 20 CTFS plots plus 28 new plots) spread across 22 countries that track over 4.5 million woody plants of 8,500 species. The SIGEO platform has expanded to include new research initiatives studying carbon fluxes, plant–animal interactions, climate change impacts on biodiversity and forest function, and perhaps most importantly, temperate forests. Thirteen of the new LFDPs are in temperate forest ecosystems, located in North America, the United Kingdom and China, creating a complementary set of such plots for comparative analyses with tropical forests around the globe. SI has directly contributed to the temperate SIGEO component via the founding of new LFDPs at two of its administrative units, one of which is the SCBI LFDP.
B. Specific subproject descriptions
II.B.1. Initial woody stem census
Site description: The study was conducted in mature secondary mixed deciduous forest on the grounds of the Smithsonian Conservation Biology Institute, approximately 5 km south of Front Royal, Virginia, USA (Fig. 1). Site and area maps, various GIS coverages, and meteorological data are available from the authors. Relevant publications are listed in section V.F. below.
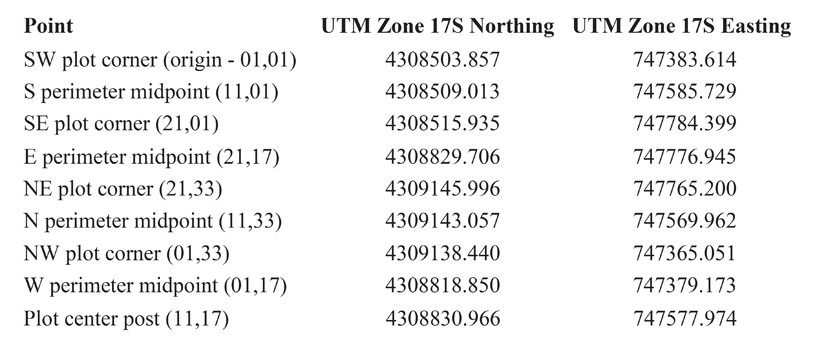
Experimental or sampling design: In 2008 the LFDP was delineated in the forested portion of the Posey Creek watershed of SCBI by choosing a starting center point and surveying the plot into 20 × 20 m quadrats, using a tripod-mounted Laser Technologies Impulse 200 LR laser rangefinder, high reflectance target, staff compass, and measuring tapes. The plot is oriented to 350° on its north-south axis and 80° on its east-west axis. Each quadrat corner was marked with a 1.27 cm (0.5 inch) diameter iron rebar painted bright blue at the top. A numbered metal tag was attached with steel wire to each rebar. The quadrat numbering system began with 01,01 in the southwest corner (origin) of the plot and continued at 20m intervals along the x-axis (east-west direction) to 400 m (rebar 21,01). Numbering along the y-axis (north-south direction) was continued similarly to 640 m (rebar 01,33). The locations of the plot center post and corners and midpoints of the plot perimeter were located with a Trimble GEOXHTM 2005 Series GPS unit with external antenna and their coordinates geo-corrected to the nearest base stations in the area (Table 1).
Table 1. Geo-corrected UTM coordinates for the perimeter and center point of the SCBI SIGEO Large Forest Dynamics Plot.
Woody stems were measured with DBH tapes, digital or manual calipers to the nearest 0.1 mm at the standard point-of-measurement (POM; i.e., diameter at breast height, DBH) of 1.3 m from ground level, using standardized height poles. If a stem was irregular or damaged at the 1.3 m height, an alternate POM was used at the nearest point where the stem became normal, and the alternate height was recorded. If a stem was on a slope, the standard POM was measured on the upslope side of the stem. Bent, leaning, or prostrate stems had the standard POM taken on the side most proximal to the ground. All stems >1cm DBH were recorded. If an individual had multiple stems, only the main stem was tagged with a metal tag, but all stems >1cm DBH were measured and recorded. Individuals were marked with uniquely numbered six digit metal tags with the first two numbers designating the plot column on the x-axis in which the stem was located. Tags were affixed with nails to individuals >8 cm DBH and with metal wire to stems <8 cm DBH. Preliminary species identifications were recorded at time of measurement and tagging, or if uncertain recorded as unknown for later identification. Stem mapping began in Spring 2009 and was performed by placing measuring tapes around the perimeter of each quadrat and across the 10 m points of each side, and then recording x,y coordinates to the nearest 0.1 m at the local 20 × 20 m quadrat scale.
The list of living study species for the LFDP woody stem census at time of measurement is provided below. The sole exception is Juniperus virginiana L., which was recorded as a single standing dead stem in the 2008 initial census and appears in the woody stem census data file as such. Referenced voucher specimens are in the National Herbarium (US) of the Department of Botany, National Museum of Natural History, Washington, DC, USA.
Species studied (family) [representative voucher specimen]:
Genus |
Species |
Authority |
Family |
Voucher |
Acer |
negundo |
Michx. |
Sapindaceae |
N.A. Bourg 09_0053 |
Acer |
platanoides |
L. |
Sapindaceae |
N.A. Bourg 09_0021 |
Acer |
rubrum |
L. |
Sapindaceae |
N.A. Bourg 09_0003 |
Ailanthus |
altissima |
(Mill.) Swingle |
Simaroubaceae |
N.A. Bourg 09_0121 |
Amelanchier |
arborea |
(Michx. f.) Fernald |
Rosaceae |
N.A. Bourg 09_0005 |
Asimina |
triloba |
(L.) Dunal |
Annonaceae |
N.A. Bourg 08_0116 |
Berberis |
thunbergii |
DC. |
Berberidaceae |
N.A. Bourg 09_0022 |
Carpinus |
caroliniana |
Walter |
Betulaceae |
N.A. Bourg 08_0105 |
Carya |
cordiformis |
(Wangenh.) K. Koch |
Juglandaceae |
N.A. Bourg 08_0064 |
Carya |
glabra |
(Mill.) Sweet |
Juglandaceae |
N.A. Bourg 08_0134 |
Carya |
ovalis |
(Wangenh.) Sarg. |
Juglandaceae |
N.A. Bourg/D.W. Rowan 09_0128 |
Carya |
tomentosa |
(Lam. ex Poir.) Nutt. |
Juglandaceae |
N.A. Bourg 08_0126 |
Castanea |
dentata |
(Marshall) Borkh. |
Fagaceae |
N.A. Bourg/D.W. Rowan 09_0118 |
Celtis |
occidentalis |
L. |
Cannabaceae |
N.A. Bourg 09_0048 |
Cercis |
canadensis |
L. |
Fabaceae |
N.A. Bourg 08_0080 |
Chionanthus |
virginicus |
L. |
Oleaceae |
N.A. Bourg 08_0056 |
Cornus |
alternifolia |
L. f. |
Cornaceae |
N.A. Bourg 08_0060 |
Cornus |
florida |
L. |
Cornaceae |
N.A. Bourg 08_0106 |
Corylus |
americana |
Walter |
Betulaceae |
N.A. Bourg 09_0132 |
Crataegus |
pruinosa |
(Wendl. f.) K. Koch |
Rosaceae |
N.A. Bourg 08_0016 |
Diospyros |
virginiana |
L. |
Ebenaceae |
N.A. Bourg 08_0007 |
Elaeagnus |
umbellata |
Thunb. |
Elaeagnaceae |
N.A. Bourg 09_0124 |
Fagus |
grandifolia |
Ehrh. |
Fagaceae |
N.A. Bourg 08_0010 |
Fraxinus |
americana |
L. |
Oleaceae |
N.A. Bourg 08_0107 |
Fraxinus |
nigra |
Marshall |
Oleaceae |
N.A. Bourg 08_0058 |
Fraxinus |
pennsylvanica |
Marshall |
Oleaceae |
N.A. Bourg 08_0104 |
Hamamelis |
virginiana |
L. |
Hamamelidaceae |
N.A. Bourg 08_0109 |
Ilex |
verticillata |
(L.) A. Gray |
Aquifoliaceae |
N.A. Bourg 09_0072 |
Juglans |
cinerea |
L. |
Juglandaceae |
N.A. Bourg 08_0101 |
Juglans |
nigra |
L. |
Juglandaceae |
N.A. Bourg 08_0125 |
Lindera |
benzoin |
(L.) Blume |
Lauraceae |
N.A. Bourg 09_0001 |
Liriodendron |
tulipifera |
L. |
Magnoliaceae |
N.A. Bourg 08_0027 |
Lonicera |
maackii |
(Rupr.) Herder |
Caprifoliaceae |
N.A. Bourg 08_0189 |
Nyssa |
sylvatica |
Marshall |
Nyssaceae |
N.A. Bourg 08_0128 |
Paulownia |
tomentosa |
(Thunb.) Steud. |
Paulowniaceae |
N.A. Bourg 08_0099 |
Pinus |
pungens |
Lamb. |
Pinaceae |
N/A |
Pinus |
strobus |
L. |
Pinaceae |
N.A. Bourg 08_0182 |
Pinus |
virginiana |
Mill. |
Pinaceae |
N/A |
Platanus |
occidentalis |
L. |
Platanaceae |
N/A |
Prunus |
avium |
(L.) L. |
Rosaceae |
N.A. Bourg 09_0011 |
Prunus |
persica |
(L.) Batsch |
Rosaceae |
N.A. Bourg 09_0119 |
Prunus |
serotina |
Ehrh. |
Rosaceae |
N.A. Bourg 08_0184 |
Quercus |
alba |
L. |
Fagaceae |
N.A. Bourg 08_0030 |
Quercus |
coccinea |
Münchh. |
Fagaceae |
N/A |
Quercus |
falcata |
Michx. |
Fagaceae |
N/A |
Quercus |
michauxii |
Nutt. |
Fagaceae |
N.A. Bourg 08_0179 |
Quercus |
muehlenbergii |
Engelm. |
Fagaceae |
N/A |
Quercus |
prinus |
L. |
Fagaceae |
N.A. Bourg 08_0133 |
Quercus |
rubra |
L. |
Fagaceae |
N.A. Bourg 09_0047 |
Quercus |
velutina |
Lam. |
Fagaceae |
N.A. Bourg 08_0017 |
Robinia |
pseudoacacia |
L. |
Fabaceae |
N/A |
Rosa |
multiflora |
Thunb. |
Rosaceae |
N.A. Bourg 08_0172 |
Rubus |
allegheniensis |
Porter |
Rosaceae |
N/A |
Rubus |
pensilvanicus |
Poir. |
Rosaceae |
N/A |
Rubus |
phoenicolasius |
Maxim. |
Rosaceae |
N.A. Bourg 08_0119 |
Sambucus |
nigra ssp. canadensis |
(L.) R. Bolli |
Adoxaceae |
N.A. Bourg 09_0130 |
Sassafras |
albidum |
(Nutt.) Nees |
Lauraceae |
N.A. Bourg 08_0169 |
Tilia |
americana |
L. |
Malvaceae |
N.A. Bourg 09_0080 |
Ulmus |
americana |
L. |
Ulmaceae |
N.A. Bourg 09_0114 |
Ulmus |
rubra |
Muhl. |
Ulmaceae |
N.A. Bourg 08_0067 |
Viburnum |
prunifolium |
L. |
Adoxaceae |
N.A. Bourg 09_0050 |
Viburnum |
recognitum |
Fernald |
Adoxaceae |
N.A. Bourg 09_0079 |
Research methods: Each stem was censused for size, species identification, life status (live/dead), location, and stem condition.
Project personnel: The Principal Investigators, Shawn Behling, Megan Baker, Sumana Serchan, Xiaoli Shen, Chris Lewis, Deborah W. Rowan, Erika Gonzalez.
II.B.2. Woody seedling plot surveys
Site description: Same as II.B.1.
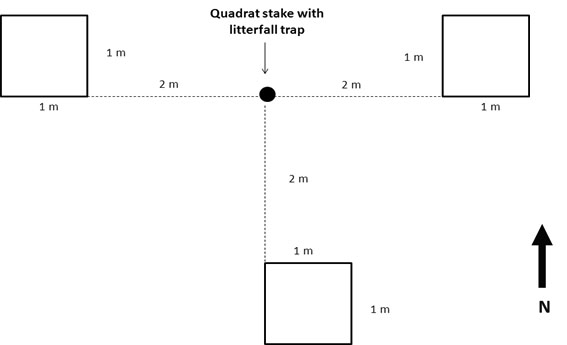
Experimental or sampling design: All woody seedlings were surveyed annually in 354 1 m² plots from 2010 to 2012. All plots were surveyed in each year, unless a plot had been washed out by flooding, which is indicated in the Notes field of the seedling datafile. Locations were centered around quadrat stakes that had litterfall traps and were randomly stratified across the plot to adequately sample the stream courses and the deer exclosure. Three 1 m² plots were installed to the south, east, and west of each stake so that approach to the plots could be from the north and unintended trampling of the plots thereby minimized (Fig. 5). The annual survey documented seedling species identity, size, relative location, and mortality. In 2010 all stems < 1 cm DBH were tagged with a numbered round metal tag, mapped, identified, measured (height in cm), and had their number of leaves recorded. In 2011, only stems >10 cm in height were tagged and mapped. In 2012 no stems were tagged; instead, all new 2012 seedlings are specified in the datafile as “New 2012.” A few tags (136) were removed (for individuals <10 cm height) if the tag had the potential to interfere with growth or health. We also removed tags from the plot when the seedling was dead and the individual was thus recorded as dead (TR, D). For future reference, x,y coordinates to the nearest centimeter were recorded for every seedling within the plots; these locational data are available upon request. Visual estimates of percent cover of leaf litter and exotic species were recorded in each plot, as well as the exotic species identity, for potential use as covariates in future analyses.
Due to a heavy rainstorm event in April 2011, a substantial number of 2010 seedling tags were lost from plots. Therefore, we decided to only tag stems >10 cm in height in the 2011 survey and record data for seedlings <10 cm height without retagging those in this size class. We made the assumption in 2011 that a new seedling would not grow to 10 cm in height in a year. Therefore, stems tagged in 2011 were either tagged in 2010 but had lost their tag prior to the resurvey or were not present in the 2010 survey. In fall 2011 we reviewed all of the plot map positions of the newly tagged seedlings to determine whether we could differentiate between these 2 groups based on seedling locations mapped in 2010. If we determined a stem was newly-tagged, we recorded “new tag-individual” in the Notes column. If we determined a stem had been previously tagged, we changed the tag number in the 2010 database to the new 2011 number.
Fig. 5. Diagram of the layout and dimensions of a seedling plot survey array.
Research methods: Each woody seedling was inventoried for size (height in cm and number of leaves), species identification, life status (live/dead), and location. Type and percentage of leaf litter and exotic species ground cover in each seedling plot were also recorded.
Project personnel: The Principal Investigators, Xiaoli Shen, Jennifer C. McGarvey, Chris Lewis, Erika Gonzalez
II.B.3. Seed rain collections
Site description: Same as II.B.1.
Experimental or sampling design: In April 2009, two hundred (200) 0.5 m² (0.71 × 0.71 m) above-ground litterfall traps were installed at quadrat stake locations distributed in a randomly stratified manner across the plot. Traps were constructed and installed according to the CTFS protocol developed by Muller-Landau and Wright (2010). Fruits and seeds were collected biweekly into paper bags from the traps, identified to species whenever possible, counted and classified into one of four abundances classes (1 = 1 fruit or seed, 2 = 2-5; 3 = 6-20; 4 = > 20). Two heavy snowfall events during the winter of 2009–2010, one in mid-December and another in early February, with sustained sub-freezing temperatures throughout this period, prevented the collection of litterfall from traps between 31 December 2009 and 5 April 2010. In the subsequent winter of 2010–2011, we only performed monthly collections of the litterfall traps from December to April.
Research methods: All fruits and seeds present in the dried litterfall material from each trap were separated out, identified to species whenever possible, counted and placed into an abundance category.
Project personnel: The Principal Investigators, Shawn Behling, Megan Baker, Sumana Serchan, Xiaoli Shen, J.C. McGarvey, Robin Williams, Chris Lewis
II.B.4. Quercus and Carya long-term seed collections
Site description: Same as II.B.1.
Experimental or sampling design:
Quercus and Carya seed production was measured with 50 wire mesh funnels placed at regular intervals across the 4 ha deer exclosure. Each triangular funnel (89 × 89 × 89 cm) was attached to a stake with its collecting area level and checked at 2–4 week intervals from August through November. All seeds were removed, dried, and weighed to the nearest gram (g). Seed production for each genus is presented as kg/ha based on the collecting surface across the 4 ha area. We also present mast data from 1986 through 2011 that was collected with the same protocol from two other sites within SCBI (Bear and North grids, Fig. 1A). Both sites are in forest of similar age and composition and are located 1800 and 3010 m, respectively, from the primary plot.
Research methods: All Quercus and Carya seeds were collected from funnel traps at biweekly to monthly intervals, dried, and each genus weighed (without caps for acorns or seed coats for hickory nuts) to the nearest g.
Project personnel: W. J. McShea
II.B.5. Dendrochronological sampling
Site description: Same as II.B.1.
Experimental or sampling design: In the summer of 2010 increment cores were extracted from 492 trees (one core per tree) to analyze patterns of radial growth and determine tree ages. We were motivated, in part, by the question: Does the abundant understory vegetation within the deer exclosure affect water availability, and thus the growth of overstory trees? Given this question, we took a random sample of trees from species that represent a gradient of drought tolerance, stratified inside and outside the deer exclosure. [Incidentally, we found no meaningful differences in basal area increment growth in overstory trees (McGarvey et al. 2013).] To avoid damaging small trees, we restricted our sample to stems > 10 cm DBH. Here we present data from the seven species whose cores were successfully cross-dated (Table 2). Stem-level information on cross-dating (i.e., COFECHA output) is available from the authors upon request.
Table 2. Tree species used for radial growth analysis, their sample size (N), average age (years), the standard deviation of the age (years), the maximum age (years) and their interseries correlation indicating dating quality of the species’ chronologies.
Species |
N |
Average Age |
SD |
Max Age |
Interseries correlation |
Fagus grandifolia |
90 |
54 |
18 |
122 |
0.344 |
Liriodendron tulpifera |
84 |
73 |
20 |
140 |
0.395 |
Quercus prinus |
81 |
91 |
32 |
233 |
0.379 |
Quercus alba |
67 |
119 |
39 |
276 |
0.288 |
Quercus rubra |
67 |
82 |
21 |
134 |
0.468 |
Quercus velutina |
68 |
85 |
20 |
186 |
0.515 |
Pinus strobus |
35 |
63 |
11 |
81 |
0.390 |
Research methods: We extracted increment cores at 1.37 m height, on the mid-slope side of the trees. We air dried, mounted and sanded all cores in the lab. We then measured age growth increments to the nearest 0.001 mm using a uni-slide tree ring measuring device (Velmex, Inc., East Bloomfield, NY) and Wild M8 stereozoom microscope and recorded the increment widths using a Quick-Chek 1000 microcomputer (Automation and Metrology, Inc., Painesville, OH) and MeasureJ2X software (VoorTech Consulting, Holderness, NH). Raw ring widths were cross-dated by comparing shared narrow rings (Yamaguchi 1991) and confirmed using the dplR package (Bunn 2008, 2010), within the R statistical software.
Project personnel: J. R. Thompson, J. C. McGarvey, and C. Lewis
Class III. Data set status and accessibility
A. Status
Latest update: 2012
Latest Archive date: 2012
Metadata status:Metadata are complete for this period and are stored with the data (see B. below).
Data verification:Woody stem species and DBH values were checked to ensure plausibility and identify out-of-bounds values for subsequent correction. Identifications of all individuals belonging to difficult to distinguish species groups, (i.e., Carya glabra, C. ovalis, C. tomentosa and C. cordiformis; Fraxinus americana and F. pennsylvanica; and Ulmus rubra and U. americana) were double-checked in the field by N.A. Bourg, Chris Lewis, and Deb Rowan. Additionally, some quadrats were randomly selected for verifications by N.A. Bourg and Chris Lewis, and field datasheets were occasionally checked against entered data by Shawn Behling, Sumana Serchan, X. Shen, and N.A. Bourg.
B. Accessibility
Storage location and medium:All digital data and metadata are updated periodically and stored on desktop computer hard drives and backup servers at the SCBI, and on N.A. Bourg’s computer and backup drive. Original field data sheets are stored at the SCBI. In addition, a copy of the 2012 woody stem plot census data file is archived at the CTFS plot web site and can be accessed by submitting the request form available here: http://ctfs.arnarb.harvard.edu/Public/plotdataaccess.
Contact persons:
William J. McShea, Smithsonian Conservation Biology Institute, National Zoological Park, 1500 Remount Road, Front Royal, VA 22630 USA. Email: [email protected]
Norman A. Bourg, Smithsonian Conservation Biology Institute, National Zoological Park, 1500 Remount Road, Front Royal, VA 22630 USA and 519 Elm Avenue, Apt. B, Takoma Park, MD 20912 USA (residence). E-mail: [email protected] / [email protected]
Jonathan R. Thompson, Smithsonian Conservation Biology Institute, National Zoological Park, 1500 Remount Road, Front Royal, VA 22630 USA. E-mail: [email protected]
Copyright restrictions:None. The authors believe scientific data should be freely available for scientific use.
Proprietary restrictions: The Principal Investigators of the SCBI-LFDP seek to promote scientific study and exploration in the field of forest ecology and global change science. These data are the result of a large investment of human and financial resources and are freely available for non-commercial scientific use. We encourage researchers to contact us with ideas and proposals for collaborative research projects that utilize these data.
Citation and Acknowledgements: Investigators should cite this paper if any of its data are used in publications, and include an acknowledgment in oral presentations and publications of the support of the primary institutions and granting agencies that have provided substantial funding for the SCBI-LFDP. A suggested acknowledgment is:
Funding for the Smithsonian Conservation Biology Institute (SCBI) Large Forest Dynamics Plot (LFDP) was provided by the Smithsonian Institution, the National Zoological Park, and the HSBC Climate Partnership. The SCBI LFDP is part of the Smithsonian Institution Global Earth Observatory, a global network of large, long-term forest dynamics plots.
Publication: Prospective investigators should provide each of the SCBI PIs and CTFS-SIGEO with a copy of any publication resulting from their research project.
Costs: None. The authors believe scientific data should be freely available for scientific use.
Class IV. Data structural descriptors
A. Data Set File
Identity: Data set is downloadable as a single archive, SCBI_woody plants_2008_2012.zip. This file contains 5 data files as detailed below, each in comma separated values (.csv) format.
IV.A.1. Data file name: SCBI_initial_woody_stem_census_2012.csv
Data description: The woody stem data file contains an initial header row and 40,180 records. Each record represents the complete data for one stem in the 2008 census. Species code, Latin species name, quadrat location, locational (x, y) coordinates, unique tree identification number, metal tag number, stem identification number, census number, DBH in millimeters, height of measurement in meters, date of measurement, stem codes, stem type, and stem status for all woody stems are given. Variable descriptions are given in section B.1. below.
Header information: Column order in data table ascends (left to right) A–Q.
Column Letter Order |
Variable Name |
Variable definition |
Storage Type |
Range of Numeric Values (-999 not included) |
Missing Value Codes |
A |
Plot |
SIGEO plot acronym |
Character |
N/A |
N/A |
B |
Spcode |
3 – 5 letter species codes |
Character |
N/A |
N/A |
C |
Latin |
Latin genus and species name for species |
Character |
N/A |
N/A |
D |
Quadrat |
Combined quadrat x and y coordinate designation |
Character |
N/A |
N/A |
F |
gx |
Global x coordinate from the plot origin (southwest corner of plot) in meters |
Numeric |
0 – 400 |
N/A |
G |
gy |
Global y coordinate from the plot origin (southwest corner of plot) in meters |
Numeric |
0 – 640 |
N/A |
H |
TreeID |
Unique tree/shrub identifier |
Integer |
N/A |
N/A |
I |
Tag |
Individual metal tag identifier from the field |
Character |
N/A |
N/A |
J |
StemID |
Unique stem identifier, relative to its Tag or TreeID identifier |
Integer |
1–22 |
N/A |
K |
Census |
Number of the plot census |
Integer |
1 |
N/A |
L |
DBH |
Diameter of one stem on the tree/shrub, the stem whose StemID is given, in millimeters |
Numeric |
10.0–1,511.4 |
-999 |
M |
HOM |
The height of measurement, where the diameter was taken, in meters |
Numeric |
0.2–3.5 |
-999 |
N |
Date |
The date of measurement |
Character |
N/A |
N/A |
O |
Codes |
The codes for the measurement and stem as recorded in the field |
Character |
N/A |
N/A |
P |
Stem |
The type of stem as recorded in the field |
Character |
N/A |
N/A |
Q |
Status |
The status of the stem as recorded in the field |
Character |
N/A |
N/A |
IV.A.2. Data file name: Woody_seedlings_2010_2012.csv
Data description: The seedling data file contains an initial header row and 19,415 records. Each record represents the complete data for one individual for a given year. Census date, species code, quadrat stake location, plot location, tag number, height in cm, number of leaves, percent litter cover, percent exotic species cover, exotic species code, occurrence relative to deer exclosure (in/out), and notes are given. Variable descriptions are given in section B.2. below.
Header information: Column order in data table ascends (left to right) A–L.
Column Letter Order |
Variable Name |
Variable definition |
Storage Type |
Range of Numeric Values (-999 not included) |
Missing Value Codes |
A |
Date |
Date plot census was taken |
Character |
N/A |
N/A |
B |
SpCode |
3–5 letter species codes |
Character |
N/A |
N/A |
C |
Quad_stake |
Combined quadrat stake x and y coordinate designation |
Character |
N/A |
N/A |
D |
Plot |
Seedling plot designation in the seedling plot array, as indicated by cardinal direction |
Character |
N/A |
N/A |
E |
Tag |
Individual metal tag identifier from the field |
Character |
N/A |
N/A |
F |
Height_cm |
Height of individual in centimeters |
Numeric |
0–669 |
-999 |
G |
Leaves_num |
Number of leaves |
Numeric |
0 - >50 |
-999 |
H |
L_pct |
Percent cover of litter |
Numeric |
0-100 |
N/A |
I |
E_pct |
Percent cover of exotic species |
Numeric |
0-100 |
N/A |
J |
ExSp |
Exotic species code |
Character |
N/A |
NA |
K |
Fence |
Plot inside or outside deer exclosure fence |
Character |
N/A |
N/A |
L |
Notes |
Field notes |
Character |
N/A |
None |
IV.A.3. Data file name: Seed_rain_2009_2011.csv
Data description: The seed rain data file contains an initial header row and 9,197 records. Each record represents the seeds or fruits collected by species and their rank abundance from a given litterfall trap for a given collection date. Litterfall trap location coordinates along the x and y axes, fruit/seed collection date, species code for each type of fruit/seed collected along with fruit or seed identifying designation, and rank abundance category for each species of fruit/seed collected are given. Variable descriptions are given in section B.3. below. Two hundred litterfall traps were always in place at the beginning of each sampling period. Missing data from individual litterfall traps for a specific collection period indicates the collector was damaged, usually by weather, treefall, or black bears (Ursus americanus), and any records from these were excluded until the traps were repaired.
Header information: Column order in data table ascends (left to right) A–P.
Column Letter Order |
Variable Name |
Variable definition |
Storage Type |
Range of Numeric Values (-999 not included) |
Missing Value Codes |
A |
Column |
X quadrat stake designation |
Character |
N/A |
N/A |
B |
Row |
Y quadrat stake designation |
Character |
N/A |
N/A |
C |
Trap |
Litterfall trap identifier, consisting of combined quadrat stake x and y coordinate designation |
Character |
N/A |
N/A |
D |
Date |
Date fruits /seeds were collected |
Character |
N/A |
N/A |
E |
Sp1 |
Species code with fruit /seed code |
Character |
N/A |
N/A |
F |
Sp1_num |
Rank abundance category of fruits /seeds collected |
Numeric |
1-4 |
-999 |
G |
Sp2 |
Species code with fruit /seed code |
Character |
N/A |
N/A |
H |
Sp2_num |
Rank abundance category of fruits /seeds collected |
Numeric |
1-4 |
-999 |
I |
Sp3 |
Species code with fruit /seed code |
Character |
N/A |
N/A |
J |
Sp3_num |
Rank abundance category of fruits /seeds collected |
Numeric |
1-4 |
-999 |
K |
Sp4 |
Species code with fruit /seed code |
Character |
N/A |
N/A |
L |
Sp4_num |
Rank abundance category of fruits /seeds collected |
Numeric |
1-4 |
-999 |
M |
Sp5 |
Species code with fruit /seed code |
Character |
N/A |
N/A |
N |
Sp5_num |
Rank abundance category of fruits /seeds collected |
Numeric |
1-4 |
-999 |
O |
Sp6 |
Species code with fruit /seed code |
Character |
N/A |
N/A |
P |
Sp6_num |
Rank abundance category of fruits /seeds collected |
Numeric |
1–4 |
-999 |
IV.A.4. Data file name: SCBI_oak_hickory_seeds_1986_2011.csv
Data description: The estimated seed production for Quercus and Carya seeds within a 4 ha section of the plot from 1986 through 2011. The estimate is for dried weight of seeds (caps removed for Quercus; seed coat removed for Carya) collected from August through November annually at 50 seed collectors evenly spaced across the subplot. The estimate is expressed as kg/ha.
Header information: Column order in data table ascends (left to right) A–C.
Column Letter Order |
Variable Name |
Variable definition |
Storage Type |
Range of Numeric Values (-999 not included) |
Missing Value Codes |
A |
Site |
The field site on the SCBI of mast collection |
Character |
N/A |
N/A |
B |
Year |
Year of mast collection |
Character |
N/A |
N/A |
C |
Quercus_kg_ha |
The estimated mast production for oaks, converted to kilograms/hectare |
Numeric |
1–666 |
-999 |
D |
Carya_kg_ha |
The estimated mast production for hickories, converted to kilograms/hectare |
Numeric |
0–261 |
-999 |
IV.A.5. Data file name: raw_SIGEO_2010_ALL_tringwidths.csv
Data description: This data file contains tree-ring widths for 492 trees. The data were formatted into the Tucson or decadal format, one of the most common formats of storing tree ring data. The measurements are in units of 0.001 mm of the thickness of tree ring. We have simply replaced the “.raw” file extension produced by the MeasureJ2X software with the more common “.csv” file extension to facilitate use by a broader group of scientists. Column A contains the metal tag number for a given tree, which can be joined to the main woody stem file SCBI_initial_woody_stem_census_2012.csv . Column B is the species code for the sampled tree, and Column C is its DBH in millimeters. Column D indicates the decade for that row. The ten columns following the decade (columns E:N) are the ten annual measurements for the ten years of that decade.
Header information: Column order in data table ascends (left to right) A–N.
Column Letter Order |
Variable Name |
Variable definition |
Storage Type |
Range of Numeric Values in micrometers (-999 not included) |
Missing Value Codes |
A |
Tag |
Individual metal tag identifier from the field |
Character |
N/A |
N/A |
B |
spcode |
Species code of tree |
Character |
N/A |
N/A |
C |
DBH_mm |
Diameter at 1.37m height of the sampled tree, in millimeters |
Numeric |
17.4–1030.4 |
N/A |
D |
Year |
Year of ring growth |
Numeric |
1734–2010 |
N/A |
E |
RW1 |
Ring width in micrometers |
Numeric |
0–8875 |
-999 |
F |
RW2 |
Ring width in micrometers |
Numeric |
1–15794 |
-999 |
G |
RW3 |
Ring width in micrometers |
Numeric |
0-6756 |
-999 |
H |
RW4 |
Ring width in micrometers |
Numeric |
22-6010 |
-999 |
I |
RW5 |
Ring width in micrometers |
Numeric |
15-5566 |
-999 |
J |
RW6 |
Ring width in micrometers |
Numeric |
20–6568 |
-999 |
K |
RW7 |
Ring width in micrometers |
Numeric |
0–5257 |
-999 |
L |
RW8 |
Ring width in micrometers |
Numeric |
0–5280 |
-999 |
M |
RW9 |
Ring width in micrometers |
Numeric |
0–6241 |
-999 |
N |
RW10 |
Ring width in micrometers |
Numeric |
0–44323 |
-999 |
Format and storage mode:Comma separated values (.csv) files. No compression schemes used.
IV. B. Variable descriptions
Variable descriptions are given for those variables needing additional explanation beyond that provided in their respective data tables in section IV.A.
IV.B.1. Woody stem census, 2008. (file IV.A.1. Data file name:
SCBI_initial_woody_stem_census_2012.csv).
a. Species code. acne - Acer negundo Michx.; *acpl – Acer platanoides L.; acru – Acer rubrum L.; acsp – Acer sp. L.; *aial – Ailanthus altissima (Mill.) Swingle; amar – Amelanchier arborea (Michx. f.) Fernald; astr – Asimina triloba (L.) Dunal; *beth – Berberis thunbergii DC.; caca – Carpinus caroliniana Walter; caco – Carya cordiformis (Wangenh.) K. Koch; cade – Castanea dentata (Marshall) Borkh.; cagl – Carya glabra (Mill.) Sweet; caovl – Carya ovalis (Wangenh.) Sarg.; casp – Carya sp. Nutt.; cato – Carya tomentosa Nutt.; ceca – Cercis canadensis L.; ceoc – Celtis occidentalis L.; chvi – Chionanthus virginicus L.; coal – Cornus alternifolia L. f.; coam – Corylus americana Walter; cofl – Cornus florida L.; crpr – Crataegus pruinosa (Wendl. f.) K. Koch; crsp – Crataegus sp. L.; divi – Diospyros virginiana L.; *elum – Elaeagnus umbellata Thunb.; fagr – Fagus grandifolia Ehrh.; fram – Fraxinus americana L.; frni – Fraxinus nigra Marshall; frpe – Fraxinus pennsylvanica Marshall; frsp – Fraxinus sp. L.; havi – Hamamelis virginiana L.; ilve – Ilex verticillata (L.) A. Gray; juci – Juglans cinerea L.; juni – Juglans nigra L.; juvi – Juniperus virginiana L.; libe – Lindera benzoin (L.) Blume; litu – Liriodendron tulipifera L.; *loma – Lonicera maackii (Rupr.) Herder; nysy – Nyssa sylvatica Marshall; *pato – Paulownia tomentosa (Thunb.) Steud.; pipu – Pinus pungens Lamb.; pist – Pinus strobus L.; pivi – Pinus virginiana Mill.; ploc – Platanus occidentalis L.; *prav – Prunus avium (L.) L.; *prpe – Prunus persica (L.) Batsch; prse – Prunus serotina Ehrh.; qual – Quercus alba L.; quco – Quercus coccinea Munchh.; qufa – Quercus falcata Michx.; qumi – Quercus michauxii Nutt.; qumu – Quercus muehlenbergii Engelm.; qupr – Quercus prinus L.; quru – Quercus rubra L.; qusp – Quercus sp. L.; quve – Quercus velutina Lam.; *romu – Rosa multiflora Thunb.; rops – Robinia pseudoacacia L.; rual – Rubus allegheniensis Porter; rupe – Rubus pensilvanicus Poir.; *ruph – Rubus phoenicolasius Maxim.; saal – Sassafras albidum (Nutt.) Nees; saca – Sambucus nigra ssp. canadensis (L.) R. Bolli; tiam – Tilia americana L.; ulam – Ulmus americana L.; ulru – Ulmus rubra Muhl.; ulsp – Ulmus sp. L.; unk – Unidentified unkown; vipr – Viburnum prunifolium L.; vire – Viburnum recognitum Fernald.
* - Asterisk indicates an exotic species.
b. Quadrat. This value is the combined 20 m increment quadrat x and y coordinate designation, with the first one or two digits representing the quadrat number along the x-axis (ranging from 1 – 20) and the last two digits representing the quadrat number along the y-axis (ranging from 01 – 32). The numbering begins from the southwest corner of the plot, with the first quadrat designated ‘101’. The x-axis length is 400 m, and the y-axis length is 640 m.
c. gx. This value is the global x coordinate of a given woody stem as measured from the southwest corner (origin, 0 meters) of the plot. It is the distance in meters along the x-axis of the stem from the origin, and ranges from 0 – 400 m.
d. gy. This value is the global y coordinate of a given woody stem as measured from the southwest corner (origin, 0 meters) of the plot. It is the distance in meters along the y-axis of the stem from the origin, and ranges from 0 – 640 m.
e. TreeID. This value is a unique tree or shrub identifier integer assigned to a given woody individual after the data were entered into a datafile. If the individual has multiple stems, the same integer is assigned to each of its stems.
f. Tag. This value is the individual metal tag identifier from the field, with the last four digits indicating the woody individual’s unique tag number and the first one or two digits indicating the quadrat column along the x-axis in which the individual is located (ranges from 1 – 20). If the individual has multiple stems, the same number is used for each of its stems.
g. StemID. This value is the stem identifier number. This value is not unique, but rather is relative to the stem’s TreeID or Tag identifier.
h. DBH. This value is the diameter of a stem as measured in the field, in millimeters.
i. HOM. This value is the height of diameter measurement in meters. The default HOM for our measurements was 1.3 m, the diameter-at-breast-height (DBH), as measured from the forest floor. If the measured stem was on a slope, the HOM was measured on the upslope side of the stem. If the stem was bent, leaning or prostrate, the HOM was measured along the stem surface that was closest to the forest floor. If a stem was damaged, swollen, or irregularly shaped in a substantial way at 1.3 m, the HOM measurement was taken at the most proximal point away from 1.3 m where the stem became normal again, and this alternate HOM was recorded in the field.
j. Codes. A - alternate HOM; B - stem broken above breast height; C – stem dead above breast height; D – stem dead; F – stem incorporated into deer exclosure fence; G - identification to Genus certain; I - stem irregular where measured; J – stem bent; L – stem leaning; M – multiple stems; P – stem prostrate; Q - identification uncertain; S – secondary stem, smaller than the largest stem of a multi-stemmed individual; Z - stem fractured, splintered or otherwise damaged below breast height; lost – stem lost.
k. Stem. The type of stem as recorded in the field, consisting of one of two types: main (the sole or largest stem of an individual) and secondary (a smaller stem of a multi-stemmed individual, or a stem branch that was at least 1 cm DBH at the HOM).
l. Status. The status of the stem as recorded in the field, consisting of one of four types: alive, dead, lost stem, or missing. ‘Alive’ and ‘dead’ refer to the entire individual, so if any stem is alive, the tree is alive, and a tree is only dead when every stem is dead. Status = 'Lost stem' indicates that the stem had the associated code; it usually means the stem was broken in the census, while the tree had no other stem. Status = 'missing' are cases where dbh and codes for a tree were not given initially, and the stem could not be relocated subsequently, so it is not certain whether the tree was alive or dead.
IV.B.2. Woody seedling surveys, 2010 – 2012. (file IV.A.2. Data file name:
Woody_seedlings_2010_2012.csv).
a. Species code. In addition to the species codes listed for the woody stem census in section IV.B.1. above, the following additional codes and species were recorded in the woody seedlings surveys: *ceor – Celastrus orbiculatus Thunb.; cesp – Celtis species L.; consp – conifer species; corsp – Cornus species L.; *loja – Lonicera japonica Thunb.; paqu - Parthenocissus quinquefolia (L.) Planch.; pisp – Pinus species L.; prsp – Prunus species L.; ruoc – Rubus occidentalis L.; rusp – Rubus species L.; smgl – Smilax glauca Walter; smro – Smilax rotundifolia L.; smsp – Smilax species L.; syor – Symphoricarpos orbiculatus Moench; tora – Toxicodendron radicans (L.) Kuntze; vapa – Vaccinium pallidum Aiton; vibsp – Viburnum species L.; vitis – Vitis species L. Also, the code ‘None’ was used when no woody seedlings were present in the plot or the plot was washed out by high creek waters.
* - Asterisk indicates an exotic species.
b. Quad stake. This value is the combined 20-meter increment quadrat stake x and y coordinate designation that is the central point of a given seedling plot array, with the first one or two digits representing the quadrat stake number along the x-axis (ranging from 1 – 20) and the last two digits representing the quadrat stake number along the y-axis (ranging from 01 – 32). The numbering begins from the southwest corner of the plot, with that corner quadrat stake designated ‘101’. The x-axis length is 400 m, and the y-axis length is 640 m.
c. Plot. The cardinal direction designation of a given seedling plot in its seedling plot array, which can be east, south, or west.
d. Tag. This value is the individual metal tag identifier from the field. In 2011, we re-used old tags that were recovered from seedlings that had died by stamping a “-00” onto each of them.
e. Height_cm. This value is the height in centimeters measured from the forest floor along the main stem to the apical meristem. If branches are present, these are gently gathered together, and height is then measured to the apical meristem on the longest branch.
f. Leaves_num. The total number of leaves on the seedling. If the plant had more than 50 leaves, ‘>50’ was recorded. ‘NA’ was recorded if the plot had no woody seedlings, the plot was washed out by high creek waters, or if the seedling was dead.
g. L_pct. This value is a visual estimate of the percent cover of forest litter in the given seedling plot, ranging from 0 – 100%.
h. E_pct. This value is a visual estimate of the percent cover of exotic plant species in the given seedling plot, ranging from 0 – 100%.
i. ExSp. This is the species code for the identity of the exotic plant species found in the given seedling plot. The exotic species and their codes recorded in the seedling plot surveys, in addition to those already listed in the woody stem census in section IV.B.1. above and the species code subsection of this section, are as follows: alpe - Alliaria petiolata (M. Bieb.) Cavara & Grande; mivi - Microstegium vimineum (Trin.) A. Camus; na – not applicable; pepe - Persicaria perfoliata (L.) H. Gross.
IV.B.3. Seed rain collections, 2009 – 2011. (file IV.A.3. Data file name:
Seed_rain_2009_2011.csv).
a. Trap. This value is the combined 20-meter increment quadrat stake x and y coordinate designation at which a given litterfall trap is located, with the first one or two digits representing the quadrat stake number along the x-axis (ranging from 1 – 20) and the last two digits representing the quadrat stake number along the y-axis (ranging from 01 – 32). The numbering begins from the southwest corner of the plot, with that corner quadrat stake designated ‘101’. The x-axis length is 400 m, and the y-axis length is 640 m.
b. Sp1. This is the species code for an identified fruit or seed, as defined in the species code subsections of sections IV.B.1. and IV.B.2. above, with either a ‘FR’ appended to it to indicate a fruit or a ‘S’ appended to it to indicate a seed. The same relative description applies to variables Sp2 through Sp6.
c. Sp1_num. This value is the rank abundance of the fruit or seed species recorded in the Sp1 column, and comprises the following four categories: 1 = 1 fruit or seed; 2 = 2 to 5 fruits or seeds; 3 = 6–20 fruits or seeds; and 4 = 21 or more fruits or seeds. The same rank abundance categories apply to variables Sp2_num through Sp6_num.
IV.B.4. Oak/hickory seed collections, 1986 – 2011. (file IV.A.4. Data file name:
Oak_hickory_seeds_1986_2011.csv).
a. Site. This is the field site on the SCBI of seed collection, and is comprised of three locations: Posey_SIGEO (the 4 ha trap grid within the SCBI SIGEO plot in the Posey Creek watershed); Bear_SCBI (the 4 ha trap grid in the Bear Creek watershed of the SCBI); and North_SCBI (the 4 ha trap grid in the North forest block of the SCBI) (Fig. 1A large inset).
b. Quercus_kg_ha. The estimated annual mast production for oaks on a given 4 ha trapping grid, converted to kg/ha.
c. Carya_kg_ha. The estimated annual mast production for hickories on a given 4 ha trapping grid, converted to kg/ha.
IV.B.5. Dendrochronological data, 2010. (file IV.A.5. Data file name:
raw_SIGEO_2010_ALL_tringwidths.csv).
a. Tag. This value is the individual metal tag identifier from the field, and is the same for a given tree as the tag numbers in the woody stem census data file in section IV.B.1. above.
b. Year. This indicates the decadal year of tree growth for a given individual.
c. Spcode. This is the species code for a given individual, as defined in section IV.B.1.a.
d. DBH_mm. This value is the diameter of an individual at 1.37m height as measured in the field, in millimeters.
e. RW1 through RW10. These values are the annual ring width measurements, measured to the nearest 0.001 mm of the thickness of the tree ring.
Class V. Supplemental descriptors
A. Data acquisition
Data forms: N/A.
Location of completed data forms: The completed field data forms are stored at the SCBI in the Ecology office and annex.
B. Quality assurance/quality control procedures: See section III.A. (Data verification) above.
C. Related material: N/A.
D. Computer programs and data processing algorithms: N/A.
E. Archiving: All digital data and metadata are updated periodically and stored on desktop computer hard drives and backup servers at the SCBI. In addition, the 2012 initial woody stem plot census data file is archived at the CTFS plot website and can be obtained by submitting the request form available here: http://ctfs.arnarb.harvard.edu/Public/plotdataaccess.
F. Publications and results to date:
Chisholm, R.A., H.C. Muller-Landau, K.A. Rahman, D.P. Bebber, Y. Bin, S.A. Bohlman, N.A.
Bourg, J. Brinks, S. Bunyavejchewin, N. Butt, H. Cao, M. Cao, D. Cárdenas, L-W. Chang, J-M. Chiang, G. Chuyong, R. Condit, H.S. Dattaraja, S. Davies, A. Duque, C. Fletcher, N. Gunatilleke, S. Gunatilleke, Z. Hao, R.D. Harrison, R. Howe, C-F. Hsieh, S.P. Hubbell, A. Itoh, D. Kenfack, S. Kiratiprayoon, A.J. Larson, J. Lian, D. Lin, H. Liu, J.A. Lutz, K. Ma, Y. Malhi, S. McMahon, W. McShea, M. Meegaskumbura, S.M. Razman, M.D. Morecroft, C.J. Nytch, A. Oliveira, G.G. Parker, S. Pulla, R. Punchi-Manage, H. Romero-Saltos, W. Sang, J. Schurman, S-H. Su, R. Sukumar, I-F. Sun, H.S. Suresh, S. Tan, D. Thomas, S. Thomas, J. Thompson, R. Valencia, A. Wolf, S. Yap, W. Ye, Z. Yuan, and J.K. Zimmerman. 2013. Scale-dependent relationships between tree species richness and ecosystem function in forests. Journal of Ecology 101(5): 1214-1224.
Fletcher, J. D., W. J. McShea, L. A. Shipley, and D. Shumway. 2001. Use of common forest forbs to measure browsing pressure by white-tailed deer (Odocoileus virginianus Zimmerman) in Virginia, USA. Natural Areas Journal 21:172–176.
Heckel, C. D., N. A. Bourg, W. J. McShea, and S. Kalisz. 2010. Nonconsumptive effects of a generalist ungulate herbivore drive decline of unpalatable forest herbs. Ecology 91:319–326.
Leimgruber, P., W. J. McShea, and J. H. Rappole. 1994. Predation on artificial nests in large forest blocks. Journal of Wildlife Management 58:255–261.
McGarvey, J. C., N. A. Bourg, J. R. Thompson, W. J. McShea, X. Shen. 2013. Effects of twenty years of deer exclusion on woody vegetation at three life-history stages in a Mid-Atlantic temperate deciduous forest. Northeastern Naturalist 20(3):451–468.
McShea, W. J. 2000. The influence of acorn crops on annual variation in rodent and bird populations. Ecology 81:228–238.
McShea, W. J., and A. B. Gilles. 1992. A comparison of traps and fluorescent powder to describe foraging for mast by Peromyscus leucopus. Journal of Mammalogy 73:218–222.
McShea, W. J., and J. H. Rappole. 1992. White-tailed deer as keystone species within forest habitats of Virginia. Virginia Journal of Science 43:177–186.
McShea, W. J., and J. H. Rappole. 2000. Managing the abundance and diversity of breeding bird populations through manipulation of deer populations. Conservation Biology 14:1161–1170.
McShea, W. J., and G. Schwede. 1993. Variable acorn crops, and the response of white-tailed deer and other mast consumers. Journal of Mammalogy 74:999–1006.
McShea, W. J., M. V. McDonald, E. S. Morton, R. Meier, and J. H. Rappole. 1995. Long-term trends in habitat selection by Kentucky Warblers. The Auk 112:375–381.
McShea, W. J., W. M. Healy, P. Devers, T. Fearer, F. H. Koch, D. Stauffer, and J. Waldon. 2007. Forestry Matters: Decline of oaks will impact wildlife in hardwood forests. Journal of Wildlife Management 71:1717–1728.
Smallwood, P. D., M. A. Steele, E. Ribbens, and W. J. McShea. 1998. Detecting the effects of seed hoarders on the distribution of tree species: grey squirrels (Sciurus carolinensis) and oaks (Quercus spp.) as a model system. Pages 250–272 in M. A. Steele, J. E. Merritt, and D. A. Zegers, editors. Ecology and Evolutionary Biology of Tree Squirrels. Virginia Museum of Natural History Press.
Swenson, N. G., D. L. Erickson, X. Mi, N. A. Bourg, J. Forero-Montaña, X. Ge, R. Howe, J. K. Lake, X. Liu, K. Ma, N. Pei, J. Thompson, M. Uriarte, A. Wolf, S. Joseph Wright, W. Ye, J. Zhang, J. K. Zimmerman, and W. John Kress. 2012. Phylogenetic and functional alpha and beta diversity in temperate and tropical tree communities. Ecology 93(6) Supplement:S112–S125.
Vega Rivera, J. H., W. J. McShea, and J. H. Rappole. 2003. Comparison of breeding and post-breeding movements and habitat requirements for the scarlet tanager. The Auk 120:632–644.
G. History of data set usage: see F. above
H. Data set update history: The woody stem census data set is updated at 5-year intervals, and a recensus of the plot is scheduled for the 2013 field season. The mast production dataset is updated annually. These projects are ongoing and planned to continue indefinitely.
Review history: N/A.
Questions and comments from secondary users: The data are currently being employed in five manuscripts that are in various stages of revision, submission, or preparation for peer-reviewed publication.
Acknowledgments
Funding for the establishment of the SCBI SIGEO Large Forest Dynamics Plot was provided by the Smithsonian Global Earth Observatory (SIGEO) initiative, the Smithsonian Institution, and the HSBC Climate Partnership. We especially thank the numerous technicians, interns, and volunteers of the Conservation Ecology Center at the SCBI who were essential in assisting with plot establishment and data collection, most notably Shawn Behling, Megan Baker, Sumana Serchan, Chris Lewis, Robin Williams, Deb Rowan, Jake Barbee, Lawrence Barringer, Ryan Bechtel, Hannah Bement, Leah Card, Adam Carter, Angela Chongpinitchai, Conner Fitzhugh, Sean Gagnon, Julie Golla, Matt Hatfield, Molly Hokkanen, Allie Hunter, Hu Jing, Caroline Johnson, Christi Kruse, Lorien Lemmon, Karen Lovely, Steve Paris, Amanda Powell, Laurel Young, and Lulu Zhang. Special thanks to Erika Gonzalez and Caity Homan for their work on datafile compilation and figure preparation respectively. We also thank Stuart Davies and Sean McMahon for their advice on the paper. Support for the original exclosure fence installation was provided by the Friends of the National Zoo and Earthwatch Foundation.
Literature cited
Ashton, P. S., M. Boscolo, J. Liu, and J. V. LaFrankie. 1999. A global programme in interdisciplinary forest research: the CTFS perspective. Journal of Tropical Forest Science 11(1):180–204.
Black, B. A., C. M. Ruffner, and M. D. Abrams. 2006. Native American influences on the forest composition of the Allegheny Plateau, northwest Pennsylvania. Canadian Journal of Forest Research 36(5):1266–1275.
Braun, E. L. 1950. Deciduous Forests of Eastern North America. Blakiston, Philadelphia, Pennsylvania, USA.
Bunn, A. G. 2008. A dendrochronology program library in R (dplR). Dendrochronologia 26:115–124.
Bunn, A. G. 2010. Statistical and visual crossdating in R using the dplR library. Dendrochronologia 28:251–258.
Chilton, E. S. 1999. Mobile farmers of pre-contact southern New England: the archaeological and ethnohistoric evidence. Pages 157–176 in Current Northeast Paleoethnobotany, John P. Hart, editor. New York State Museum Bulletin, Albany, New York, USA.
Chisholm, R. A., H. C. Muller-Landau, K. A. Rahman, D. P. Bebber, Y. Bin, S. A. Bohlman, N. A. Bourg, J. Brinks, S. Bunyavejchewin, N. Butt, H. Cao, M. Cao, D. Cárdenas, L-W. Chang, J-M. Chiang, G. Chuyong, R. Condit, H. S. Dattaraja, S. Davies, A. Duque, C. Fletcher, N. Gunatilleke, S. Gunatilleke, Z. Hao, R. D. Harrison, R. Howe, C-F. Hsieh, S. P. Hubbell, A. Itoh, D. Kenfack, S. Kiratiprayoon, A. J. Larson, J. Lian, D. Lin, H. Liu, J.A. Lutz, K. Ma, Y. Malhi, S. McMahon, W. McShea, M. Meegaskumbura, S. M. Razman, M. D. Morecroft, C. J. Nytch, A. Oliveira, G. G. Parker, S. Pulla, R. Punchi-Manage, H. Romero-Saltos, W. Sang, J. Schurman, S-H. Su, R. Sukumar, I-F. Sun, H. S. Suresh, S. Tan, D. Thomas, S. Thomas, J. Thompson, R. Valencia, A. Wolf, S. Yap, W. Ye, Z. Yuan, and J. K. Zimmerman. 2013. Scale-dependent relationships between tree species richness and ecosystem function in forests. Journal of Ecology 101(5):1214–1224.
Clark, J. S., and P. D. Royall. 1995. Transformation of a northern hardwood forest by aboriginal (Iroquois) fire: charcoal evidence from Crawford Lake, Ontario, Canada. The Holocene 5(1):1–9.
Condit, R. 1998. Tropical forest census plots. Springer, Berlin, and Landes, Georgetown, TX.
Corlett, R., and R. B. Primack. 2010. Tropical Rainforests: An Ecological and Biogeographical Comparison, Second edition. Wiley-Blackwell Publishing, Malden, Masachussetts, USA.
Delcourt, P. A., and H. R. Delcourt. 1998. The influence of prehistoric human-set fires on oak-chestnut forests in the southern Appalachians. Castanea 63(3):337–345.
Dyer, J. M. 2006. Revisiting the deciduous forests of eastern North America. Bioscience 56(4):341–352.
Fleming, G. P., and K. D. Patterson 2012. Natural Communities of Virginia: Ecological Groups and Community Types. Natural Heritage Technical Report 12-04. Virginia Department of Conservation and Recreation, Division of Natural Heritage, Richmond, Virginia, USA. 36 pages.
Fletcher, J. D., W. J. McShea, L. A. Shipley, and D. Shumway. 2001. Use of common forest forbs to measure browsing pressure by white-tailed deer (Odocoileus virginianus Zimmerman) in Virginia, USA. Natural Areas Journal 21:172–176.
Hall, P., P. S. Ashton, R. Condit, R. B. Foster, S. P. Hubbell, J. V. LaFrankie, and N. Manokaran. 1998. Separating signal from noise in sampling tropical forest structure and dynamics. Pp. 63–77 in Dallmeier, F. and J. A. Comiskey, Editors. Forest Biodiversity Research, Monitoring and Modelling, Conceptual Background and Old World Case Studies. UNESCO, Paris and Pathenon.
Heckel, C. D., N. A. Bourg, W. J. McShea, and S. Kalisz. 2010. Nonconsumptive effects of a generalist ungulate herbivore drive decline of unpalatable forest herbs. Ecology 91:319–326.
Leimgruber, P., W. J. McShea, and J. H. Rappole. 1994. Predation on artificial nests in large forest blocks. Journal of Wildlife Management 58:255–261.
Manokaran, N., J. V. LaFrankie, K. M. Kochummen, E. S. Quah, J. E. Klahn, P. S. Ashton, and S. P. Hubbell. 1990. Methodology for the Fifty Hectare Research Plot at Pasoh Forest Reserve. Research Pamphlet 104. Forest Research Institute Malaysia, Kepong. 69 pp.
McGarvey, J. C., N. A. Bourg, J. R. Thompson, W. J. McShea, X. Shen. 2013. Effects of twenty years of deer exclusion on woody vegetation at three life-history stages in a Mid-Atlantic temperate deciduous forest. Northeastern Naturalist 20(3):451–468.
McShea, W. J. 2000. The influence of acorn crops on annual variation in rodent and bird populations. Ecology 81:228–238.
McShea, W. J., and A. B. Gilles. 1992. A comparison of traps and fluorescent powder to describe foraging for mast by Peromyscus leucopus. Journal of Mammalogy 73:218–222.
McShea, W. J., and W. M. Healy, editors. 2002. Oak Forest Ecosystems: Ecology and Management for Wildlife. Johns Hopkins University Press, Baltimore, Maryland, USA.
McShea, W. J., and J. H. Rappole. 1992. White-tailed deer as keystone species within forest habitats of Virginia. Virginia Journal of Science 43:177–186.
McShea, W. J., and J. H. Rappole. 1997. The science and politics of managing deer within a protected area. Wildlife Society Bulletin 25:443–446.
McShea, W. J., and J. H. Rappole. 2000. Managing the abundance and diversity of breeding bird populations through manipulation of deer populations. Conservation Biology 14:1161–1170.
McShea, W. J., and G. Schwede. 1993. Variable acorn crops, and the response of white-tailed deer and other mast consumers. Journal of Mammalogy 74:999–1006.
McShea, W. J., C. Wemmer, and M. Stuwe. 1993. Conflict of interests: A public hunt at the National Zoo's Conservation and Research Center. Wildlife Society Bulletin 21:492–497.
McShea, W. J., M. V. McDonald, E. S. Morton, R. Meier, and J. H. Rappole. 1995. Long-term trends in habitat selection by Kentucky Warblers. The Auk 112:375–381.
McShea, W. J., W. M. Healy, P. Devers, T. Fearer, F. H. Koch, D. Stauffer, and J. Waldon. 2007. Forestry Matters: Decline of oaks will impact wildlife in hardwood forests. Journal of Wildlife Management 71:1717–1728.
Merkel, H. W. 1905. A deadly fungus on the American chestnut. New York Zoological Society, 10th annual report, pp. 97–103.
Muller-Landau, H.C. and S.J. Wright. 2010. Litterfall Monitoring Protocol, March 2010 version.
CTFS Global Forest Carbon Research Initiative, Smithsonian Tropical Research Institute, Panama City, Republic of Panama. 16 pp.
Nash, S. 1988. The blighted chestnut: New research races with time to recover a great American tree. National Parks 62:12–18.
Peattie, D. 1950. A Natural History of Trees of Eastern and Central North America. Houghton Mifflin Company, Boston, Massachussetts, USA.
Russell, E. W. B. 1983. Indian-set fires in the forests of the northeastern United States. Ecology 64(1):78–88.
Seidensticker, J. C. 1984. Management of white-tailed deer (Odocoileus virginianus) at the National Zoological Park’s Conservation and Research Center. International Zoological Yearbook 23:234–236.
Smallwood, P. D., M. A. Steele, E. Ribbens, and W. J. McShea. 1998. Detecting the effects of seed hoarders on the distribution of tree species: grey squirrels (Sciurus carolinensis) and oaks (Quercus spp.) as a model system. Pages 250–272 in M. A. Steele, J. E. Merritt, and D. A. Zegers, editors. Ecology and Evolutionary Biology of Tree Squirrels. Virginia Museum of Natural History Press.
Stevens, P. F. (2001 onwards). Angiosperm Phylogeny Website. Version 12, July 2012.
http://www.mobot.org/MOBOT/research/APweb/.
Sunquist, M. 1982. A preliminary analysis of the tree communities on the Conservation and Research Center, Front Royal, VA. Smithsonian Institution Libraries. Qk484.V8S95.
Vega Rivera, J. H., W. J. McShea, and J. H. Rappole. 2003. Comparison of breeding and post-breeding movements and habitat requirements for the scarlet tanager. The Auk 120:632–644.
Wang, G. G., B. O. Knapp, S. L. Clark, and B. T. Mudder. 2013. The silvics of Castanea dentata (Marsh.) Borkh., American chestnut, Fagaceae (Beech Family). Gen. Tech. Rep. SRS-GTR-173. Asheville, NC: U.S. Department of Agriculture Forest Service, Southern Research Station. 18 p.
Whitney, G. G. 1994. From Coastal Wilderness to Fruited Plain: A History of Environmental Change in Temperate North America from 1500 to the Present. Cambridge University Press, Cambridge, United Kingdom.
Yamaguchi, D. K. 1991. A simple method for cross-dating increment cores from living trees. Canadian Journal of Forest Research 21:414–416.