Ecological Archives E094-085-D1
Michael J. Vanni, William H. Renwick, and María J. González. 2013. Nutrient and sediment concentrations in three agriculturally-impacted streams over a 15-year period. Ecology 94:978. http://dx.doi.org/10.1890/12-1439.1
Introduction
Anthropogenic activities have altered biogeochemical cycles in many ways (Vitousek et al. 1997; Finzi et al. 2011). Land use change is one of the most widespread perturbations imposed by humans, and can alter nutrient fluxes from landscapes to water bodies. In particular, agricultural activities often increase the export of nutrients (e.g., nitrogen and phosphorus) and sediment to downstream ecosystems (Carpenter et al. 1998; Alvarez-Cobelas et al. 2009; Howarth et al. 2012). Increased nutrient loading to aquatic ecosystems can cause eutrophication and increased sediment loads can foul habitats and accelerate sedimentation rates of aquatic ecosystems (Carpenter et al. 1998; Dodds et al. 2009). However, there is much variation in the export rates of nutrients and sediments from watersheds to aquatic ecosystems. Some of this variation is caused by variation in climate, namely precipitation-induced variation in runoff. Concentrations of some nutrient fractions increase during runoff events, while concentrations of other fractions may not change or may even decrease during such events (e.g., Vanni et al. 2001; Royer et al. 2006). Even if concentrations do not increase during storm events, the flux of an element via a stream (which is equal to the product of element concentration and stream discharge) may increase simply because stream discharge increases during these events.
In many agricultural areas, farming practices are changing. One of the most widespread changes in some areas (e.g., the Midwest USA) is a shift toward conservation tillage (Richards et al 2002; Kleinman et al. 2011), defined as any tillage method that leaves > 30% of the field surface covered with crop residue (this includes no-till). This strategy is designed to reduce soil erosion and hence the loss of nutrients and sediments from fields. In general, phosphorus (P) and sediment export rates are reduced more than nitrogen (N) export by conservation tillage because a greater fraction of P and sediment export occurs via surface runoff compared to N export, which is often dominated by nitrate export via shallow groundwater (Richards and Baker 2002; Renwick et al. 2008).
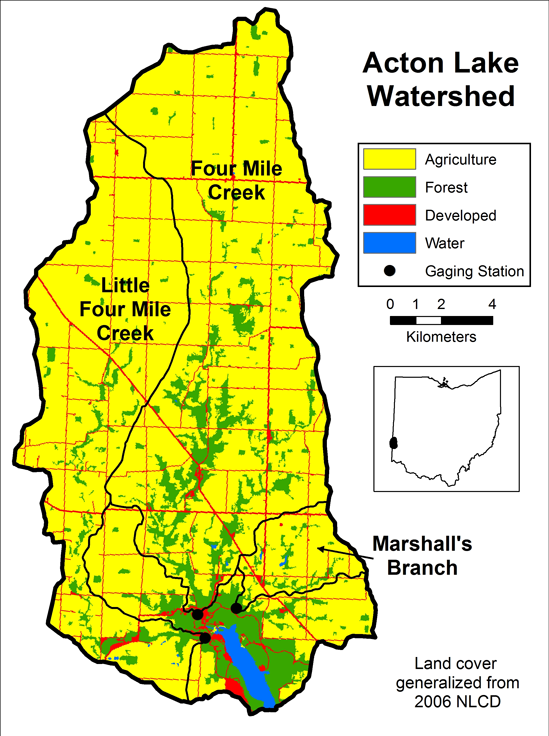
Here we present 15 years of data on the concentrations of nutrients and suspended sediments in three streams in southwestern Ohio, USA. The study area (Fig. 1) is within the Eastern Corn Belt Plains ecoregion (Omernik 1987). Bedrock consists of thinly interbedded limestone and shale; these rocks crop out in steep valley walls and some stream beds. They are overlain by up to 70 meters of glacial deposits, consisting mainly of compact calcareous glacial till derived from local bedrock, and locally including small amounts of fluvio-glacial materials. These glacial deposits are capped by a layer of loess, up to 150 cm but generally less than 20 cm thick. The topography consists of a relatively flat plateau into which valleys have been incised to depths of up to 100 m. Slopes are mainly gentle on uplands (<6%), and locally steep on valley sides. Most valleys have modest accumulations of alluvium, some of which is historic in age. Many streams are undergoing active erosion (Rakovan and Renwick 2011).
Soils are generally alfisols with some mollisols and inceptisols (Allen et al. 2006). The most common textures are loam and silt loam, with some stratified sandy loams on floodplains and terraces. Subsoils tend to be finer textured and relatively compact. Most soils are near neutral in pH. They are variable in moisture-holding characteristics: areas of relatively steep slopes and soils developed on alluvium are generally moderately well-drained to well-drained. On gently-sloping uplands soils are generally well drained to poorly drained, and many upland areas are artificially drained by subsurface tile systems.
The watersheds of the three streams differ considerably in area but are nearly identical in terms of land use, which is dominated by row crop agriculture (Table 1). All three streams drain into Acton Lake, a hypereutrophic reservoir with high nutrient concentrations and phytoplankton biomass (Vanni et al. 2001, 2006a,b, 2011). Collectively the three streams comprise 86% of the lake's watershed (Vanni et al. 2001).
The climate in this area is temperate, with significant precipitation year round. Mean annual precipitation from 1931–1980 was ~980 mm and evapotranspiration was ~660 mm (Harstine 1991). During the period of our study (1994–2008), precipitation averaged 1056 mm/yr based on data from a weather station located about 8 km SE of our gaging stations (see Sampling Design and Methods and Data Set Files sections). The annual cycle of surface runoff is driven by temporal variation in cropland evapotranspiration, which generally follows temperature patterns. Thus, runoff is generally low in summer and fall when crops are in the fields, and relatively higher in winter and spring when much of the landscape is barren (Vanni et al. 2001).
Agricultural practices changed in these watersheds during the 1990s. From 1990–1999, the use of conservation tillage increased from ~15% to ~60% of cropland and the use of N and P in fertilizers decreased, based on trends in county-wide fertilizer deliveries (Renwick et al. 2008). Since ~1999, the extent of conservation tillage has remained relatively constant at ~60–70% of cropland, while the use of fertilizers has increased somewhat (Renwick et al. 2008). In addition, the number of hogs in the watersheds decreased by about 33% from 1990 to 2005 (based on county-wide data; Renwick et al. 2008), and livestock are mainly raised in indoor facilities where manure can be managed as opposed to in outdoor feedlots. In association with these changes in agricultural practices, discharge-standardized concentrations of P, suspended sediment (SS) and ammonium declined about 5–7% per year from 1994–2006, averaged among the three streams (Renwick et al. 2008). In contrast, the discharge-standardized concentrations of nitrate (which accounts for >90% of N export) have not declined over this period. These changes are consistent with known effects of conservation tillage on sediment, N and P exports (Richards and Baker 2002; Richards et al. 2008).
The stream data we present here have been collected for two main reasons. First, we wish to quantify changes in stream sediment and nutrient concentrations arising from changing agricultural practices, as well as the response of the reservoir (Acton Lake) ecosystem to these changes. As mentioned above, shifts towards conservation tillage are widespread (Kleinman et al. 2011), but few studies have quantified the consequences for stream sediment and nutrients (Richards and Baker 2002; Richards et al. 2008) and no other studies have quantified effects on a downstream reservoir. The second reason for collecting stream nutrient data (and actually the reason we started collecting these data) is to assess the relative importance of nutrient inputs to Acton Lake from its watershed vs. nutrients provided by excretion by detritivorous, sediment-feeding fish (gizzard shad, Dorosoma cepedianum). We are especially interested in how the two nutrient sources vary in importance over various time scales in terms of fluxes and in supporting phytoplankton primary production. These fish are abundant and their excretion of nutrients can support a significant fraction of phytoplankton production in summer, when streamflow is usually low (Vanni et al. 2006b). During storms, the watershed (streams) usually provides much more N and P than fish (Vanni et al. 2005, 2006a).
The data set we present here contains 15 years of data collected at a relatively high frequency. Stream discharge is quantified every 10 minutes, and for this paper we collapsed these data into daily means (i.e., over 16,000 daily observations; >5,000 per stream). Nutrient and sediment concentrations are quantified on water samples taken from automated samplers at 4–8 hour intervals. Because concentrations of some fractions change considerably during storms but relatively little over during baseflow, we process all samples taken during storms but only 2–3 per week if no storms occur. Thus, sample size depends on weather. We routinely measure four nutrient and sediment fractions on all samples: nitrate (NO3-N), ammonium (NH4), soluble reactive P (SRP) and suspended sediments (SS). The data set we present here includes over 42,000 nutrient and sediment concentrations, distributed fairly uniformly across the three streams and four fractions (Table 1).
Metadata
Class I. Data set descriptors
A. Data set identity: Nutrient and sediment concentrations in three agriculturally-impacted streams over a 15 year period.
B. Data set identification code
C. Data set description
Principal Investigators/authors:
Michael J. Vanni, Department of Zoology, Miami University, Oxford, OH, USA 45056
William H. Renwick, Department of Geography, Miami University, Oxford, OH, USA 45056
María J. González, Department of Zoology, Miami University, Oxford, OH, USA 45056
Abstract: Concentrations of nutrients and sediments in streams reflect land use and climate patterns in the watersheds they drain and also have implications for downstream ecosystems. Here we present 15 years of high-resolution data on the concentrations of nutrients (ammonium, nitrate, and soluble reactive phosphorus) and suspended sediments in three streams that drain watersheds in Ohio, USA, dominated by row crop agriculture (mostly maize and soy). In addition, we present daily precipitation and stream discharge data over this 15-year period. Agricultural practices in these watersheds have changed over this period, including a pronounced increase in conservation tillage, a reduction in fertilizers, a reduction in the number of hogs, and improved manure management. The data set consists of >42 000 nutrient and sediment concentrations (31983898 samples from each of three streams for four nutrient and sediment constituents). The data set is unique in terms of its combination of length and resolution (sampling frequency 68 hours during storms) as well as its utility in assessing how changes in agricultural practices affect the concentrations and export rates of nutrients and sediments. Data presented here have been used in several papers quantifying nutrient export from streams, nutrient loading to a downstream reservoir (Acton Lake), and how nutrient inputs modulate ecosystem function and food web dynamics in Acton Lake.
D. Key words: agriculture; ammonium; discharge; nitrate; nitrogen; phosphorus; sediments; streams; water quality; watershed.
Class II. Research origin descriptors
A. Overall project description
Identity: Long-term (15 years) data on stream nutrient and sediment concentrations
Originators: Michael J. Vanni, William H. Renwick and María J. González
Objectives: We sought to quantify the concentrations and export rates of nutrients and sediments in three streams that drain agricultural watersheds and discharge into a eutrophic reservoir. Two goals motivated this research. We are interested in the relative importance of nutrient inputs from the watershed to the reservoir, compared to internal sources of nutrients, especially nutrient excretion by sediment-feeding fish. In addition, we are interested in quantifying how changes in agricultural practices affect the concentrations and export rates of nutrients and sediments.
Sources of funding: The majority of this research was funded by several grants from the National Science Foundation. In particular, funding from the Long-term Research in Environmental Biology program has been instrumental in funding this research. Additional funding has been provided by the Ohio Department of Natural Resources-Division of Wildlife.
B. Specific subproject description
Site description: This study takes place in the Upper Four Mile Creek (UFMC) watershed in southwestern Ohio and southeastern Indiana. The watershed is also sometimes referred to as the Acton Lake watershed (Fig. 1) because it drains into this eutrophic reservoir, which is located in Hueston Woods State Park in Preble County, Ohio. There are three study streams (i.e., three subwatersheds), which collectively comprise 86% of the Acton/UFMC watershed (Vanni et al. 2001; Renwick et al. 2008). Four Mile Creek drains the largest watershed (Table 1), constitutes 50% of the Acton/UFMC watershed and is located entirely in Preble County. Little Four Mile Creek drains 31% of the Acton/UFMC watershed; it is located in Preble County as well as Union and Wayne Counties, Indiana. Marshall's Branch drains 5% of the Acton/UFMC watershed and is located in Preble County. Land use in all three watersheds is dominated by row crop agriculture (Table 1), mostly maize (corn) and soy. Forested areas are mostly confined to some riparian areas and area within Hueston Woods State Park at the bottom of the watershed. Developed areas are scarce (< 1 % of land area).
Sampling design and methods: We have employed a high-resolution sampling program since 1994 on the three streams using automated gaging stations. To estimate stream discharge (volume of water flow per unit time), we recorded stream stage at each gaging station at 10-minute intervals using vented pressure transducers installed in stilling wells, connected to dataloggers. Stage was converted to discharge with standard rating-curve techniques using field discharge measurements (Kennedy 1983). On some occasions (< 15% of possible data points) one or more of the dataloggers failed to record data due to battery depletion or other technical problem. Under these circumstances discharge was estimated using regressions of discharge at that station vs. discharge at one of the other stations, or if necessary nearby USGS stations on Sevenmile Creek at Collinsville, Ohio, or East Fork Whitewater River at Abington, Indiana. In this paper, we present mean daily discharge for all days from 1994–2008. In addition, we present mean hourly discharge values that correspond with nutrient and sediment samples.
Water samples are taken with ISCO programmable samplers. In the two largest streams (Four Mile Creek and Little Four Mile Creek), samples have been taken every 6 or 8 hours. In Marshall's Branch, the sampling interval has varied between 2–8 hours (usually 6 or 8). The ISCO samplers collect and store 24 samples, are collected weekly from the gaging stations, year round. All samples collected during storms are processed for three nutrient fractions (ammonium, nitrate, and soluble reactive phosphorus) and sediments. Thus, we process all samples during storms, but only a subset during baseflow (generally 2–3 per week). The reason for processing more samples during storms is that concentrations often change dramatically during storm events, whereas during baseflow periods changes in concentrations are much less pronounced (Vanni et al. 2001).
Water samples are transported to a lab at Miami University (8 km from the gaging stations), stored at 4°C for up to 24 hours, and filtered. To estimate suspended sediment (SS) concentrations, a known volume of water is passed through a pre-weighed glass fiber filter (Pall A/E), dried at 60°C and re-weighed. Filters are weighed on a Mettler UMT ultra-microbalance to the nearest 1 µg. To estimate concentrations of dissolved inorganic nutrients (ammonium (NH4), nitrate (NO3-N) and soluble reactive P (SRP)), samples are passed through Pall A/E glass fiber filters. Filtrate samples are acidified and stored at 4°C until they are analyzed. Comparison of unacidified samples processed immediately after filtering vs. those acidified and stored for several months at 4°C revealed no significant effect of acidification and storage (for NH4, NO3, and SRP, regressions of unacidified vs. acidified samples all had r² > 0.99, slopes ~1 and intercepts ~0). From 1994–1998, nutrients were analyzed using manual methods, whereas from 1999 onwards they were analyzed with a Lachat QC 800 FIA auto-analyzer. For samples analyzed with manual methods, NH4 was analyzed with the phenolhypochlorite method (Solorzano 1969), NO3 with second-derivative spectrophotometry (Crumpton et al. 1992), and SRP with the molybdenum blue technique (Murphy and Riley 1962). For samples analyzed with the auto-analyzer, we used similar methods except that NO3 was analyzed with the cadmium reduction method. To standardize all nutrient concentrations, we analyzed a subset of samples using both manual and auto-analyzer methods. Manual and automated methods yielded similar results (r² > 0.99 for all three nutrient fractions), but we nevertheless standardized all concentrations to auto-analyzer methods using regressions between manual vs. auto-analyzer concentrations (regression statistics are given in Renwick et al. 2008). Detection limits (µg N or P/L) were higher for SRP using the auto-analyzer (~6) than for the manual method (~3) but were similar between methods for NH4-N (~9) and NO3-N (~50).
So that users of our data can relate stream discharge to precipitation, we also include daily precipitation data for the 15 years of our study. Precipitation data were obtained from two gauges at a meteorological station at the Ecology Research Center (ERC), Miami University. The ERC is located only ~8 km from the stream gauging stations, but is outside of the study watersheds. One gauge provides hourly data and is part of the US Environmental Protection Agency's Clean Air Status and Trends (CASTNET) network, while the other is part of the National Atmospheric Deposition Program (NADP) and provides daily data. We downloaded data from the program websites (http://epa.gov/castnet, http://nadp.sws.uiuc.edu/) and used the CASTNET data as our primary data source. However, there were some missing hourly data (< 1% of values). When missing data strings consisted of just one or a few hours during daytime, precipitation on surrounding hours was zero, and skies were clear (based on solar radiation data, also obtained from the CASTNET website), we assumed that precipitation during the missing hours was zero. Hourly data were then summed to obtain daily precipitation. When missing CASTNET data periods occurred at night or spanned more than a few hours, we used daily data from the NADP site. We were justified in using data from the two gauges interchangeably because daily precipitation between the two sites was strongly correlated (r² = 0.719, n = 4930 dates common to both sites).
Class III. Data set status and accessibility
A. Status
Latest update: Data through 31 December 2008 are included.
Metadata status: Metadata are complete for this period and are stored with the data (see B. below).
Data verification: Data are checked and verified in several ways. Concentration data are checked by a Research Associate (the person conducting the chemical analyses) soon after samples are analyzed. Data are then inspected by one or two of the PIs (Vanni and/or Renwick) before being permanently stored.
Contact persons:
Michael J. Vanni, Department of Zoology, Miami University, Oxford, OH, USA 45056; email: [email protected]; telephone: 513-529-3192.
William H. Renwick, Department of Geography, Miami University, Oxford, OH, USA 45056; email: [email protected]; telephone: 513-529-5010.
Copyright restrictions: None
Proprietary restrictions: None, but users of data are asked to contact of the contact persons listed above so that we are aware of how are data are used.
Costs: None
Class IV. Data structural descriptors
A. Data Set File
Identity:
The data set includes two files:
Daily_precipitation_and_stream_discharge.csv - This file contains daily precipitation and discharge data for 15 years. The file contains 5479 precipitation observations and 5479 discharge observations (daily data from 1 January 1994 – 31 December 2008) for each of two streams, Four Mile Creek and Marshall's Branch. However, we did not start collecting data on Little Four Mile Creek until 21 May 1994, so there are 5339 discharge observations for this stream.
Stream_nutrient_data.csv - This file contains nutrient and sediment concentration data for three streams over a 15-year period. It also contains mean hourly discharge corresponding to the hour in which the nutrient or sediment sample was collected.
Size:
Daily_precipitation_and_stream_discharge.csv - 5479 lines, not including header row; 139 KB
Stream_nutrient_data.csv - 4305 lines, not including header row; 434 KB
Column header information:
Daily_precipitation_and_stream_discharge.csv
5 columns:
Date |
Four Mile Creek discharge (m3/sec) |
Little Four Mile Creek discharge (m3/sec) |
Marshall's Branch discharge (m3/sec) |
Precipitation (mm/day) |
Stream_nutrient_data.csv
18 columns total;
Columns 1–6:
FM Date & Time |
FM Discharge (m3/sec) |
FM NH4-N (µg N/L) |
FM NO3-N (µg N/L) |
FM SRP (µg P/L) |
FM Susp sed (mg dry mass/L) |
Columns 7–12:
LF Date & Time |
LF Discharge (m3/sec) |
LF NH4-N (µg N/L) |
LF NO3-N (µg N/L) |
LF SRP (µg P/L) |
LF Susp sed (mg dry mass/L) |
Columns 13–18:
MB Date & Time |
MB Discharge (m3/sec) |
MB NH4-N (µg N/L) |
MB NO3-N (µg N/L) |
MB SRP (µg P/L) |
MB Susp sed (mg dry mass/L) |
B. Variable definitions
Daily_precipitation_and_stream_discharge.csv
Variable name |
Variable definition |
Units |
Storage type |
Range of values |
Date |
Calendar date |
Date |
Day Month Year |
1 January 1994 – 31 December 2008 |
Four Mile Creek discharge (m3/sec)
|
Mean daily discharge (streamflow) in Four Mile Creek |
m3 second-1 |
numeric |
0 – 55.400 |
Little Four Mile Creek discharge (m3/sec)
|
Mean daily discharge (streamflow) in Little Four Mile Creek |
m3 second-1 |
numeric |
0 – 22.766 |
Marshall's Branch discharge (m3/sec)
|
Mean daily discharge (streamflow) in Marshall's Branch |
m3 second-1 |
numeric |
0 – 4.572 |
Precipitation (mm/day) |
Daily precipitation at nearby meteorological site |
mm day-1 |
numeric |
0 – 104.6 |
Stream_nutrient_data.csv
Variable name |
Variable definition |
Units |
Storage type |
Range of values |
FM Date & Time |
Calendar date and time for Four Mile Creek samples |
Date & time (hh:mm) |
Date & time (hh:mm) |
30 January 1994 11:00 – 31 December 2008 21:07 |
FM Discharge (m3/sec) |
Mean hourly discharge (streamflow) in Four Mile Creek during the hour in which nutrient or sediment sample was taken |
m3 second-1 |
numeric |
0.006 – 102.509 |
FM NH4-N (µg N/L) |
Concentration of nitrogen as ammonium in Four Mile Creek |
µg ammonium-N L-1 |
numeric |
0 – 2,368 |
FM NO3-N (µg N/L) |
Concentration of nitrogen as nitrate in Four Mile Creek |
µg nitrate-N L-1 |
numeric |
0 – 18,082 |
FM SRP (µg P/L) |
Concentration of soluble reactive phosphorus (SRP) in Four Mile Creek |
µg SRP L-1 |
numeric |
0 – 889.7 |
FM Susp sed (mg dry mass/L) |
Concentration of suspended sediments (suspended solids) in Four Mile Creek |
mg sediment L-1 |
numeric |
0 – 6,336 |
LF Date & Time |
Calendar date and time for Little Four Mile Creek samples |
Date & time (hh:mm) |
Date & time (hh:mm) |
23 May 1994 12:00 – 31 December 2008 14:27 |
LF Discharge (m3/sec) |
Mean hourly discharge (streamflow) in Little Four Mile Creek during the hour in which nutrient or sediment sample was taken |
m3 second-1 |
numeric |
0.019 – 25.205 |
LF NH4-N (µg N/L) |
Concentration of nitrogen as ammonium in Little Four Mile Creek |
µg ammonium-N L-1 |
numeric |
0 – 6,720 |
LF NO3-N (µg N/L) |
Concentration of nitrogen as nitrate in Little Four Mile Creek |
µg nitrate-N L-1 |
numeric |
0 – 22,638 |
LF SRP (µg P/L) |
Concentration of soluble reactive phosphorus (SRP) in Little Four Mile Creek |
µg SRP L-1 |
numeric |
0 – 609.1 |
LF Susp sed (mg dry mass/L) |
Concentration of suspended sediments (suspended solids) in Little Four Mile Creek |
mg sediment L-1 |
numeric |
0 – 2,726 |
MB Date & Time |
Calendar date and time for Marshall's Branch samples |
Date & time (hh:mm) |
Date & time (hh:mm) |
23 May 1994 12:00 – 31 December 2008 14:27 |
MB Discharge (m3/sec) |
Mean hourly discharge (streamflow) in Marshall's Branch during the hour in which nutrient or sediment sample was taken |
m3 second-1 |
numeric |
0 – 6.071 |
MB NH4-N (µg N/L) |
Concentration of nitrogen as ammonium in Marshall's Branch |
µg ammonium-N L-1 |
numeric |
0 – 2,205 |
MB NO3-N (µg N/L) |
Concentration of nitrogen as nitrate in Marshall's Branch |
µg nitrate-N L-1 |
numeric |
0 – 17,340 |
MB SRP (µg P/L) |
Concentration of soluble reactive phosphorus (SRP) in Marshall's Branch |
µg SRP L-1 |
numeric |
0 – 1,743 |
MB Susp sed (mg dry mass/L) |
Concentration of suspended sediments (suspended solids) in Marshall's Branch |
mg sediment L-1 |
numeric |
0 – 2,490 |
Class V. Supplemental descriptors
A. Publications using these data:
Bremigan, MT, PA Soranno, MJ González, DB Bunnell, KK Arend, WH Renwick, RA Stein, and MJ Vanni. 2008. Hydrogeomorphic features mediate the effects of land use on reservoir productivity and food webs. Limnology and Oceanography 53:1420-1433.
Domine, LM, MJ Vanni and WH Renwick. 2010. New and regenerated primary production in a productive reservoir ecosystem. Canadian Journal of Fisheries and Aquatic Sciences 67:278-287.
Knoll, L.B., M.J. Vanni, W.H. Renwick, E.K. Dittman and J.A. Gephart. 2013. Temperate reservoirs are large carbon sinks and small CO2 sources: Results from high-resolution carbon budgets. Global Biogeochemical Cycles (accepted pending minor revisions).
Renwick, WH, MJ Vanni, Q Zhang and J Patton. 2008. Water quality trends and changing agricultural practices in a Midwest US watershed, 1994-2006. Journal of Environmental Quality 37:1862-1874.
Stoeckel, JA, J Morris, E Ames, D Glover, MJ Vanni, WH Renwick and MJ González. 2012. Exposure times to the spring atrazine flush along a stream-reservoir system. Journal of the American Water Resources Association 48:616-634.
Vanni, MJ, RS Andrews, WH Renwick, MJ González and SE Noble. 2006. Nutrient and light limitation of reservoir phytoplankton in relation to storm-mediated pulses in stream discharge. Archiv für Hydrobiologie 167:421-445.
Vanni MJ, KK Arend, MT Bremigan, DB Bunnell, JE Garvey, MJ González, WH Renwick, PA Soranno, and RA Stein. 2005. Linking landscapes and food webs: Effects of omnivorous fish and watersheds on reservoir ecosystems. BioScience 55:155-167.
Vanni, MJ, WH Renwick, AM Bowling, MJ Horgan and AD Christian. 2011. Nutrient stoichiometry of linked catchment-lake systems along a gradient of land use. Freshwater Biology 56:791-811.
Vanni, M.J., W.H. Renwick, J.L. Headworth, J.D. Auch and M.H. Schaus. 2001. Dissolved and particulate nutrient flux from three adjacent agricultural watersheds: a five-year study. Biogeochemistry 54:85-114.
Table 1. Characteristics of the three streams and the number of samples for which data are included in this paper. Land use data are from 2001 and were taken from the US Geological Survey's National Land Cover Database (NLCD) (http://www.mrlc.gov/).
|
Watershed land use (area [%]) |
Number of samples |
|||||||
Stream |
Watershed area (km²) |
Agriculture |
Forest |
Developed |
Water & Wetland |
NH4-N |
NO3-N |
SRP |
SS |
Four Mile Creek |
128.7 |
82.8 |
12.2 |
4.8 |
0.2 |
3384 |
3519 |
3632 |
3534 |
Little Four Mile Creek |
79.7 |
88.8 |
6.3 |
4.7 |
0.2 |
3196 |
3405 |
3389 |
3374 |
Marshall's Branch |
12.1 |
81.3 |
11.6 |
6.5 |
0.6 |
3861 |
3861 |
3898 |
3816 |
Land use categories (NLCS 2001 land cover classes): Agriculture: 71 (grassland), 81 (pasture/hay), 82 (cultivated crops) Forest: 41 (deciduous forest), 42 (evergreen forest), 43 (mixed forest) Developed: 21 (open space), 22 (low intensity), 23 (medium intensity), 24 (high intensity) Water & Wetland: 11 (open water), 90 (woody wetlands), 95 (emergent herbaceous wetlands)
Nutrient and sediment fractions: NH4-N: Nitrogen as ammonium NO3-N: Nitrogen as nitrate SRP: Soluble reactive phosphorus SS: Suspended sediments (suspended solids) |
|||||||||
Fig. 1. Map of the study watersheds showing land use. "Agriculture" includes row crop (~85% of agricultural land) and pasture/hay. "Developed" includes residential, commercial, and industrial areas, as well as roads. Acton Lake (in blue) is at the terminus of the watershed.
Acknowledgments
We are grateful for funding for data collection and analyses, provided by the National Science Foundation (especially the Long-term Research in Environmental Biology (LTREB) program through grants DEB 0235755 and 0743192), the Ohio Department of Natural Resources-Division of Wildlife, and the Miami University Research Challenge Program. We also thank the Miami Valley Conservancy District for providing funds to construct one of our stream gaging stations and to Hueston Woods State Park for allowing us to install the gaging stations on their property and for providing assistance in installation. We are especially grateful to the many students and technicians who assisted with field and lab work over the 15 years, especially Scott Davis, Jenifer Headworth, Alan Christian, Lesley Knoll, Annie Bowling, Peter Levi, and Beth (Dickman) Mette. Finally, we thank two anonymous reviewers, whose comments approved this paper.
Literature cited
Allen, J. R., D. B. Dotson, M. H. Deaton, S. J. Hamilton, and T. E. Lucht. 2006. Soil survey of Preble County, Ohio. US Department of Agriculture, Natural Resources Conservation Service. http://soildatamart.nrcs.usda.gov/Manuscripts/OH135/0/Preble_OH.pdf
Alvarez-Cobelas, M., S. Sánchez-Carrillo, D. G. Angeler, and R. Sánchez-Andrés. 2009. Phosphorus export from catchments: a global view. Journal of the North American Benthological Society 28:805–820.
Carpenter, S. R., N. F. Caraco, D. L. Correll, R. W. Howarth, A. N. Sharpley, and V. H. Smith. 1998. Nonpoint pollution of surface waters with phosphorus and nitrogen. Ecological Applications 8:559–568.
Crumpton, W. G., T. M. Isenhart, and P. D. Mitchell. 1992. Nitrate and organic N analyses with second derivative spectroscopy. Limnology and Oceanography 37:907–913.
Finzi, A. C., A. T. Austin, E. E. Cleland, S. D. Frey, B. Z. Houlton, and M. D. Wallenstein. 2011. Responses and feedbacks of coupled biogeochemical cycles to climate change: examples from terrestrial ecosystems. Frontiers in Ecology and the Environment 9:61–67.
Harstine, L. J. 1991. Hydrologic Atlas for Ohio. Ohio Department of Natural Resources, Water Inventory Report 28. http://www.ohiodnr.com/water/pubs/hydatlas/atlaspl4/tabid/4185/Default.aspx
Howarth, R. W., D. Swaney, G. Billen, J. Garnier, B. Hong, C. Humborg, P. Johnes, C. Mörth, and R. Marino. 2012. Nitrogen fluxes from the landscape are controlled by net anthropogenic nitrogen inputs and by climate. Frontiers in Ecology and the Environment 10:37–43.
Kennedy, E. J. 1983. Computation of continuous records of streamflow. Techniques of water resources investigations of the United States Geological Survey, Book 3. U.S. Geological Survey.
Kleinman, P. J. A., A. N. Sharpley, R. W. McDowell, D. N. Flaten, A. R. Buda, L. Tao, L. Bergstrom, and Q. Zhu. 2011. Managing agricultural phosphorus for water quality protection: principles for progress. Plant and Soil 349:169–182.
Murphy, J., and J. P. Riley. 1962. A modified single solution method for the determination of phosphate in natural waters. Analytica Chimica Acta. 27:31–36.
Omernik, J. M. 1987. Ecoregions of the conterminous United States. Annals of the Association of American Geographers 77:118–125.
Rakovan, M. T., and W. H. Renwick. 2011. The role of sediment supply in channel instability and stream restoration Journal of Soil and Water Conservation 66:40–50.
Renwick, W. H., M. J. Vanni, Q. Zhang, and J. Patton. 2008. Water quality trends and changing agricultural practices in a Midwest US watershed, 1994-2006. Journal of Environmental Quality 37:1862–1874.
Richards, R. P., and D. B. Baker. 2002. Trends in water quality in LEASEQ rivers and streams (Northwestern Ohio) 1975-1995. Journal of Environmental Quality 31:90–96.
Richards, R. P., D. B. Baker, and D. J. Eckert. 2002. Trends in agriculture in the LEASEQ watersheds, 1975-1995. Journal of Environmental Quality 31:17–24.
Richards, R. P., D. B. Baker, J. P. Crumrine, J. W. Kramer, D. E. Ewing, and B. J. Merryfield. Thirty-year trends in suspended sediment in seven Lake Erie tributaries. Journal of Environmental Quality 37:1894–1908.
Royer, T. V., M. B. David, and L. E. Gentry. 2006. Timing of riverine export of nitrate and phosphorus from agricultural watersheds in Illinois: Implications for reducing nutrient loading to the Mississippi River. Environmental Science & Technology 40:4126–4131.
Solorzano, L. 1969. Determination of ammonia in natural waters by the phenolhypochlorite method. Limnology and Oceanography 14: 799–801.
Vanni, M. J., R.S. Andrews, W.H. Renwick, M.J. González and S.E. Noble. 2006a. Nutrient and light limitation of reservoir phytoplankton in relation to storm-mediated pulses in stream discharge. Archiv für Hydrobiologie 167:421–445.
Vanni, M. J., K. K. Arend, M. T. Bremigan, D. B. Bunnell, J. E. Garvey, M. J. González, W. H. Renwick, P. A. Soranno, and R. A. Stein. 2005. Linking landscapes and food webs: Effects of omnivorous fish and watersheds on reservoir ecosystems. BioScience 55:155–167.
Vanni, M. J., A. M. Bowling, E. M. Dickman, R. S. Hale, K. A. Higgins, M. J. Horgan, L. B. Knoll, W. H. Renwick, and R. A. Stein. 2006b. Nutrient cycling by fish supports relatively more lake primary production as ecosystem productivity increases. Ecology 87:1696–1709.
Vanni, M. J., W. H. Renwick, A. M. Bowling, M. J. Horgan, and A. D. Christian. 2011. Nutrient stoichiometry of linked catchment-lake systems along a gradient of land use. Freshwater Biology 56:791–811.
Vanni, M. J., W. H. Renwick, J. L. Headworth, J. D. Auch, and M. H. Schaus. 2001. Dissolved and particulate nutrient flux from three adjacent agricultural watersheds: a five-year study. Biogeochemistry 54:85–114.
Vitousek, P. M., H. A. Mooney, J. Lubchenco, and J. M. Melillo. 1997. Human domination of Earth's ecosystems. Science 277:494–499.