Ecological Archives E093-103-A2
David A. W. Miller. 2012. General methods for sensitivity analysis of equilibrium dynamics in patch occupancy models. Ecology 93:1204–1213.
Appendix B. Multi-state occupancy model for golden eagles.
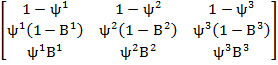
Estimates in this example come from a multistate occupancy model from a 20 year study of occupancy patterns of golden eagles (Aquila chrysaetos) in Denali National Park, Alaska, USA (Martin et al. 2009). Possible states for sites were 1) unoccupied, 2) occupied but breeding unsuccessful, and 3) occupied and breeding successful. Annual transition probabilities were estimated as a function of conditional binomial probabilities where:
|
|
(B.1) |
ψj was the probability of being occupied in time t + 1 conditional on the site being in the jth state in time t. Bj was the probability that breeding is successful conditional on the site being occupied in time t + 1 and being in the jth state in time t.
The parameters ψj and Bj were a function of two environmental covariates, whether or not a site was in area vulnerable to disturbance (DIST; DIST = 0 for undisturbed sites and 1 for disturbed sites) and an annual index of snowshoe hare abundance (Lepus americanus; HARE). Generalized linear models which described the relationships were logit(ψ1) = -0.73 - 1.41 × DIST, logit(ψ2) = 2.56 + 0.56 × DIST, logit(ψ3) = 3.09 + 0.10 × DIST, and logit(B1) = logit(B2) = logit(B3) = -0.78 + 5.95 × HARE. The mean value of DIST for all sites was 0.269 (25 out of 93 sites disturbed) and of HARE for all years was 0.057 (range = 0.005–0.262). Two derived state variables were also calculated, overall occupancy (e2 + e3; OCC), and probability of reproductive success conditional on a site being occupied (e3/[e2+ e3]; RSUCC). Using their model, I provide examples of sensitivity calculations 1) when the Markovian constraint needs to be imposed and when it occurs naturally, 2) that use lower-level parameters and derived state variables, and 3) that use a constant transition matrix and that allow for temporal and spatial variability. Example code for all calculations presented here as well as some additional sensitivities are included in Supplement 1.
First I consider sensitivities when transition probabilities are constant across sites and years. To do this I used transition probabilities calculated using mean values of DIST and HARE. The estimated stationary state distribution at the means was e = [0.180 0.498 0.322] and stationary values for OCC and RSUCC were 0.820 and 0.393, respectively. The sensitivities of e to changes in ri,j (Eq. 6–8) are shown in Table 1 and sensitivities of OCC and RSUCC to changes in ri,j are shown in Fig. B1. In both cases the Markovian constraint had to be imposed and I show calculations using uniform compensation and proportional compensation for each. To demonstrate a lower-level parameter, I calculated the sensitivity of the stationary state distribution e to changes in ψj and Bj (Fig. B2). The Markovian constraint is naturally met because the total change in any column of R (Eq. B1) when they are changed by a given value will sum to 0.
As an example that includes environmental stochasticity, I calculated sensitivities where R differed among years in relation to hare abundance and among sites in relation to disturbance. When calculating the sensitivities to changes in HARE and DIST, I compared estimates assuming constant R (i.e., based on e; Eq. 9–11) to those calculated from time and site varying R (i.e., derived from e[T,S]; Eq. 25–27). For each case I calculated the sensitivity of the stationary state distribution, OCC, and RSUCC to changes in HARE and the proportion of disturbed sites (Table B2).
Table B1. Sensitivities of the golden eagle stationary state distribution (e) to changes in each of the 9 Markov transition probabilities (ri,j). The stationary distribution consists of the equilibrium proportion of sites unoccupied by eagles (e1), occupied by eagles but reproduction unsuccessful (e2), and occupied and successful reproduction (e3). Sensitivities were calculated using both uniform and proportional compensation.
|
Parameter Estimate |
Uniform Compensation | Proportional Compensation | |||||
| e1 | e2 | e3 | e1 | e2 | e3 | ||
| r1,1 | 0.751 | 0.595 | -0.342 | -0.253 | 0.594 | -0.361 | -0.233 |
| r2,1 | 0.151 | -0.289 | 0.301 | -0.012 | -0.52 | 0.399 | 0.121 |
| r3,1 | 0.098 | -0.306 | 0.041 | 0.265 | -0.502 | 0.184 | 0.318 |
| r1,2 | 0.062 | 1.646 | -0.946 | -0.7 | 1.643 | -0.998 | -0.645 |
| r2,2 | 0.569 | -0.798 | 0.832 | -0.033 | -0.208 | 0.581 | -0.372 |
| r3,2 | 0.368 | -0.848 | 0.115 | 0.733 | -0.194 | -0.361 | 0.555 |
| r1,3 | 0.042 | 1.065 | -0.612 | -0.453 | 1.062 | -0.645 | -0.417 |
| r2,3 | 0.582 | -0.516 | 0.538 | -0.021 | -0.088 | 0.355 | -0.268 |
| r3,3 | 0.376 | -0.548 | 0.074 | 0.474 | -0.093 | -0.257 | 0.35 |
Table B2. Sensitivities of golden eagle stationary state distribution, total occupancy (OCC), and reproductive success (RSUCC) to changes in the mean value of an annual index to hare abundance and to changes in the proportion of sites where disturbance occurs. The stationary distribution consists of the equilibrium proportion of sites unoccupied by eagles (e1), occupied by eagles but reproduction unsuccessful (e2), and occupied and successful reproduction (e3). For comparison, sensitivities were calculated for stationary state distributions calculated based on constant transition probabilities (e; constant) and transition probabilities that varied across time and among sites (e[T,S]; variable).
|
Lower-level parameter |
Method | Sensitivity | ||||
| e1 | e2 | e3 | OCC | RSUCC | ||
| Hare Index | Constant | -0.077 | -1.117 | 1.194 | 0.077 | 1.419 |
| Variable | -0.066 | -1.057 | 1.124 | 0.066 | 1.339 | |
| Disturbance | Constant | 0.099 | -0.060 | -0.039 | -0.099 | 0.000 |
| Variable | 0.125 | -0.076 | -0.049 | -0.125 | 0.000 | |
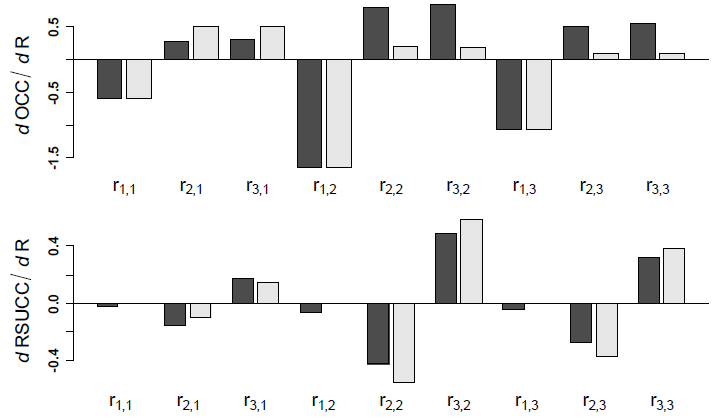
Fig. B1. Sensitivity of golden eagle occupancy (dOCC) and reproductive success (dRSUCC) to changes in state transition probabilities (ri,j). Sensitivities were calculated using both uniform (black) and proportional compensation (gray).
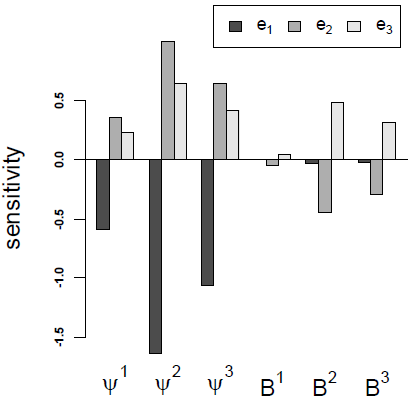
Fig. B2. Sensitivity of the golden eagle stationary state distribution (e) to changes in conditional binomial parameters used in the patch occupancy model (ψj and Bj). The stationary distribution consists of the equilibrium proportion of sites unoccupied by eagles (e1), occupied by eagles but reproduction unsuccessful (e2), and occupied and reproduction successful (e3). Transitions among states were a function of the probability a site in state j in time t was occupied in time t + 1 (ψj) and the probability that given that site was occupied that breeding was successful (Bj).
Literature Cited
Martin, J., McIntyre, C.L., Hines, J.E., Nichols, J.D., Schmutz, J.A., & MacCluskie, M.C. 2009. Dynamic multistate site occupancy models to evaluate hypotheses relevant to conservation of Golden Eagles in Denali National Park, Alaska. Biological Conservation 142:2726–2731.