Appendix C. The influence of variation in species richness on simulated turnover patterns.
The theoretical framework we developed for linking patterns of pairwise turnover and the slope of the species-area relationship depends upon an assumption that richness does not vary systematically across the four quadrats under consideration. However, we acknowledge that for many empirical systems this assumption is likely false. Therefore, we wished to quantify the influence that variation in richness may have on empirical patterns using a simulation experiment.
We choose to use input values that were relevant to our empirically observed values; therefore, we varied α from 40 to 80 but α = 60, we varied γ from 80 to 120, and we forced pairs of quadrats to differ from one another in richness across a range from 0 species different to as many as 40 species different. Quadrat richness varied from 0 to 80. For each set of these inputs we randomly assembled 1000 communities. All γ species had an equal likelihood of occurring in a given quadrat; however, to maintain α and γ across a set of four quadrats we set several limiting constraints that caused observed occupancy to deviate from uniformity.
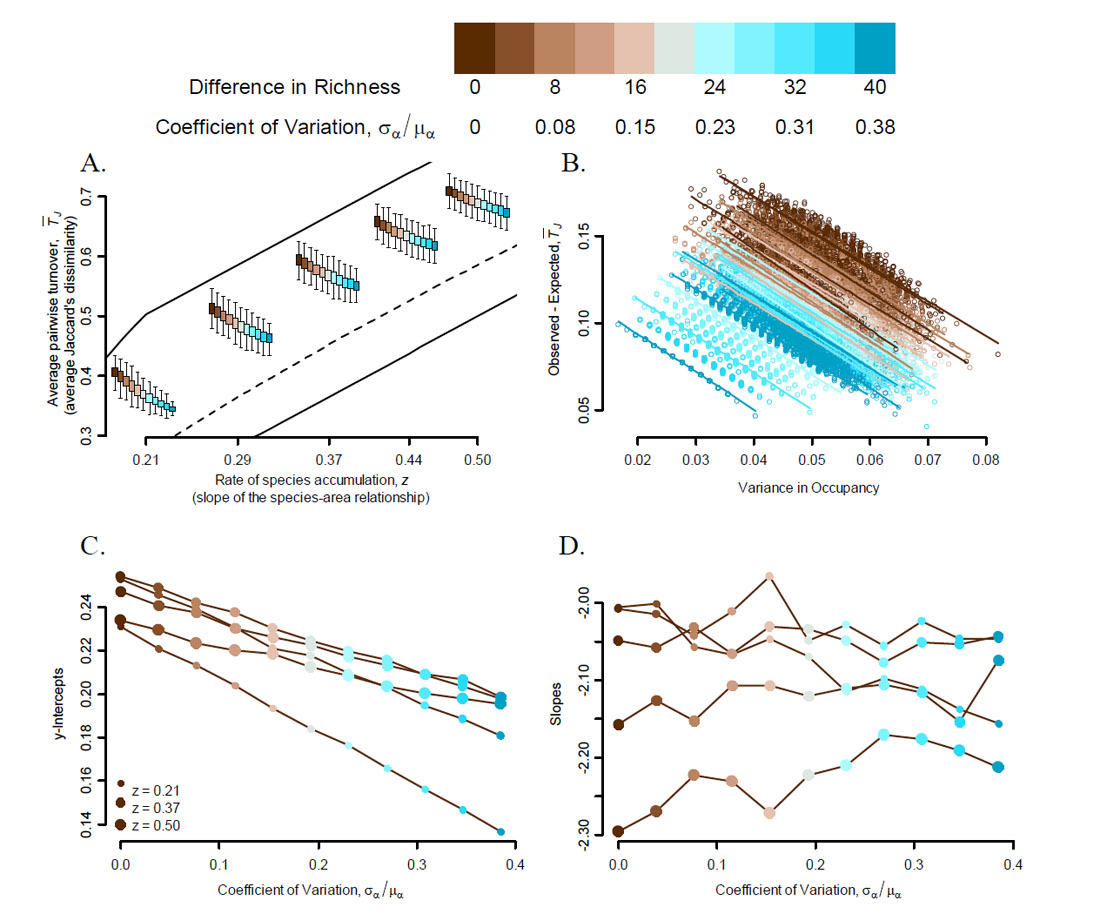
These simulations resulted in communities with five different rates of species accumulation (Fig. C1–A). At a given rate of species accumulation (z), average pairwise turnover (TJ) was negatively related to both variance in richness and occupancy (Fig. C1–A,B). We were particularly interested in examining how variance in richness would influence the linear relationship between deviance from scale invariance and variance in occupancy – a key result of our empirical patterns (Fig. C1–B). The simulated communities indicated that the intercepts of linear regression fits are negatively influenced by variance in richness (Fig. C1–C), but that regression slopes do not vary systematically as a function of variance in richness (Fig. C1-D). Additional simulations (not shown) demonstrated that these general results were robust to the value of α given comparable coefficients of variation in richness.
Here we wish to note that our simulation results may only apply to a potentially small portion of parameter space, and additional analyses are necessary to fully understand the complexities of how variance in occupancy and the CV in richness compete with one another to determine TJ for a given z-value. However, although our simulations were not exhaustive; they did produce empirically realistic values of deviance from scale-invariance and variance in occupancy. Thus these results provide guidance for interpreting our empirical patterns.
|
|
| FIG. C1. This four panel figure illustrates how increasing variance in species richness (brown-to-blue colors along the colorramp at top) influences average pairwise turnover (TJ) at five rates of species accumulation (z) for randomly assembled communities in which α = 60. Panel A displays a separate boxplot (i.e., quartiles of TJ) for each level of variance in richness (see color ramp at top of figure) for a given z-value. The solid black lines are the boundaries of the constraint space, and the dashed line is the model of scale-invariant turnover. Panel B displays the deviance from scale-invariance for each combination of a level of variance in richness and z-value. Fitted regression lines are also displayed for a subset of these patterns. The intercept and slope of the full set of regression lines which were fit to the data in panel B are displayed as a function of the magnitude of variance in richness in panels C and D respectively. The size of the circles in panels C and D indicate how large the z-value was for that group (see legend in panel C). |