Appendix B. Posterior predictive checks.
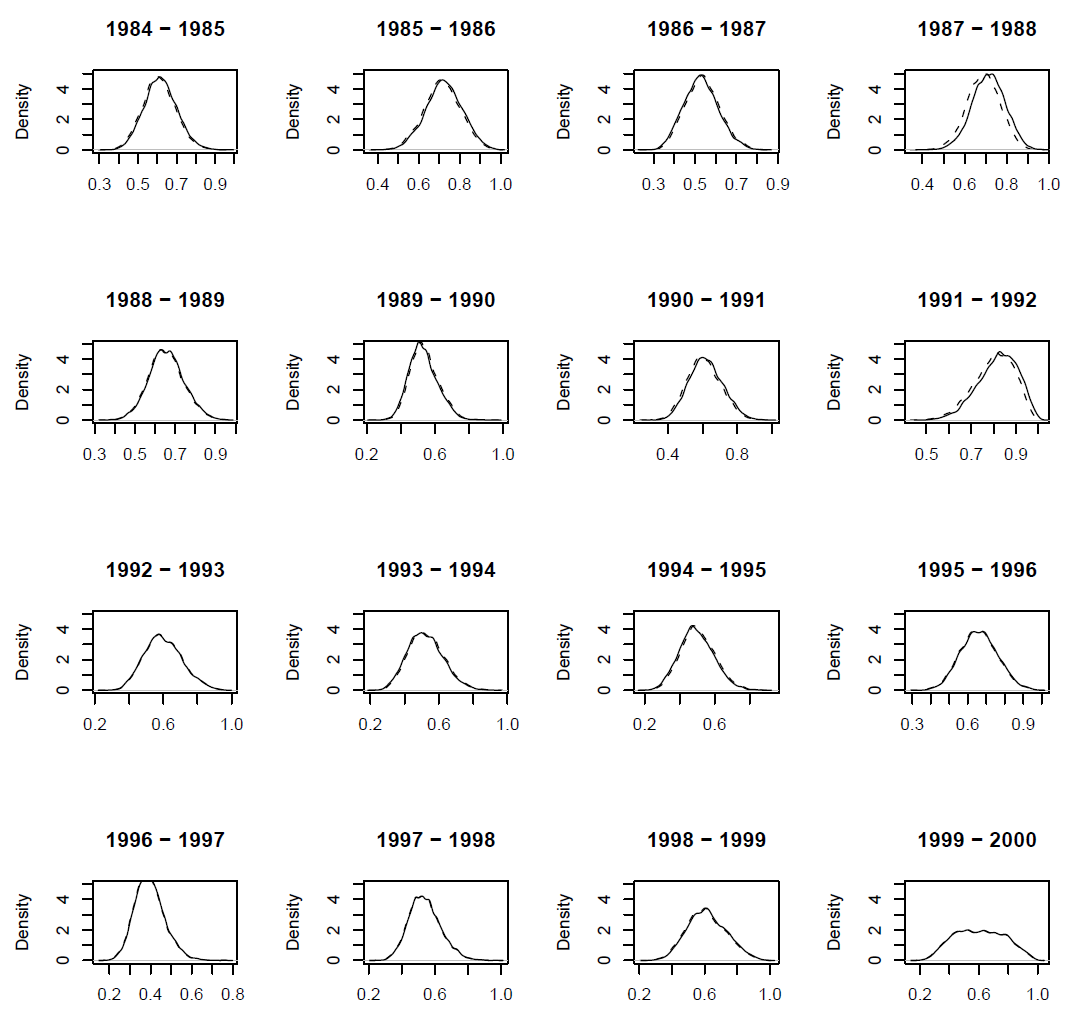
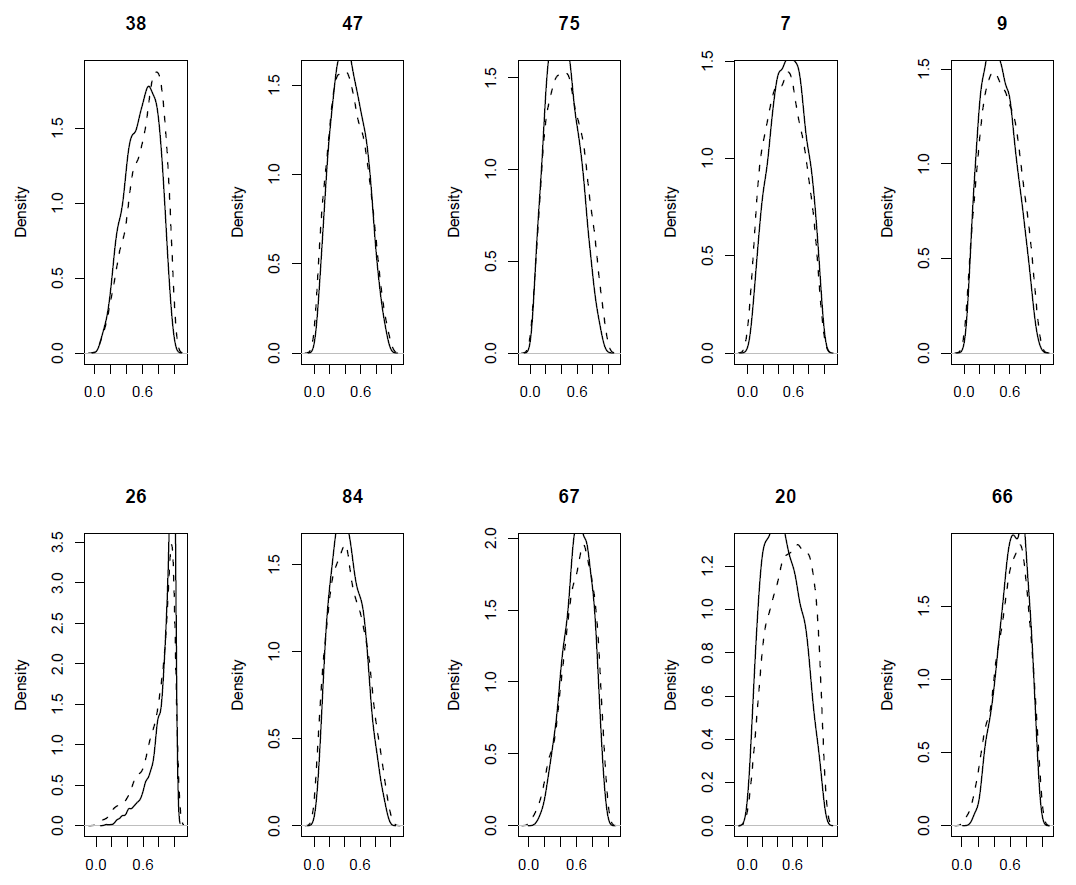
We assessed the fit of our model using posterior predictive checking as proposed by Gelman et al. (1996). This procedure is a Bayesian counterpart of the classical tests for goodness-of-fit based on the comparison of replicated data generated from the posterior distribution of the parameters to observed data. To our knowledge, no generic procedure is yet available for processing predictive checks on state–space models. Because plots of binary variables (survival or not) are difficult to interpret, we also compared the estimated survival probabilities to the replicated values of survival probability. Similarly, we compared the other observed variables with replicated observations simulated from the corresponding posterior distributions.
FIG. B1. Blackbird case study: Estimated survival probability (solid line) vs. replicated values of survival probability (dotted line) for ten individuals. Ten individuals were picked at random.
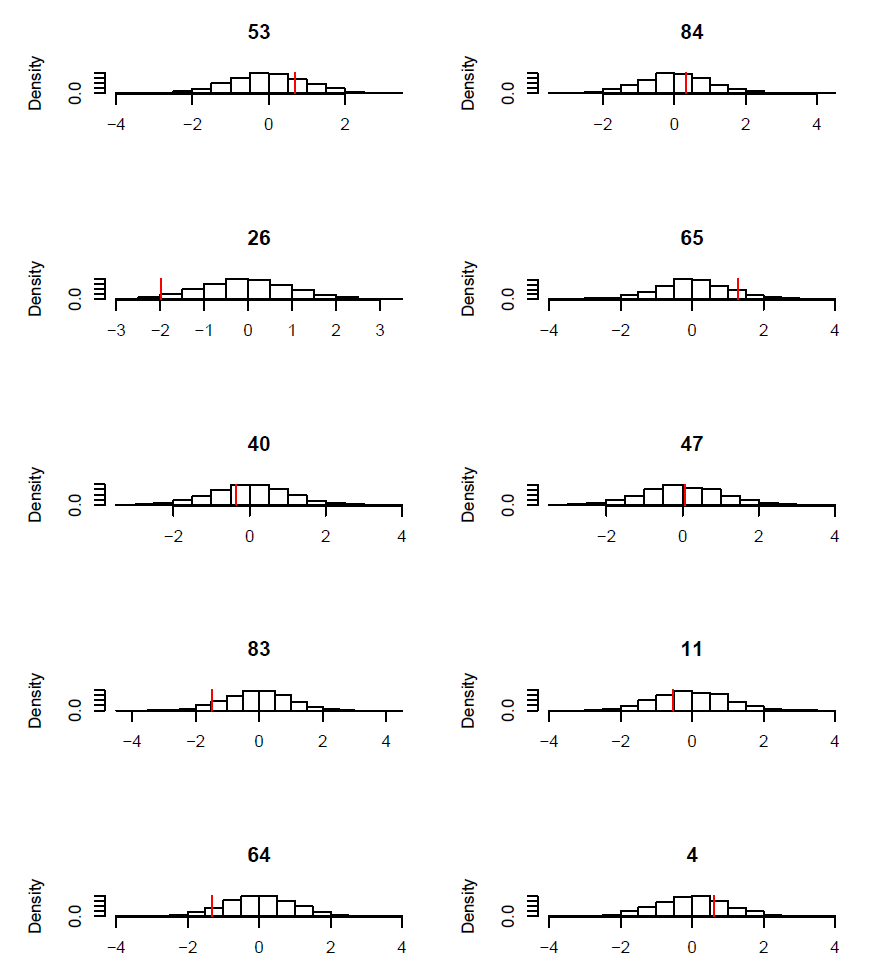
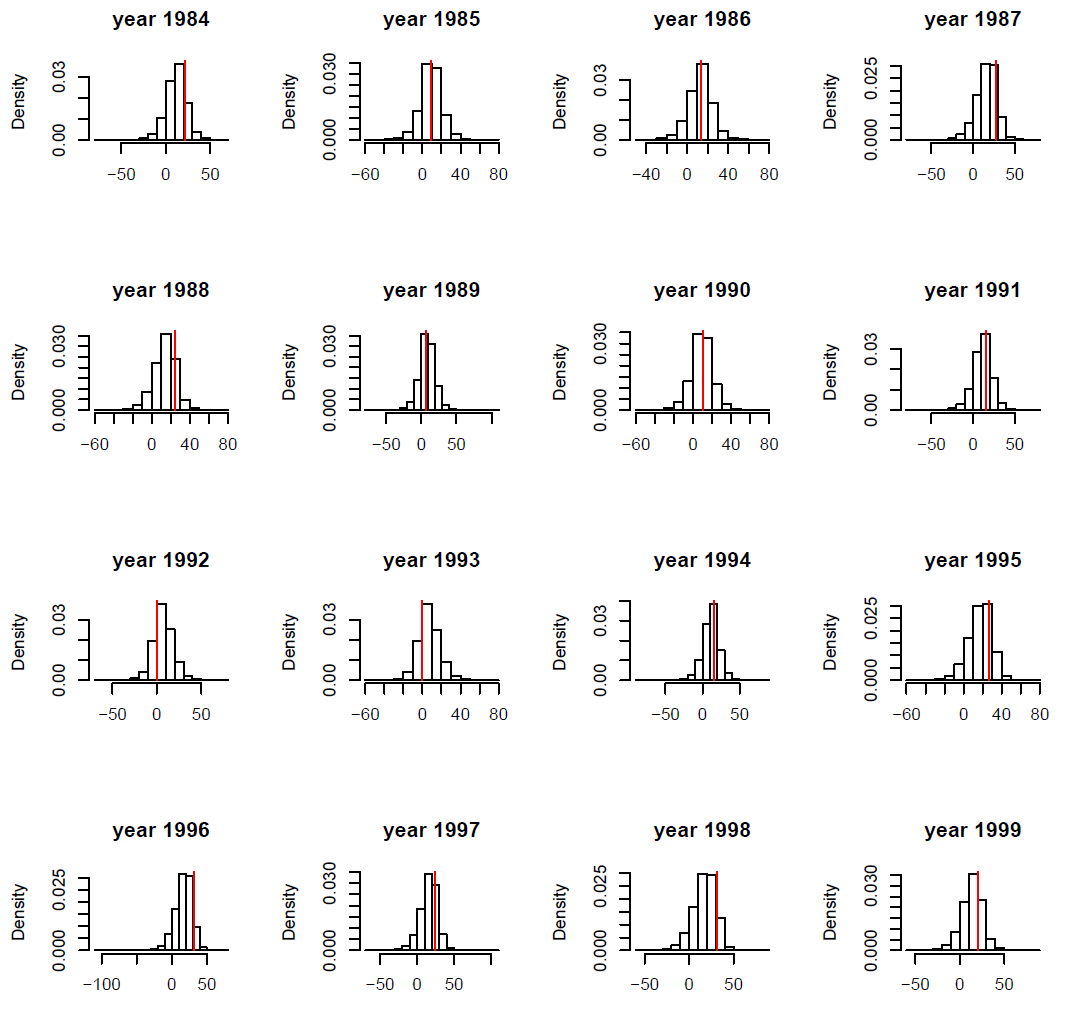
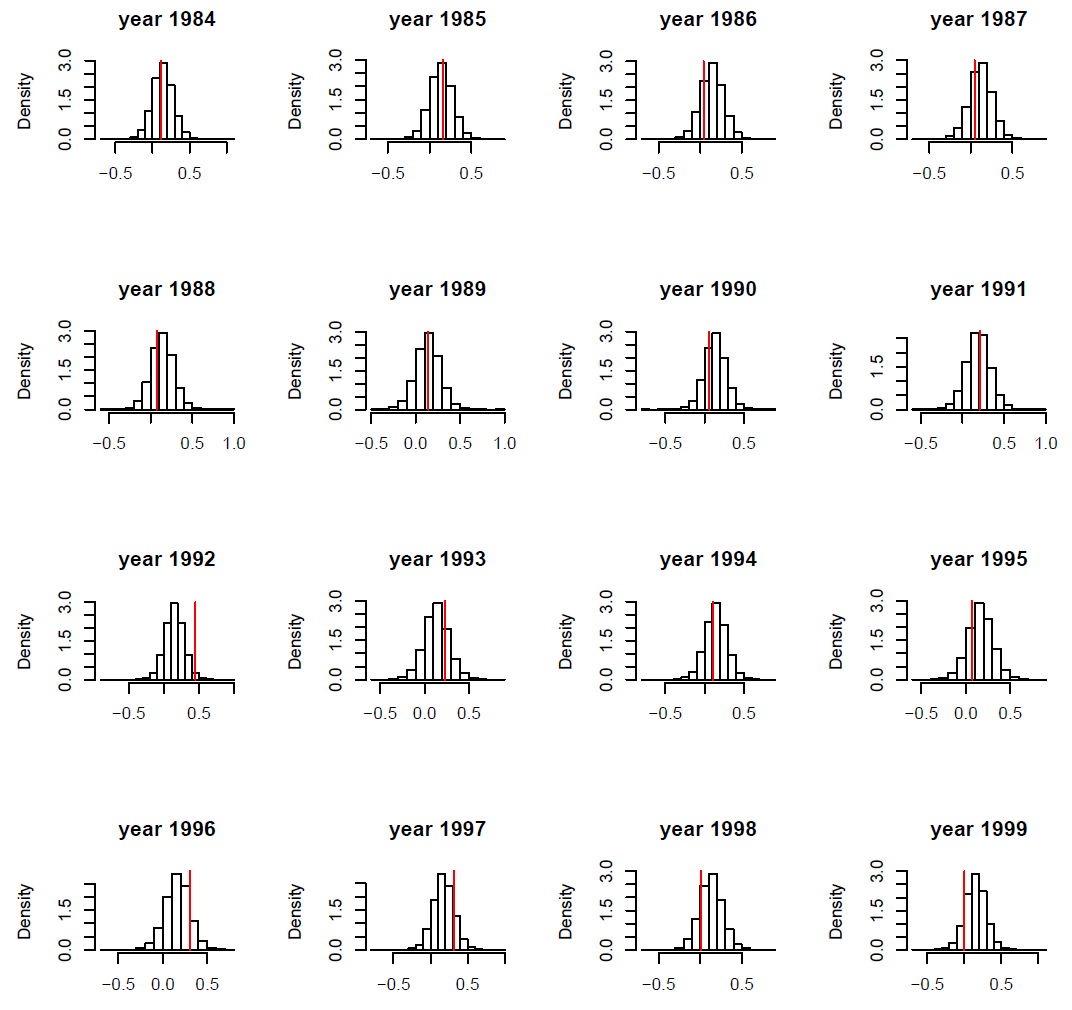
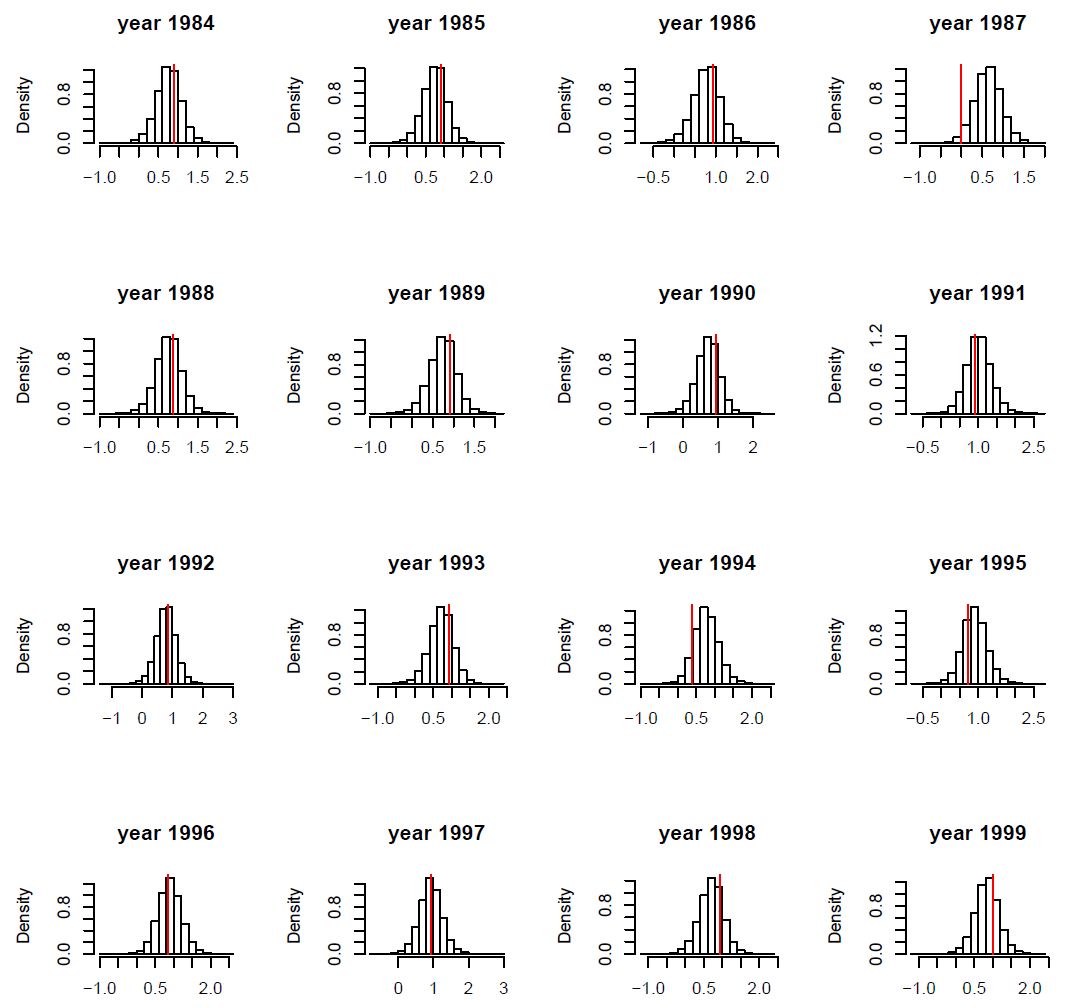
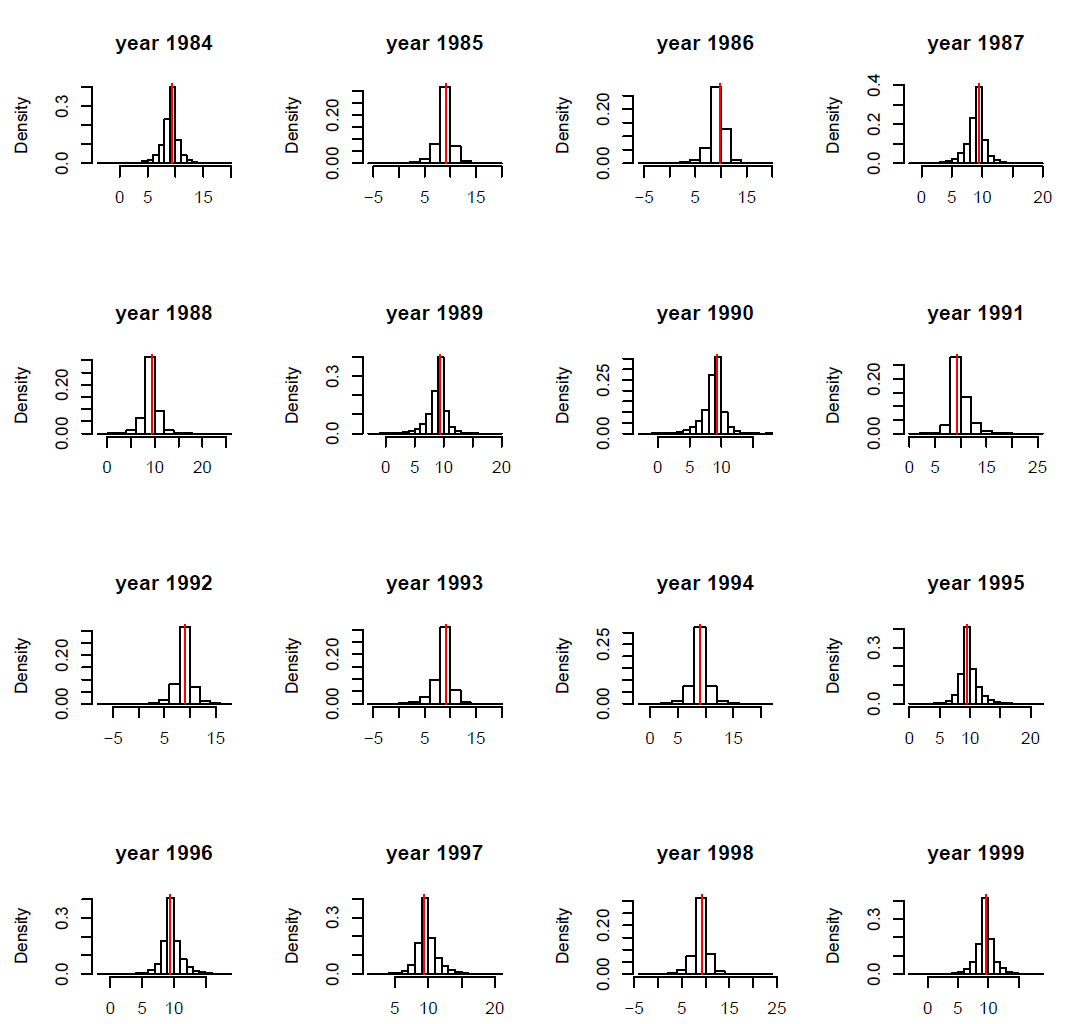
FIG. B2. Blackbird case study: Observed tarsus length x1 (red vertical bar) vs. histogram of simulated values from the corresponding posterior distribution for ten individuals. Ten individuals were picked at random.
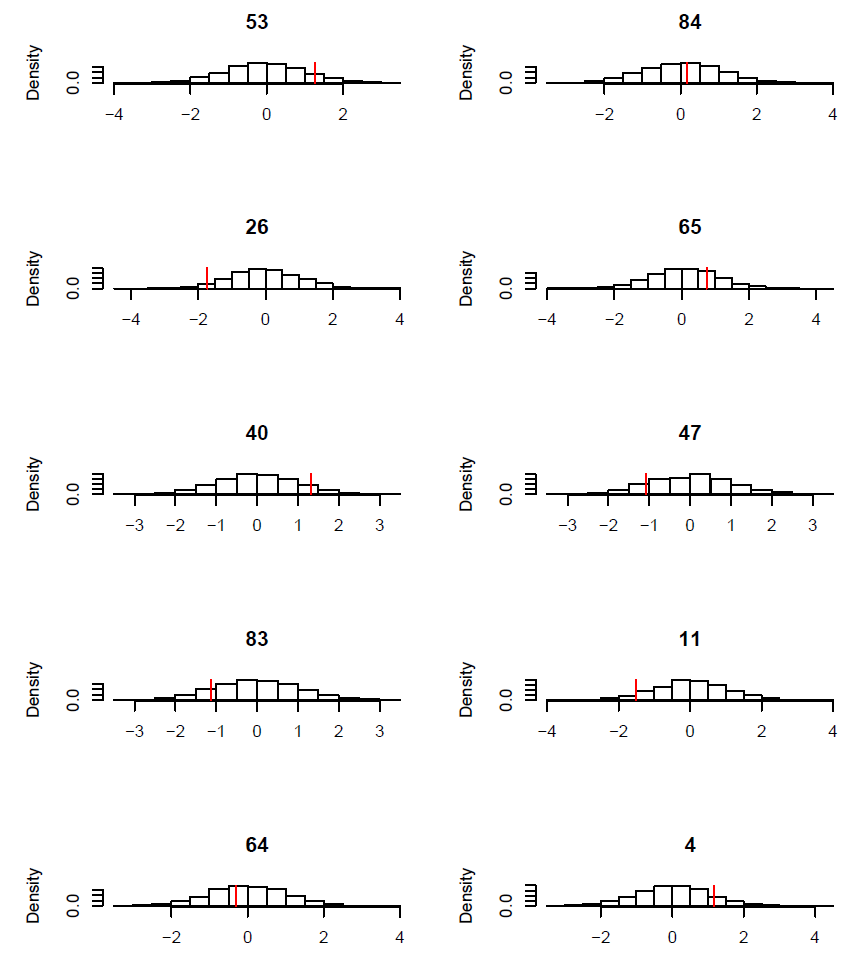
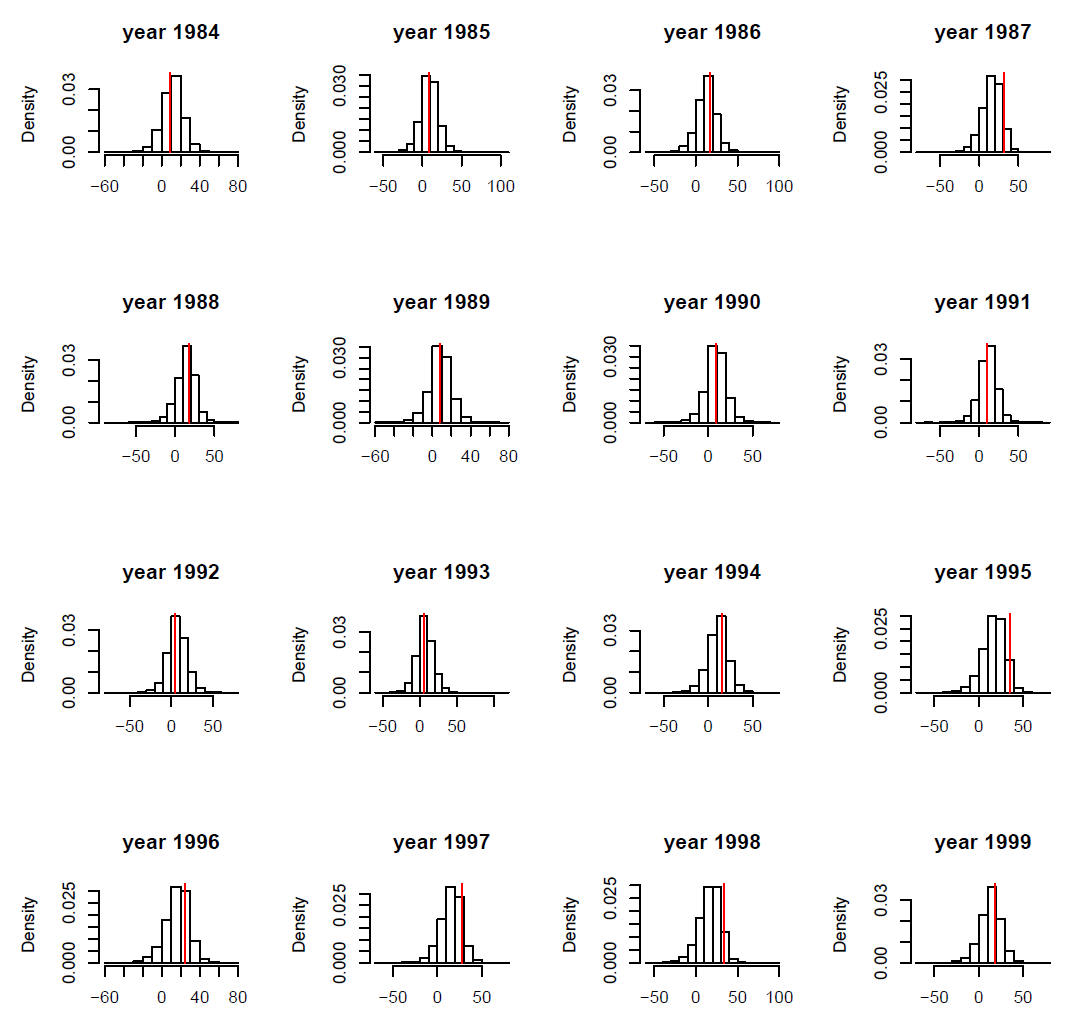
FIG. B3. Blackbird case study: Observed phalanx length x2 (red vertical bar) vs. histogram of simulated values from the corresponding posterior distribution for ten individuals. Ten individuals were picked at random.
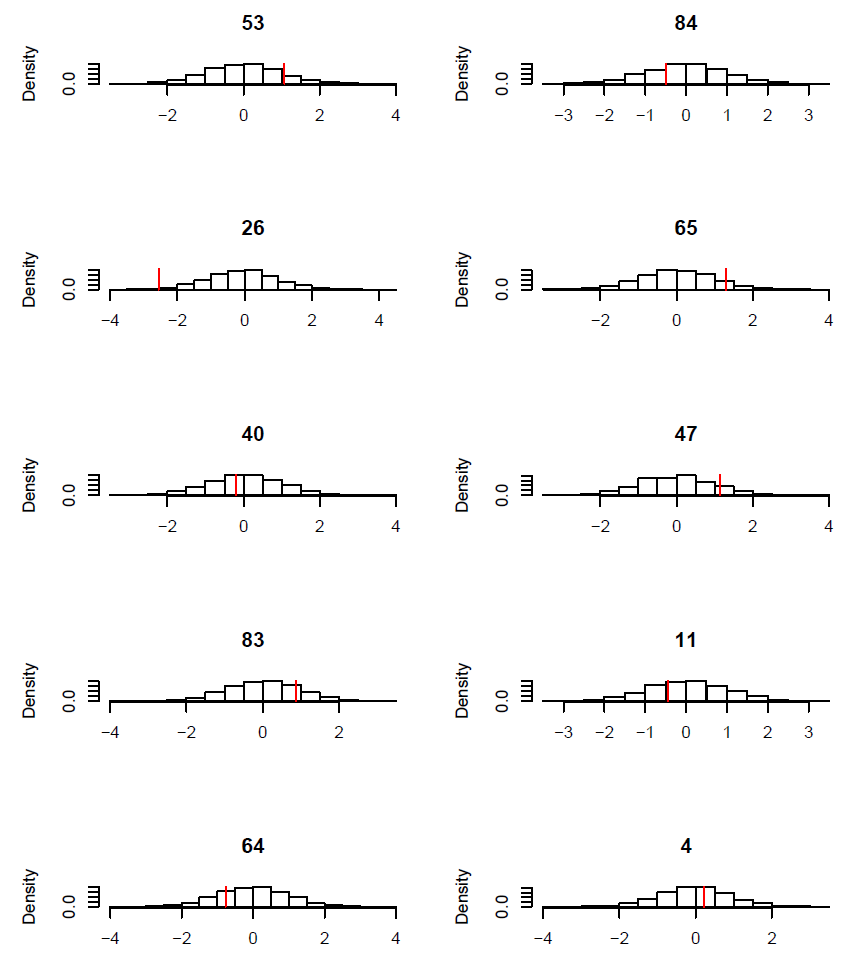
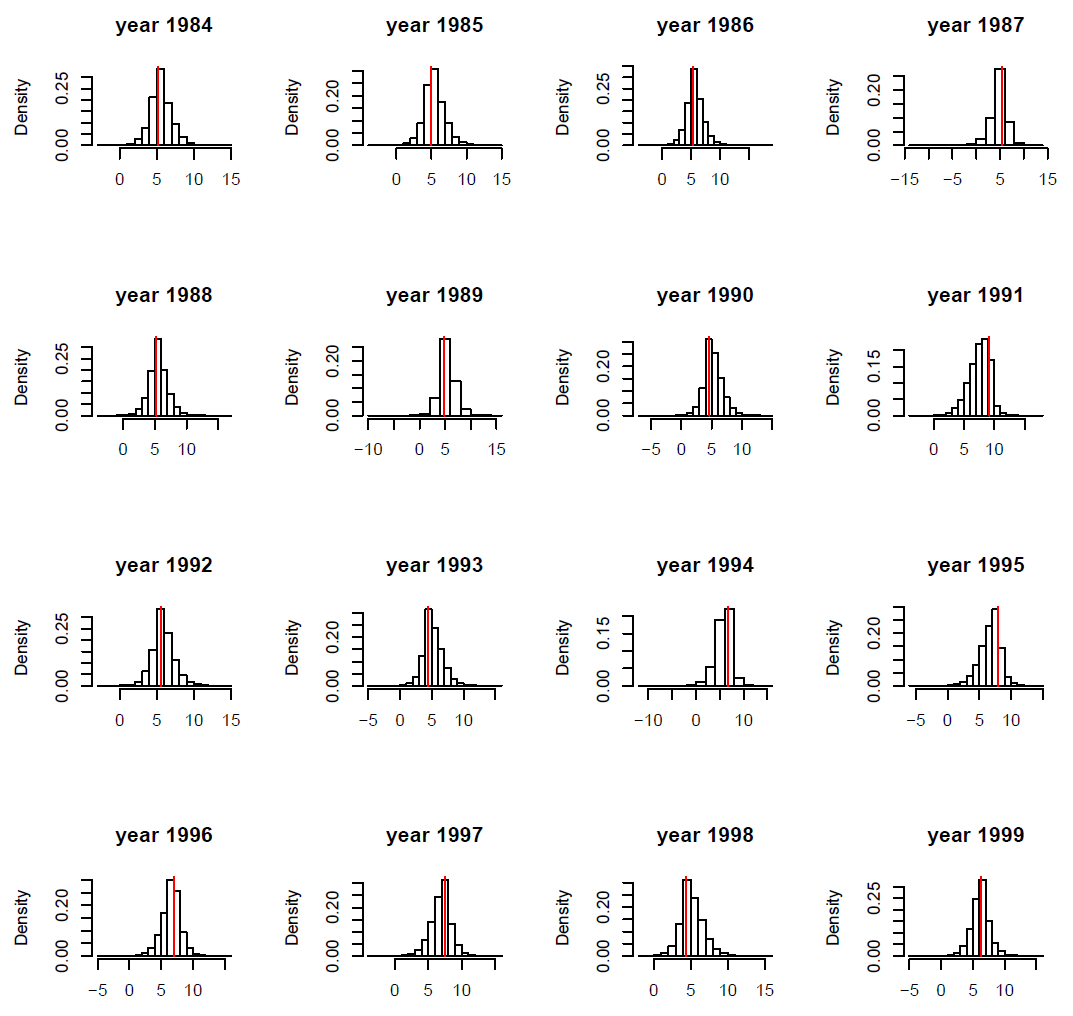
FIG. B4. Blackbird case study: Observed wing length x3 (red vertical bar) vs. histogram of simulated values from the corresponding posterior distribution for ten individuals. Ten individuals were picked at random.
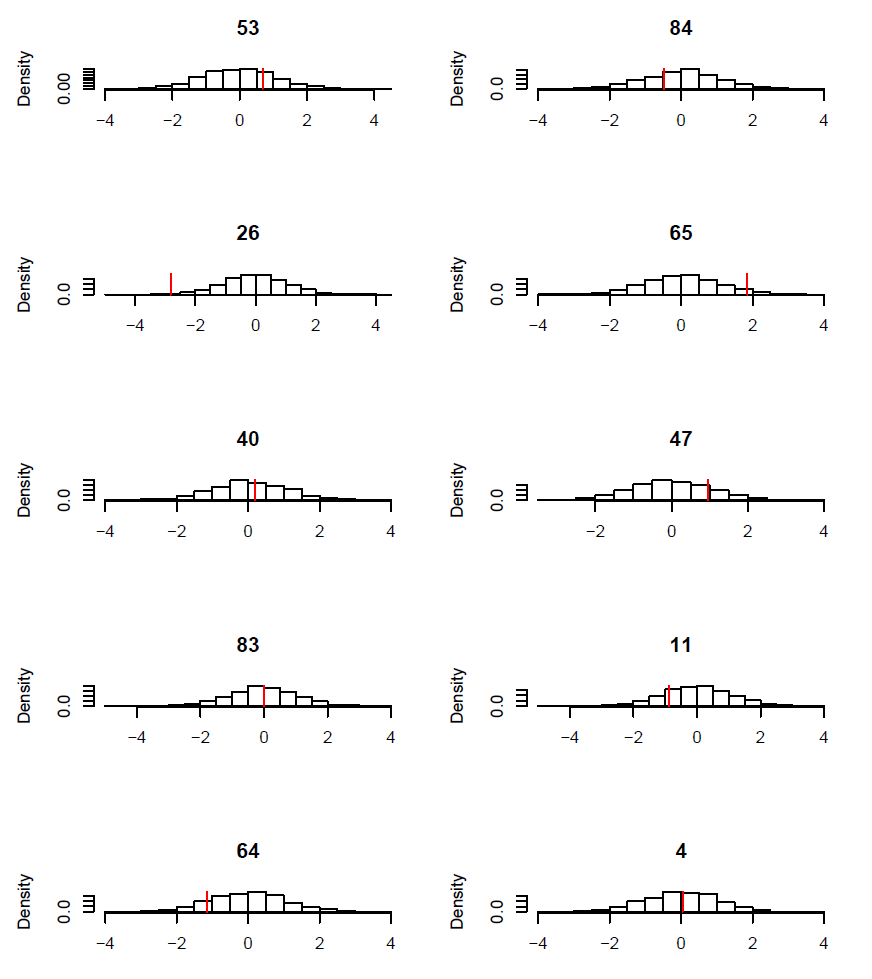
FIG. B5. Blackbird case study: Observed rectrice length x4 (red vertical bar) vs. histogram of simulated values from the corresponding posterior distribution for ten individuals. Ten individuals were picked at random.
FIG. B6. Blue tit case study: Estimated survival probability (solid line) vs. replicated values of survival probability (dotted line) for ten individuals.
FIG. B7. Blue tit case study: Observed peak width x1 (red vertical bar) vs. histogram of simulated values from the corresponding posterior distribution for ten individuals.
FIG. B8. Blue tit case study: Observed peak mode x2 (red vertical bar) vs. histogram of simulated values from the corresponding posterior distribution for ten individuals.
FIG. B9. Blue tit case study: Observed clutch size y1 (red vertical bar) vs. histogram of simulated values from the corresponding posterior distribution for ten individuals.
FIG. B10. Blue tit case study: Observed chick weight y2 (red vertical bar) vs. histogram of simulated values from the corresponding posterior distribution for ten individuals.
FIG. B11. Blue tit case study: Observed chick survival y3 (red vertical bar) vs. histogram of simulated values from the corresponding posterior distribution for ten individuals.
FIG. B12. Blue tit case study: Observed adult weight y4 (red vertical bar) vs. histogram of simulated values from the corresponding posterior distribution for ten individuals.
LITERATURE CITED
Gelman, A., X. Meng, and H. S. Stern. 1996. Posterior predictive assessment of model fitness via realized discrepancies (with discussion). Statistica Sinica, 6:733–807.