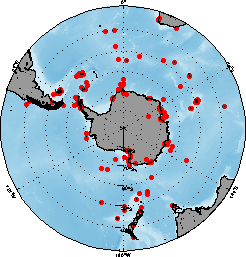
FIG. 1a. Geographic distribution of the diet sample records in this data set.
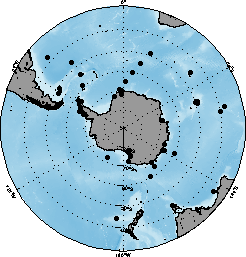
FIG. 1b. Geographic distribution of the stable isotope sample records in this data set.
Ben Raymond, Michelle Marshall, Gabrielle Nevitt, Chris L. Gillies, John van den Hoff, Jonathan S. Stark, Marcel Losekoot, Eric J. Woehler, and Andrew J. Constable. 2011. A Southern Ocean dietary database. Ecology 92:1188.
METADATA
CLASS I. DATA SET DESCRIPTORS
A. Data set identity: A Southern Ocean dietary database
B. Data set identification code
C. Data set description
Principal Investigators:
Ben Raymond, Australian Antarctic Division, Department for Sustainability, Environment, Water, Population and Communities, Australian Government, Channel Highway, Kingston 7050 Australia, and Antarctic Climate and Ecosystems Cooperative Research Centre, Hobart 7001 Australia
Michelle Marshall, Antarctic Climate and Ecosystems Cooperative Research Centre, Hobart 7001 Australia, and Australian Antarctic Division, Department for Sustainability, Environment, Water, Population and Communities, Australian Government, Channel Highway, Kingston 7050 Australia
Gabrielle Nevitt, Section of Neurobiology, Physiology and Behavior, University of California, Davis, California 95616, USA, and Bodega Marine Laboratory, 2099 Westside Road, Bodega Bay, California 94923 USA
Chris L. Gillies, National Marine Science Centre, Southern Cross University, Coffs Harbour 2450 Australia, and Australian Antarctic Division, Department for Sustainability, Environment, Water, Population and Communities, Australian Government, Channel Highway, Kingston 7050 Australia
John van den Hoff, Australian Antarctic Division, Department for Sustainability, Environment, Water, Population and Communities, Australian Government, Channel Highway, Kingston 7050 Australia
Jonathan S. Stark, Australian Antarctic Division, Department for Sustainability, Environment, Water, Population and Communities, Australian Government, Channel Highway, Kingston 7050 Australia
Marcel Losekoot, Bodega Marine Laboratory, University of California, California 94923 USA, and Department of Avian Sciences, University of California, Davis, California 95616 USA
Eric J. Woehler, School of Zoology, University of Tasmania, Private Bag 5, Hobart 7001 Australia
Andrew J. Constable, Australian Antarctic Division, Department for Sustainability, Environment, Water, Population and Communities, Australian Government, Channel Highway, Kingston 7050 Australia, and Antarctic Climate and Ecosystems Cooperative Research Centre, Hobart 7001 Australia
Abstract: Knowledge of the trophic functioning of Southern Ocean ecosystems is critical to their understanding and management. Marine ecosystem models, often used to explore the potential impacts of human disturbance and climate change, and for fisheries stock assessments, generally rely on suitable data to underpin the parameterization of taxon attributes and diets.
Diet-related data from published and unpublished data sets and studies were collated into a single consistent data set, circum-Antarctic in scope, with two principal tables. The first table relates to direct sampling methods of dietary assessment, including gut, scat, and bolus content analyses, stomach flushing, and observed feeding, and currently comprises ~25000 records from 300 studies, and includes information on >1000 taxa. The second table is a compilation of stable isotope values (currently 1500 records from 20 studies, covering 200 taxa). Each record in these two tables includes details such as the location and date of sampling, predator size and mass, prey size and mass, and estimates of dietary importance.
The database is being actively maintained and the most recent version can be obtained from the Australian Antarctic Data Centre (http://data.aad.gov.au/aadc/trophic/) or SCAR-MarBIN (http://www.scarmarbin.be/). Taxon names were resolved against the World Register of Marine Species (http://www.marinespecies.org/).
We envisage that these data will be of interest to research groups specializing in Antarctic and Southern Ocean studies, as well as those interested in general marine trophic ecology and food web analyses.
|
|
FIG. 1a. Geographic distribution of the diet sample records in this data set. |
FIG. 1b. Geographic distribution of the stable isotope sample records in this data set. |
D. Key words: Antarctica; diet; predator; prey; Southern Ocean; stable isotope; trophic.
CLASS II. RESEARCH ORIGIN DESCRIPTORS
A. Overall project description
Identity: As above.
Originators: As above.
Period of study: 2008–present.
Objectives: To collate dietary and other trophic information relevant to Southern Ocean ecosystems.
Trophic studies of Southern Ocean ecosystems have been conducted for many decades, and data from such studies have wide utility. However, there are few publically available, consolidated repositories of such information. This database was collated with the intention of providing a data resource suitable for underpinning a range of Southern Ocean studies. It is currently being used to help parameterize marine ecosystem models, and for comparisons of Southern Ocean food webs with those from other regions of the globe.
Abstract: As above.
Sources of funding: Australian Antarctic Science program, Census of Antarctic Marine Life, National Science Foundation, Pew Fellows Program in Marine Conservation.
B. Specific subproject description
1. Site description:
Site type: Data from marine sites, and from marine predators (seabirds, seals, etc.) at coastal and sea-ice sites.
Geography: The Southern Ocean surrounds the Antarctic continent. Data from marine and coastal regions south of approximately 40°S were included here.
Habitat: Data were taken from sites across a diverse range of habitats, including pelagic, benthic, sea-ice, and subantartic island habitats.
Climate: Generally open ocean, with few land masses other than subantarctic islands. Depths are typically 3000–5000 m, with few shallow areas away from the Antarctic continental shelf regions. The waters immediately surrounding the Antarctic continent are seasonally ice-covered, with ice cover extending as far north as 55°S in some sectors. Sea surface temperatures range from about -2°C to over 15°C at 45°S. The large-scale circulation of the Southern Ocean is dominated by the Antarctic Circumpolar Current, which flows around the globe and is structured into water mass bands ("fronts") which have relatively uniform properties.
2. Experimental or sampling design
Design characteristics: NA
Permanent plots: NA
Data collection period, frequency, etc: NA
3. Research methods
Field/laboratory:
Data were collated from trophic studies of Southern Ocean marine ecosystems, including direct diet studies (gut and scat content, stomach flushing, etc.) and stable isotope studies. Data were taken from unpublished data sets held by the Australian Antarctic Data Centre, and from published studies. Data were transcribed to standardized Excel templates, and then scripts used to load these into database tables.
Taxon names were checked against the World Register of Marine Species (WoRMS). Names not matched within WoRMS were checked against various other taxonomic references (e.g., ITIS). Uncertain species identifications (e.g. "Notothenia rossii?" or "Gymnoscopelus cf. piabilis") were assigned the genus name (e.g. "Notothenia sp."). Original names were retained in a separate column to allow future cross-checking. WoRMS identifiers (APHIA_ID numbers) were recorded with each matched taxon.
A range of manual and automated checks were used to ensure that the entered data were as accurate as possible. These included visual checking of transcribed values, checking of row or column sums against known totals, and checking for values outside of allowed ranges. Suspicious entries were re-checked against original source. Apparent errors that could not be resolved were marked as such in the QUALITY_FLAG column, with the reason in the NOTES column.
Instrumentation: NA
Taxonomy and systematics: See Research methods, above. The World Register of Marine Species (WoRMS) was used as the primary reference for checking taxon names.
Permit history: NA
Legal/organizational requirements: NA
4. Project personnel
As above.
CLASS III. DATA SET STATUS AND ACCESSIBILITY
A. Status
Latest update: 17 January 2011.
Latest Archive date: 17 January 2011.
Metadata status: Metadata are complete and up to date.
Data verification: See CLASS II, section 3, Research Methods.
B. Accessibility
Storage location and medium: (Ecological Society of America Data Archives [Ecological Archives], URL published in each issue of its journals).
Australian Antarctic Data Centre
SCAR-MarBIN
Contact person: Ben Raymond, Australian Antarctic Division, Channel Highway, Kingston 7050 Australia. Email ben dot raymond at aad dot gov dot au
Copyright restrictions: None.
Proprietary restrictions: None.
Citation: Please cite these data when using. In general, use this citation:
Raymond, B., M. Marshall, G. Nevitt, C. L. Gillies, J. van den Hoff, J. S. Stark, M. Losekoot, E. J. Woehler, and A. J. Constable. 2011. A Southern Ocean dietary database. Ecology Vol:pp. http://data.aad.gov.au/aadc/trophic/
If you have used data from a small number of individual sources (check the 'SOURCE_ID' values of the data you used), please cite the original data sources and additionally acknowledge this database. For example:
Smith, J. 2008. On the use of stable isotopes. Journal of Stable Isotope Stuff 123:100–110. Data obtained from http://data.aad.gov.au/aadc/trophic/
Costs: None.
CLASS IV. DATA STRUCTURAL DESCRIPTORS
A. Data Set File
Identity: diet.csv
Size: 25793 records, 8401 kB.
Format and storage mode: ASCII text, comma separated.
Header information: The first row of the file contains the variable names below.
Alphanumeric attributes: Mixed
Special characters/fields: None.
Authentication procedures: None.
B. Variable information
Variable name |
Variable definition |
Units |
Storage type |
Precision |
No Data Value |
Variable codes and definitions |
| LINK_ID | The unique identifier of this record | Integer | int32 | |||
| SOURCE_ID | The reference number of the source of this data record. The list of references is provided in a separate table and also kept at: http://data.aad.gov.au/aadc/trophic/?tab=3 | Integer | int32 | |||
| LOCATION | The name of the location at which the data was collected | String | ||||
| WEST | The westernmost longitude of the sampling region, in decimal degrees (negative values indicate western hemisphere longitudes) | Degrees | Float | double | ||
| EAST | The easternmost longitude of the sampling region, in decimal degrees (negative values indicate western hemisphere longitudes) | Degrees | Float | double | ||
| SOUTH | The southernmost latitude of the sampling region, in decimal degrees (negative values indicate southern hemisphere latitudes) | Degrees | Float | double | ||
| NORTH | The northernmost latitude of the sampling region, in decimal degrees (negative values indicate southern hemisphere latitudes) | Degrees | Float | double | ||
| OBSERVATION_DATE_START | The start of the sampling period (UTC) | String | Format dd/mm/yyyy | |||
| OBSERVATION_DATE_END | The end of the sampling period (UTC). If sampling was carried out over multiple seasons (e.g., during January of 2002 and January of 2003), these dates will indicate the first and last dates (as if the sampling was carried out from 1-Jan-2002 to 31-Jan-2003) | Format dd/mm/yyyy | ||||
| ALTITUDE_MIN | The minimum altitude of the sampling region, in meters (if applicable) | m | Float | double | ||
| ALTITUDE_MAX | The maximum altitude of the sampling region, in meters (if applicable) | m | Float | double | ||
| DEPTH_MIN | The shallowest depth of the sampling, in meters (if applicable) | m | Float | double | ||
| DEPTH_MAX | The deepest depth of the sampling, in meters (if applicable) | m | Float | double | ||
| PREDATOR_NAME_ORIGINAL | The name of the predator, as it appeared in the original source | String | ||||
| PREDATOR_NAME | The scientific name of the predator (corrected, if necessary) | String | ||||
| PREDATOR_COMMON_NAME | The common name of the predator (from the WoRMS taxonomic register) | String | ||||
| PREDATOR_APHIA_ID | The numeric identifier of the predator in the WoRMS taxonomic register | Integer | int32 | Values correspond to APHIA_ID numbers from the WoRMS taxonomic register | ||
| PREDATOR_LIFE_STAGE | Life stage of the predator | String | e.g., "adult", "chick", "larva". Values "C1"-"C3" refer to calyptopis larval stages of euphausiids. "F1"-"F6" refer to furcilia larval stages of euphausiids. "N1"-"N6" refer to nauplius stages of crustaceans. "Copepodite 1"-"Copepodite 6" refer to developmental stages of copepodites | |||
| PREDATOR_BREEDING_STAGE | Stage of the breeding season of the predator, if applicable | String | e.g., "brooding", "chick rearing", "nonbreeding", "posthatching" | |||
| PREDATOR_SEX | Sex of the predator | String | "male", "female", "both", or "unknown" | |||
| PREDATOR_SAMPLE_COUNT | The number of predators for which data are given. If (say) 50 predators were caught but only 20 analyzed, this column will contain 20 | Integer | int32 | |||
| PREDATOR_TOTAL_COUNT | The total number of predators sampled. If (say) 50 predators were caught but only 20 analysed, this column will contain 50 | Integer | int32 | |||
| PREDATOR_SAMPLE_ID | The identifier of this predator sample. PREDATOR_SAMPLE_ID values are unique within a source (i.e., SOURCE_ID, PREDATOR_SAMPLE_ID pairs are globally unique). Rows with the same SOURCE_ID and PREDATOR_SAMPLE_ID values relate to the same predator individual or population, and so can be combined (e.g., for prey diversity analyses). Subsamples are indicated by a decimal number S.nnn, where S is the parent PREDATOR_SAMPLE_ID, and nnn (001-999) is the subsample number. Studies will often report detailed prey information for a large sample, and also report prey information for various subsamples of that sample (e.g., broken down by predator sex, or sampling season). | Float | double | |||
| PREDATOR_SIZE_MIN | The minimum size of the predators in the sample | See PREDATOR_SIZE_UNITS | Float | double | ||
| PREDATOR_SIZE_MAX | The maximum size of the predators in the sample | See PREDATOR_SIZE_UNITS | Float | double | ||
| PREDATOR_SIZE_MEAN | The mean size of the predators in the sample | See PREDATOR_SIZE_UNITS | Float | double | ||
| PREDATOR_SIZE_SD | The standard deviation of the size of the predators in the sample | See PREDATOR_SIZE_UNITS | Float | double | ||
| PREDATOR_SIZE_UNITS | The units of size | String | Current values "mm", "cm", "m" | |||
| PREDATOR_SIZE_NOTES | Notes on the predator size information, including a definition of what the size value represents (e.g., "total length", "standard length") | String | ||||
| PREDATOR_MASS_MIN | The minimum mass of the predators in the sample | See PREDATOR_MASS_UNITS | Float | double | ||
| PREDATOR_MASS_MAX | The maximum mass of the predators in the sample | See PREDATOR_MASS_UNITS | Float | double | ||
| PREDATOR_MASS_MEAN | The mean mass of the predators in the sample | See PREDATOR_MASS_UNITS | Float | double | ||
| PREDATOR_MASS_SD | The standard deviation of the mass of the predators in the sample | See PREDATOR_MASS_UNITS | Float | double | ||
| PREDATOR_MASS_UNITS | The units of mass | String | Current values "g", "kg", "t" | |||
| PREDATOR_MASS_NOTES | Notes on the predator mass information, including a definition of what the mass value represents (blank implies total body weight) | String | ||||
| PREY_NAME_ORIGINAL | The name of the prey item, as it appeared in the original source | String | ||||
| PREY_NAME | The scientific name of the prey item (corrected, if necessary) | String | ||||
| PREY_COMMON_NAME | The common name of the prey item (from the WoRMS taxonomic register) | String | ||||
| PREY_APHIA_ID | The numeric identifier of the prey item in the WoRMS taxonomic register | Integer | int32 | Values correspond to APHIA_ID numbers from the WoRMS taxonomic register | ||
| PREY_IS_AGGREGATE | "Y" indicates that this row is an aggregation of other rows in this data source. For example, a study might give a number of individual squid species records, and then an overall squid record that encompasses the individual records. Use the PREY_IS_AGGREGATE information to avoid double-counting during analyses. If there no entry in this column, it means that this information is not included anywhere else in the database and can be used freely when aggregating over taxonomic groups, for example | Character | ||||
| PREY_LIFE_STAGE | Life stage of the prey | String | e.g., "adult", "chick", "larva". | |||
| PREY_SAMPLE_COUNT | The number of prey individuals from which size and mass measurements were made (note: NOT the total number of individuals of this prey type, unless all individuals in the sample were measured) | Integer | int32 | |||
| PREY_SIZE_MIN | The minimum size of the prey in the sample | See PREY_SIZE_UNITS | Float | double | ||
| PREY_SIZE_MAX | The maximum size of the prey in the sample | See PREY_SIZE_UNITS | Float | double | ||
| PREY_SIZE_MEAN | The mean size of the prey in the sample | See PREY_SIZE_UNITS | Float | double | ||
| PREY_SIZE_SD | The standard deviation of the size of the prey in the sample | See PREY_SIZE_UNITS | Float | double | ||
| PREY_SIZE_UNITS | The units of size | String | Current values "mm", "cm", "m" | |||
| PREY_SIZE_NOTES | Notes on the prey size information, including a definition of what the size value represents (e.g., "total length", "standard length") | String | ||||
| PREY_MASS_MIN | The minimum mass of the prey in the sample | See PREY_MASS_UNITS | Float | double | ||
| PREY_MASS_MAX | The maximum mass of the prey in the sample | See PREY_MASS_UNITS | Float | double | ||
| PREY_MASS_MEAN | The mean mass of the prey in the sample | See PREY_MASS_UNITS | Float | double | ||
| PREY_MASS_SD | The standard deviation of the mass of the prey in the sample | See PREY_MASS_UNITS | Float | double | ||
| PREY_MASS_UNITS | The units of mass | String | Current values "mg", "g", "kg" | |||
| PREY_MASS_NOTES | Notes on the prey mass information, including a definition of what the mass value represents (blank implies total body weight) | String | ||||
| FRACTION_DIET_BY_WEIGHT | The fraction (by weight) of the predator diet that this prey type made up (e.g., if Euphausia superba contributed 50% of the total mass of prey items, this value would be 0.5) | Float | double | Many papers represent very small dietary contributions as "trace" or sometimes "less than 0.1%". These have been entered as -999 | ||
| FRACTION_DIET_BY_PREY_ITEMS | The fraction (by number) of prey items that this prey type made up (e.g., if 1000 Euphausia superba were found out of a total of 2000 prey items, this value would be 0.5) | Float | double | Many papers represent very small dietary contributions as "trace" or sometimes "less than 0.1%". These have been entered as -999 | ||
| FRACTION_OCCURRENCE | The number of times this prey item occurred in a predator sample, as a fraction of the number of non-empty samples (e.g., if Euphausia superba occurred in half of the non-empty stomachs examined, this value would be 0.5). Empty stomachs are ignored for the purposes of calculating fraction of occurrence. For gut content analyses (and any other study types where "no prey" can occur in a sample), the fraction of empty stomachs is also given (using prey_name "None" — e.g., if predator_total_count was 10 and 3 stomachs were empty, this will be 0.3) | Float | double | Many papers represent very small dietary contributions as "trace" or sometimes "less than 0.1%". These have been entered as -999 | ||
| QUALITATIVE_DIETARY_IMPORTANCE | Qualitative description of the dietary importance of this prey item (e.g., from comments about certain prey in the discussion text of an article), if numeric values have not been given | String | Current values are "none", "incidental", "minor", "major", "almost exclusive", "exclusive" | |||
| CONSUMPTION_RATE_MIN | The minimum consumption rate of this prey item | See CONSUMPTION_RATE_UNITS | Float | double | ||
| CONSUMPTION_RATE_MAX | The maximum consumption rate of this prey item | See CONSUMPTION_RATE_UNITS | Float | double | ||
| CONSUMPTION_RATE_MEAN | The mean consumption rate of this prey item | See CONSUMPTION_RATE_UNITS | Float | double | ||
| CONSUMPTION_RATE_SD | The standard deviation of the consumption rate of this prey item | See CONSUMPTION_RATE_UNITS | Float | double | ||
| CONSUMPTION_RATE_UNITS | The units of consumption rate | String | e.g., "kg/day" | |||
| CONSUMPTION_RATE_NOTES | Notes about the consumption rate estimates | String | ||||
| IDENTIFICATION_METHOD | How this dietary information was gathered. Multiple values can potentially be entered (separated by commas) | String | Current values include "scat content" (contents of scats), "stomach flushing" (physical sampling of the stomach contents by flushing the contents out with water), "stomach content" (physical sampling of the stomach contents from a dead animal), "regurgitate content" (physical sampling of the contents of forced or spontaneous regurgitations), "observed predation", "bolus content" (physical sampling of the contents of boluses), "nest detritus", "unknown" | |||
| QUALITY_FLAG | An indicator of the quality of this record | Character | "Q" indicates that the data are known to be questionable for some reason. The reason should be in the notes column. "G" indicates good data | |||
| IS_SECONDARY_DATA | An indicator of whether this record was entered from its primary source, or from a secondary citation | Character | "Y" here indicates that the data actually came from another paper and were being reported in this paper as secondary data. Secondary data records are likely to be removed at a later date and replaced with information from the original source | |||
| NOTES | Any other notes | String | ||||
| LAST_MODIFIED | The date of last modification of this record | String | Format dd/mm/yyyy HH:MM:SS PM |
A. Data Set File
Identity: isotopes.csv
Size: 1477 records, 344kB.
Format and storage mode: ASCII text, comma separated.
Header information: The first row of the file contains the variable names below.
Alphanumeric attributes: Mixed
Special characters/fields: None.
Authentication procedures: None.
B. Variable information
Variable name |
Variable definition |
Units |
Storage type |
Precision |
No Data Value |
Variable codes and definitions |
| RECORD_ID | The unique identifier of this record | Integer | int32 | |||
| SOURCE_ID | The reference number of the source of this data record. The list of references is provided in a separate table and also kept at: http://data.aad.gov.au/aadc/trophic/?tab=3 | Integer | int32 | |||
| LOCATION | The name of the location at which the data was collected | String | ||||
| WEST | The westernmost longitude of the sampling region, in decimal degrees (negative values indicate western hemisphere longitudes) | Degrees | Float | double | ||
| EAST | The easternmost longitude of the sampling region, in decimal degrees (negative values indicate western hemisphere longitudes) | Degrees | Float | double | ||
| SOUTH | The southernmost latitude of the sampling region, in decimal degrees (negative values indicate southern hemisphere latitudes) | Degrees | Float | double | ||
| NORTH | The northernmost latitude of the sampling region, in decimal degrees (negative values indicate southern hemisphere latitudes) | Degrees | Float | double | ||
| OBSERVATION_DATE_START | The start of the sampling period (UTC) | String | Format dd/mm/yyyy | |||
| OBSERVATION_DATE_END | The end of the sampling period (UTC). If sampling was carried out over multiple seasons (e.g., during January of 2002 and January of 2003), these dates will indicate the first and last dates (as if the sampling was carried out from 1-Jan-2002 to 31-Jan-2003) | Format dd/mm/yyyy | ||||
| ALTITUDE_MIN | The minimum altitude of the sampling region, in meters (if applicable) | m | Float | double | ||
| ALTITUDE_MAX | The maximum altitude of the sampling region, in meters (if applicable) | m | Float | double | ||
| DEPTH_MIN | The shallowest depth of the sampling, in meters (if applicable) | m | Float | double | ||
| DEPTH_MAX | The deepest depth of the sampling, in meters (if applicable) | m | Float | double | ||
| TAXON_NAME_ORIGINAL | The name of the taxon, as it appeared in the original source | String | ||||
| TAXON_NAME | The scientific name of the taxon (corrected, if necessary) | String | ||||
| TAXON_COMMON_NAME | The common name of the taxon (from the WoRMS taxonomic register) | String | ||||
| TAXON_APHIA_ID | The numeric identifier of the taxon in the WoRMS taxonomic register | Integer | int32 | Values correspond to APHIA_ID numbers from the WoRMS taxonomic register | ||
| TAXON_LIFE_STAGE | Life stage of the taxon | String | e.g., adult, chick, larva. Values "C1"-"C3" refer to calyptopis larval stages of euphausiids. "F1"-"F6" refer to furcilia larval stages of euphausiids. "N1"-"N6" refer to nauplius stages of crustaceans. "Copepodite 1"-"Copepodite 6" refer to developmental stages of copepodites | |||
| TAXON_BREEDING_STAGE | Stage of the breeding season of the taxon, if applicable | String | e.g., "lactating", "weaning", "chick rearing" | |||
| TAXON_SEX | Sex of the taxon | String | "male", "female", "both", or "unknown" | |||
| TAXON_SAMPLE_COUNT | The number of samples from which size and stable isotope measurements were made | Integer | int32 | |||
| TAXON_SIZE_MIN | The minimum size of the individuals in the sample | See TAXON_SIZE_UNITS | Float | double | ||
| TAXON_SIZE_MAX | The maximum size of the individuals in the sample | See TAXON_SIZE_UNITS | Float | double | ||
| TAXON_SIZE_MEAN | The mean size of the individuals in the sample | See TAXON_SIZE_UNITS | Float | double | ||
| TAXON_SIZE_SD | The standard deviation of the size of the individuals in the sample | See TAXON_SIZE_UNITS | Float | double | ||
| TAXON_SIZE_UNITS | The units of size | String | Current values "mm", "m" | |||
| TAXON_SIZE_NOTES | Notes on the size information, including a definition of what the size value represents (e.g., "total length", "standard length") | String | ||||
| TAXON_MASS_MIN | The minimum mass of the individuals in the sample | See TAXON_MASS_UNITS | Float | double | ||
| TAXON_MASS_MAX | The maximum mass of the individuals in the sample | See TAXON_MASS_UNITS | Float | double | ||
| TAXON_MASS_MEAN | The mean mass of the individuals in the sample | See TAXON_MASS_UNITS | Float | double | ||
| TAXON_MASS_SD | The standard deviation of the mass of the individuals in the sample | See TAXON_MASS_UNITS | Float | double | ||
| TAXON_MASS_UNITS | The units of mass | String | e.g. "g", "kg" | |||
| TAXON_MASS_NOTES | Notes on the taxon mass information, including a definition of what the mass value represents (blank implies total body weight) | String | ||||
| DELTA_13C_MEAN | The mean of the d13C values from the sample | ‰ | Float | double | ||
| DELTA_13C_VARIABILITY_VALUE | The variability of the d13C values from the sample | Float | double | |||
| DELTA_13C_VARIABILITY_TYPE | The variability type that the DELTA_13C_VARIABILITY_VALUE represents | String | Currently "SD" standard deviation, or "SE" standard error | |||
| DELTA_15N_MEAN | The mean of the d15N values from the sample | ‰ | Float | double | ||
| DELTA_15N_VARIABILITY_VALUE | The variability of the d15N values from the sample | Float | double | |||
| DELTA_15N_VARIABILITY_TYPE | The variability type that the DELTA_15N_VARIABILITY_VALUE represents | String | Currently "SD" standard deviation, or "SE" standard error | |||
| C_N_RATIO_MEAN | The mean of the C:N ratio values from the sample, expressed as a molar percentage | Float | double | |||
| C_N_RATIO_VARIABILITY_VALUE | The variability of the C:N ratio values from the sample | Float | double | |||
| C_N_RATIO_VARIABILITY_TYPE | The variability type that the C_N_RATIO_VARIABILITY_VALUE represents | String | Currently "SD" standard deviation, or "SE" standard error | |||
| ISOTOPES_CARBONATES_EXTRACTED | Were carbonates extracted from the samples prior to isotope analyses? | Character | "Y", "N", or "U" (unknown) | |||
| ISOTOPES_LIPIDS_EXTRACTED | Were lipids extracted from the samples prior to isotope analyses? | Character | "Y", "N", or "U" (unknown) | |||
| ISOTOPES_BODY_PART_USED | The part of the organism that the stable isotope values were derived from | String | ||||
| QUALITY_FLAG | An indicator of the quality of this record | Character | "Q" indicates that the data are known to be questionable for some reason. The reason should be in the notes column. "G" indicates good data | |||
| IS_SECONDARY_DATA | An indicator of whether this record was entered from its primary source, or from a secondary citation | Character | "Y" here indicates that the data actually came from another paper and were being reported in this paper as secondary data. Secondary data records are likely to be removed at a later date and replaced with information from the original source | |||
| NOTES | Any other notes | String | ||||
| LAST_MODIFIED | The date of last modification of this record | String | Format dd/mm/yyyy HH:MM:SS PM |
A. Data Set File
Identity: sources.csv
Size: 328 records, 290kB.
Format and storage mode: ASCII text, comma separated.
Header information: The first row of the file contains the variable names below.
Alphanumeric attributes: Mixed
Special characters/fields: None.
Authentication procedures: None.
B. Variable information
Variable name |
Variable definition |
Units |
Storage type |
Precision |
No Data Value |
Variable codes and definitions |
| SOURCE_ID | The unique identifier of this record | Integer | int32 | |||
| DETAILS | The citation details of this source | String | ||||
| NOTES | Additional notes regarding this data source (often an abstract from a publication or metadata record) | String | ||||
| DATE_CREATED | The date and time that this source record was created (UTC) | String | Format dd/mm/yyyy HH:MM |
CLASS V. SUPPLEMENTAL DESCRIPTORS
A. Data acquisition
Data forms: The standardized templates used for data entry are held by the Australian Antarctic Data Centre.
Location of completed data forms: Held by the Australian Antarctic Data Centre.
Data entry verification procedures: See CLASS II, section 3, Research Methods.
B. Quality assurance/quality control procedures: See CLASS II, section 3, Research Methods.
C. Related material: Electronic and/or paper copies of data sources (articles, etc.) are held by the authors.
D. Computer programs and data processing algorithms: NA
E. Archiving
Archival Procedures: All data are archived by the Australian Antarctic Data Centre.
Redundant Archival Sites: NA
F. Publications using the data set: NA
G. History of data set usage
Data request history: NA
Data set update history: Latest update: 17 January 2011. See also LAST_MODIFIED information in each data record
Review history: NA
Questions and comments from secondary users: NA