Roger del Moral. 2010. Thirty years of permanent vegetation plots, Mount St. Helens, Washington. Ecology 91:2185.
INTRODUCTION
Vegetation succession is a fundamental aspect of plant ecology (Walker and del Moral 2003). Gradients of species change through time share some aspects with gradients of spatial vegetation change (Carey et al. 2006). Because primary succession is often slow, many studies have chosen to use space-for-time substitutions (chronosequences) to explore succession (Poli Marchese and Grillo 2000). There are several likely flaws in this approach (Austin 1981, Fastie 1995, Leendertse, et al. 1997, Lichter 1998, Smits et al. 2002, Csecserits et al. 2007, Johnson and Miyanishi 2008, Walker and del Moral 2009b). Chronosequences are valuable for analyses of rapidly changing vegetation and in experimental situations (e.g., Baer et al. 2002). However, faulty interpretations of successional pathways may be generated by landscape effects or climatic variation while stochastic factors (Lichter 2000) can influence identical but spatially distinct plots in different ways. Permanent plots reduce the assumptions needed to study vegetation dynamics (Pickett, et al. 2009) and can be used to explore dispersal effects and other landscape factors on succession. They directly demonstrate how vegetation changes through time and can suggest mechanisms that control the rate and direction of succession. They can be used to test succession models (e.g., Carey et al. 2007, Anderson 2007). Multi-year studies can reveal significant secular responses to weather and can suggest other important factors that govern vegetation dynamics. There is growing awareness that such data bases are crucial for testing ecological hypotheses and for supporting conservation efforts (Schamin�e et al. 2009).
The 18 May 1980 eruption and subsequent volcanic events created several kinds of impacts with different intensities (Lipman and Mullineaux 1981, Dale et al. 2005). Sample plots were designed to capture much of the variation in type and intensity of events that initiated primary and secondary succession trajectories at higher elevations. I have maintained a network of permanent plots on Mount St. Helens since 1980 to monitor changes in vegetation.
Directly or indirectly, this project has produced over 60 papers focused on vegetation reassembly and succession mechanisms. Most have concerned Mount St. Helens, but these studies also included volcanoes in the Russian Far East (Grishin et al. 1996, Grishin and del Moral 1996), Italy and Iceland (del Moral 2009a), and glacial forelands (Jones and del Moral 2009). I established all plots reported here and directly recorded nearly all the data presented. I am also responsible for the verification of the data.
The objective of this data paper is to provide species composition data for these permanent plots so that they may be applied to other questions. I report percentage cover data for each species in each plot in each year and calculations of species richness, total percent cover, and diversity (H' and evenness). I describe relevant characteristics of each species encountered in the data set and the characteristics of plots and their location.
METADATA
CLASS I. DATA SET DESCRIPTORS
A. Data set identity: This database contains data describing long term changes in species composition in permanent plots on Mount St. Helens. This file also contains a series of images from permanent plots in most habitats. In addition to this Metadata file, there are four files that contain species composition, plot structure, species descriptions, and plot descriptions.
Title: Species composition and vegetation structure in permanent plots, Mount St. Helens (1980–2009).
B. Data set identification code:
The metadata are contained in this file: metadata.htm.
The data files are as follows:
Species in each plot per year: MSH_SPECIES_PLOT_YEAR.csv
Description of species: MSH_SPECIES_DESCRIPTORS.csv
Plot structure in each plot per year: MSH_STRUCTURE_PLOT_YEAR.csv
Description of each plot: MSH_PLOT_DESCRIPTORS.csv
C. Data set description:
Principal Investigator: Roger del Moral, Dept. Biology, Box 351800, University of Washington, Seattle, WA 98195-1800; e-mail: [email protected].
Abstract: I established 92 permanent plots on Mount St. Helens starting in 1980 in order to document vegetation recovery from volcanic disturbances. I report data in 1743 records (plot × year), containing 85 species. These represent most common species found in non-forested habitats on St. Helens. Richness, percent cover, diversity (H' and evenness), and species frequency of a plot are reported. Plots were sampled using 24 quadrats placed in the same location in each sample year by the same observer. Habitats sampled included those experiencing primary succession, secondary succession, and recovery from disturbance. These data have been used to test hypotheses concerning succession trajectories and patterns of species assembly. They also may be used to test models of succession, determine succession rates by several methods, and for exploring assembly processes and rules. Four files provide the data: (1) The matrix of species in each plot in each year; (2) The matrix of structural measures (e.g., richness) in each plot in each year; (3) taxonomic and life history characteristics of species in the data set; and (4) geographic and landscape factors for each plot. These data are described in a metadata file, which includes numerous time-series images.
D. Key words: primary succession; secondary succession; species assembly; species–time relationships; succession trajectories; vegetation dynamics; volcanoes.
CLASS II. RESEARCH ORIGIN DESCRIPTORS
A. Overall project description
Identity: Species composition and vegetation structure in permanent plots, Mount St. Helens (1980–2009).
Originator: Roger del Moral.
Period of Study: 1980–2009 (ongoing).
Objectives: To provide plant species and environmental data for studies of succession, including testing succession models, and to provide the baseline for future studies on Mount St. Helens.
Abstract: Same as above.
Sources of funding: National Science Foundation under these grants: DEB-80-21460 (Co-PI); DEB-81-07042 (Co-PI); BSR-84-07213 (Co-PI); BSR-88-11893 (Co-PI); BSR-89-06544 (PI); DEB 94-06987 (PI); DEB-00-87040 (PI) and DEB-05-41972 (PI).
B. Specific project description
Overview: In March 1980, several ecologists (e.g., L. C. Bliss, J. S. Edwards, J. F. Franklin, Estella Leopold, J. A. MacMahon, F. J. Swanson, F. C. Ugolini, and I) gathered when it became clear that Mount St. Helens would soon erupt violently. We developed plans to begin monitoring ecosystem recovery as soon as it was safe to do so. During the subsequent three decades, many groups of organisms have been monitored, including fish, amphibians, mammals (especially rodents), birds, insects, and plants. This data set summarizes permanent vegetation plot data collected starting in 1980 and includes data collected through 2009. A synthesis volume (Dale et al. 2005) described broad ecological and geological findings, but did not provide an opportunity for detailed descriptions of extensive databases. Data presented here formed the basis for many papers by the author and his associates and continue to be used to test hypotheses and compare models of ecosystem recovery.
The initial eruption (N.B., termed a �blast� which is a general term for any laterally-directed, rapid movement of sediment-charged super heated air mass) occurred at 8:32 A.M. on 18 May 1980 and was directed to the north. This occurred because the north side of the volcano collapsed in response to a small earthquake. A devastating debris avalanche flowed down the Toutle River and realigned Spirit Lake, among other geologic responses. This blast removed most vegetation on the cone in an arc of about 170� (Swanson and Major 2005), and flattened forests over 20 km away. A few remnants of vegetation survived close to the cone, protected by deep snow and topography (Fuller and del Moral 2003). This blast devastated Studebaker Ridge, Pumice Plain, and Abraham Plain and had a substantial impact on Toutle Ridge. There were minor impacts to meadows on the south and southwest slopes (Butte Camp), to vegetation on a ridge south of the south fork of the Toutle River, and to Pine Creek Ridge on the east flank, where lahars created most of the damage.
Impact types:
Plots were established in several basic impact types.
Tephra: Material ejected from a volcano must eventually return to earth. The force of the eruption and wind patterns determine where this occurs. Tephra falls as a well sorted mass, with texture becoming increasingly fine with distance from the crater. Thus, on the crater, most tephra fell as rocks and gravel. Tephra was the primary impact on sites south of the crater, and was deposited over lahars and pyroclastic deposits on the north side.
Lahars (colloquially, mudflows): Formed by rapidly moving mixtures of old material and water released from very rapidly melting of glaciers and ice fields. Lahars usually produce deep unmixed deposits on flood plains and are subject to rapid erosion. Large boulders and logs are often imbedded in the deposits.
Scours: Are produced by the actions of lahars or rapidly melted ice fields, but do not leave behind significant deposits. Mild scours occur above Butte Camp. The Shoestring Glacier, on the east flank of Mount St. Helens, created a lahar of such volume and force that it swept over Pine Creek Ridge, scouring much of the vegetation, then left a thin veneer behind. Most of this very fine-textured veneer was removed by rains during winter 1980–1981 (del Moral 1981). Moderate scours occurred lower on the ridge, intense scours occurred higher on the ridge.
Blast: The blast zone was created by the initial explosion. All plants and most soil were removed from sites near the crater. Ridge vegetation generally received few additional impacts.
Pumice: Where the blast removed vegetation and soil on gentle topography north of the crater, coarse pumice soon fell to create a barren landscape. Pumice also covered Abraham Plains after the lahar subsided.
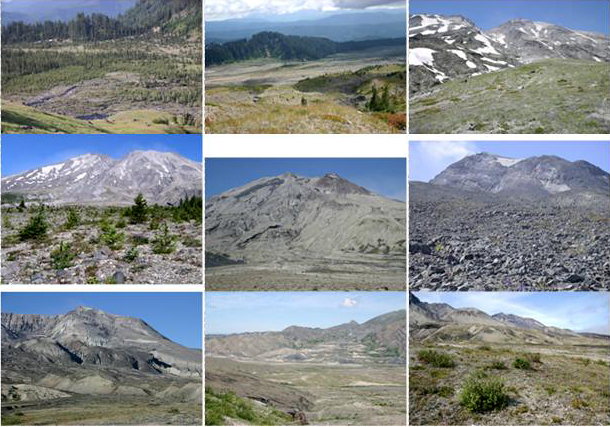
Site descriptions: The 18 May 1980 eruption of Mount St. Helens created a diverse landscape in response to one or more impacts (Dale et al. 2005). Representative sites were selected within which I established permanent plots for long-term monitoring. Individual plots are described in Mount St. Helens plot descriptors.csv. This file provides abbreviation codes, dates of monitoring, location (GPS coordinates and latitude/longitude), elevation, slope, aspect, potential heat load, radiation, and impact types. Detailed descriptions of the eruption events are in Swanson and Major (2005), Frenzen et al. (2005), and references cited in those papers. All figures, below, show the same plot in different years, except Fig. 7. See Table 6 for references to papers that used data from plots listed below.
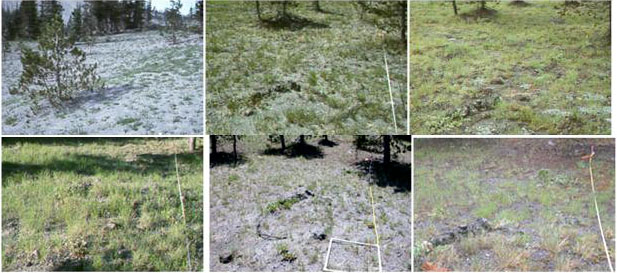
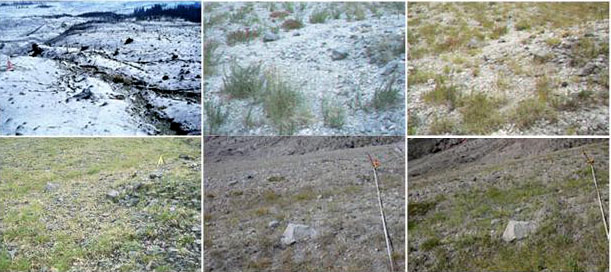
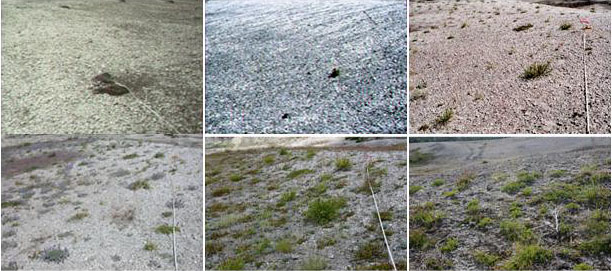
Butte Camp: Butte Camp is located on the south slope of Mount St. Helens. Because this side escaped the direct blast and pyroclastic flows of the 1980 eruption, it was spared many of their dire effects. However, tephra did bury much of the landscape (Fig. 1).
|
|
| FIG. 1. Butte Camp Tephra (BCA): Top, left to right, 1980, 1985, 1989; Bottom, left to right, 1996, 2003, 2009. |
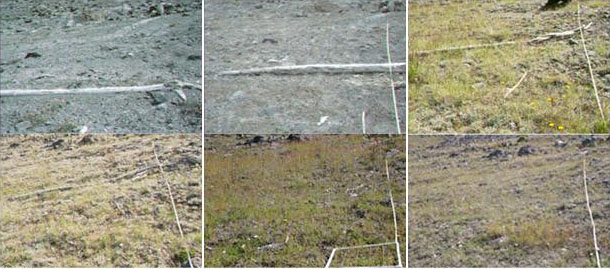
Two lahars (mudflows; Fig. 2, 3) were launched from melted glaciers above the site. Lahars scoured portions of the upper slope (Fig. 4).
|
| FIG. 2. Lahars near intact vegetation (Lahar 1a). Top, left to right, 1982, 1987, 1991; Bottom, left to right, 1999, 2005, 2009. |
|
| FIG. 3. Lahars distant from intact vegetation (Lahar 4). Top, left to right, 1983, 1987, 1991; Bottom, left to right, 1999, 2005, 2009. |
|
| FIG. 4. Mild scours at Butte Camp: Top, left to right, 1985, 1989, 1994; Bottom, left to right, 2002, 2008. |
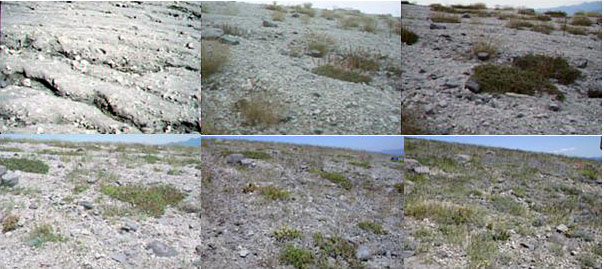
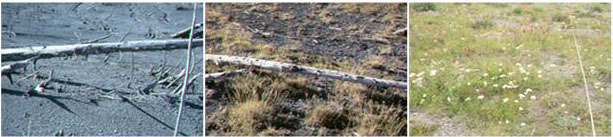
Pine Creek Ridge: This isolated ridge is located on the east-southeast flank of the cone, separating Pine Creek from the Muddy River. The melting Shoestring glacier spawned a lahar that swept over the ridge, first scouring plants, then leaving behind a fine-textured veneer (del Moral 1981). The transects were established in 1980 and visited most years through 2009 (Fig. 5, 6). In a few years, data are missing from some plots because late snow covered them. In addition, four extra plots were established in protected areas on the lower ridge. During the winter of 1980–1981, rill erosion removed some, but not all of this veneer, so that where it remained, plants perished.
|
| FIG. 5. Moderate scours at Pine Creek Ridge (PCA): Top, left to right, 1980, 1984, 1999; Bottom, left to right, 1997, 2003, 2009. |
|
| FIG. 6. Intense scours at Pine Creek Ridge (PCB): Top, left to right, 1980, 1983, 1986; Bottom, left to right, 1996, 2003, 2009. |
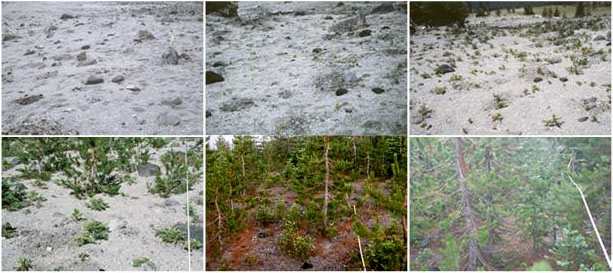
Abraham Plain: This broad, nearly flat expanse on the eastern side of the cone (called Plains of Abraham on maps, but changed here for stylistic reasons) is well within the blast zone. It was also scoured by massive lahars that soon rampaged down the Muddy River, and then received a shallow deposit of rocky pumice (Lipman and Mullineaux 1981). The result was a barren site that even after 30 years is sparsely vegetated (Fig. 7, which shows general aspects).
|
| FIG. 7. Blast zone at Abraham Plains (which also received a lahar and pumice deposits): Top, left to right, Aspect, 1980, 1989, 1995; Bottom, left to right, 1996, 2003, 2009. |
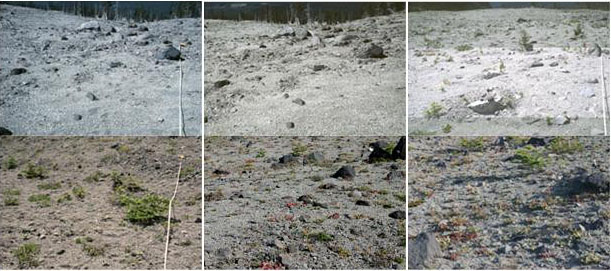
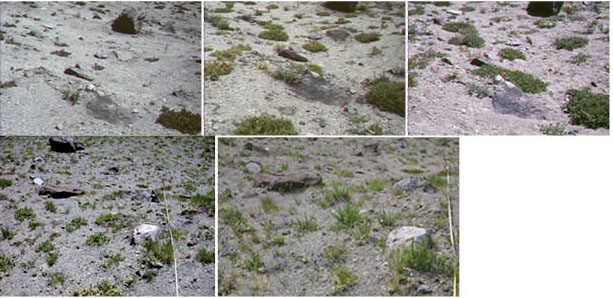
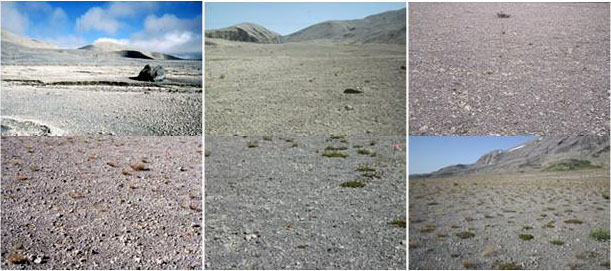
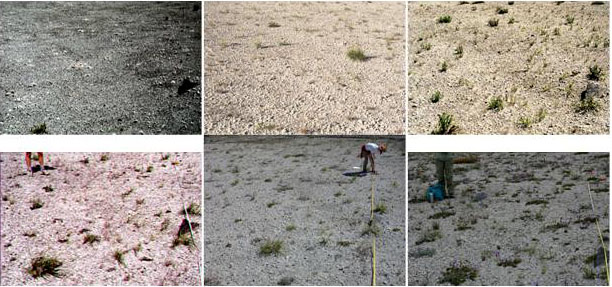
Pumice Plain: This region fronts the north flank of the crater (del Moral and Jones 2002). To the west of the transect, the directed blast, avalanche and pyroclastic flows removed all vegetation and rearranged the landscape. However, this transect is located on the eastern portion of the Pumice Plains that escaped the pyroclastic deposits (Fig. 8, 9), but from which all vegetation was removed.
|
| FIG. 8. Pumice over blast deposits (lower transect): Top, left to right, 1990, 1995, 1998; Bottom, left to right, 2000, 2006, 2009. |
|
| FIG. 9. Pumice over blast deposits (upper transect): Top, left to right, 1990, 1995, 2000; Bottom, left to right, 2003, 2006, 2008. |
Studebaker Ridge: Bounding the western side of the Pumice Plain, this ridge leads up to the northwestern edge of the crater. It received the searing blast, but little tephra. Soil on the upper part of the transect was removed, while on the lower slopes, some soil survived in protected sites (Fig. 10). In August 2004, it received a few mm of tephra from a significant dome-building eruption. Missing data reflect several unforeseen circumstances (e.g., early arrival of helicopter, 2000; injury to assistant in 2007). These plots have been discussed in textbooks (e.g., Krebs 2008, 2009).
|
| FIG. 10. Blast zone at Studebaker Ridge: Top, left to right, Aspect, 1984, 1990, 1995; Bottom, left to right, 1997, 2005, 2008. |
Toutle Ridge: This ridge divides the two main forks of the Toutle River and lies on the west side of the cone. While it is within the blast zone, the effects were moderate compared to those of Studebaker Ridge (Fig. 11). The ridge is remote from roads and trails are in poor conditions. For these reasons, monitoring ceased in 1999.
|
| FIG. 11. Blast zone at Toutle Ridge: Left to right, 1981, 1994, 1997. |
South Fork Toutle Ridge: Southwest of the south fork of the Toutle River is an isolated ridge. It is distant from any road and trail access has become tenuous due to intense erosion at higher elevation. I sampled this site only in 1980, but plots are reported because several species not otherwise encountered were recorded. These data have not been used in publications and GPS coordinates are approximate.
Transect Descriptions: Permanent plots were arrayed along transects, separated by either 50 m or 100 m. In 1980 transects were placed along contours. It became apparent that erosion would make crossing gullies (which became canyons in some cases) difficult to impossible. Thus, from 1981 on, transects were arrayed uphill. Typical images are shown in Fig. 12.
|
| FIG. 12. Typical aspects: Top row, left to right: Butte Camp lahars (2009); Pine Creek (2009), Pine Creek (2006). Middle row, left to right: Muddy River lahar (2007); Abraham Plain (2005); Studebaker Ridge (2006). Bottom row, left to right: Pumice Plain (2006; 2008; 2009). |
Tephra: Tephra monitoring plots sample sites upon which coarse tephra fell on the south flank of the cone, mostly during the 25 May 1980 eruption. Because it was coarse and shallow, many plants and all species survived (Pfitsch and Bliss 1988). Plots that monitored recovery from tephra fall were established at Butte Camp and on a ridge above the South Fork of the Toutle River (1980 only). Pumice deposits were dominated by rocks and �bombs� ranging in size from popcorn to golf balls (Wood and del Moral 2000). This material has since weathered to form a coarse, sandy surface found at several sites devastated by the blast. Tephra plots are located as follows:
Butte Camp transect A (BUCA) received coarse tephra up to a depth of 30 cm, through which plants began to emerge during the summer of 1980. Snow protected the vegetation during the early eruptions. This transect was established by maintaining a constant elevation (ca 1372 m) and placing plots 100 m apart. It extends in a generally westerly direction. Plot BUCA02 was abandoned when it became engulfed by conifers; BUCA 5, 6, and 7 were washed away by small laharas after several years.
Butte Camp transect B (BUCB) also received coarse tephra up to a depth of 30 cm. BUCB01 and 2 were in swales and protected by deep snow. BUCB03 to 06 were on relatively stable slopes. This transect was established by maintaining a constant elevation (ca 1525 m) and placing plots 100 m apart. It extends in a generally westerly direction. BUCB07 was in a boulder field and sampling was suspended in 1998. BUCB08 to 12 were on steep slopes and sampling was suspended after 1986. A deep canyon developed between BUCB02 and BUCB03. This canyon was easily traversed in the early 1980s, then became increasingly difficult and then dangerous. Sampling of plots in 2006 and 2007 was prevented. In 2008 these plots were sampled after a difficult, dangerous and arduous climb, but no further sampling is planned.
Butte Camp transect C (BUCC) received coarse tephra (BUCC03). This transect was established by maintaining a constant elevation (ca 1615 m) and placing plots 100 m apart. It extends in a generally westerly direction.
Butte Camp Transect D (BUCD) started at 1604 m and extends up the ridge, terminating at 1705 m. Plots are 50 m apart. Plots received coarse tephra on the lower slopes (BUCD01, BCUD02). BUCD04 was excluded because it samples both scoured and tephra impacts. This transect was established in 1981, by which time it was apparent that transects along contours would become increasingly difficult to traverse as erosion deepened gullies and canyons.
South Fork Toutle Ridge (SFTR) plots were only sampled in 1980, but are reported because several species not otherwise encountered were recorded.
Pine Creek Extra (PICE) were established in 1980 below the scoured plots on Pine Creek. Sampling continued until 1990. PICE01 was lost to erosion during 1981 and is not reported. They were protected by snow from the main blast effects and were not scoured. Tephra was the main disturbance. These extra plots have not been previously been reported, but are listed here because they represent typical subalpine vegetation in this area and they contain species not otherwise sampled.
Scour: Scour intensity was estimated by the degree of surviving vegetation in 1980 (mild, moderate, intense).
Scours at Butte Camp (BUCC01, 2 and 4; BUCD03, BUCD05) received mild scours and tephra deposits were soon removed by erosion.
Scours at Pine Creek were divided into moderate (PICA) and severe scouring (PICB). PICA is at lower elevation (1370 m), and suffered less scouring than PICB, at 1525 m. Both transects run along the contours, and plots are located at 100 m intervals.
Lahar: Lahars (LAHR) were deposited near the BUC transects. A small lahar stopped just above BUCA, and buried only a few trees. Some trees on the margins survived for a few years, and then succumbed to having their roots buried. Sampling started in 1982, with LAHR01 and LAHR02 located on this lahar. They are close to the intact Abies-Pinus forest and have developed substantially once conifers became established. LAHR04 to LAHR08 are located on the larger lahar about 1 km to the west (LAHR03 was lost to erosion in 1983). Due to active erosion in a deep canyon separating the sites, the trail has become virtually impassable. Future sampling will require either repair to the trail (in planning stages) or development of an alternative approach.
Blast: Three sites sampled blast effects.
Toutle Ridge: The transect includes 10 plots at 100 m intervals up the ridge and was established in 1981. TORD01 is at 1280 m, TORD10 is at 1430 m. GPS coordinates given in MSH_PLOT_DESCRIPTORS.csv are approximate since accurate GPS was not available on the last sampling date in 1997.
Studebaker Ridge: STRD01 (1218 m) to STRD10 (1341 m) were established in 1984, when there were only a few scattered plants, with no plants found in several plots. STRD11 (1354 m) to STRD20 (1467 m) were established in 1989.
Abraham Plain received the effects of blast, lahar and pumice deposits. A grid of 400 100 m2 was established in1988 at about 1370 m (del Moral and Wood 1993b), at which time only about one-third of the plots had any plants. Permanent plots were established in 1995 to make more precise cover estimates. At this time, some vegetation was evident and plots have been sampled annually since.
Pumice: This transect, established in 1989, describes primary succession. There are 12 plots arrayed at 50 m intervals from 1248 m (PUPL01) to 1306 m (PUPL12). Del Moral and Rozzell (2005) described this area and its history, while del Moral and Lacher (2005) incorporated 2004 data from these plots into their survey of the Pumice Plains vegetation.
Research Methods:
Sampling. The basic unit of study is a circular plot with a radius of 9 m, nominally 250 m2. Plots were arrayed along transects (see Abraham Plain for exception) at predetermined intervals (50 or 100 m). Transects within one area were located at various elevations. Between 2005 and 2009 locations were determined using GPS (WGS84) coordinates an accuracy of 5 m (see Table 5 and the plot descriptor file). Elevation was determined from these coordinates using an electronic topographic map (National Geographic Society 2007). Aspect was determined using a compass and angle of the slope was determined with an inclinometer. Insolation was calculated from these values using the equations provided by McCune and Keon (2002).
From the permanently marked center pole (70 cm rebar) of each plot, four transects were extended at 90� angles from each other to end poles at least 9 m distant (topography and obstacles often required small deviations). The direction of the transect of plots was equidistant between measurement transects B and C (see Fig. 13). Between 1980 and 1985, 0.1 m2 (20 × 50 cm) quadrats were used. Six quadrats, centered at 2, 3, 4, 5, 6, and 7 m along the left side of a tape (facing out from the center pole), along each of the four radii. The measurement transects were annotated as A, B, C, or D as follows: facing the direction of the transect of plots, Transect A was over the left shoulder of the observer. Transect B was 90� clockwise and so forth. The percent cover of each species in each of the 24 quadrats was recorded. Along each transect, any additional species not found in a quadrat, but in the 90� wedge centered on the transect, were scored as present. In 1985 and thereafter 0.25 m2 (50 × 50 cm) quadrats replaced the smaller ones. A comparison of the 1985 data, in which both sizes were used, showed that cover scores were similar, that internal variation was less with the larger quadrats, and that more species were sampled. Data reported for 1985 are for the larger quadrats. In order to retain comparisons with earlier data, each 0.25 m2 quadrat was placed between 1.6 and 2.1 m, 2.6 and 3.1 m, out to between 6.6 and 7.1 m.
Plot orientation. Transects BUCA, BUCB, and BUCC at Butte Camp were aligned along contours at 100 m intervals. These transects run from east to west. The two transects at Pine Creek, PICA, and PICB, are also aligned along contours with plots established at 100 m intervals. These transects are aligned to the north. Also at Pine Creek, PICE plots were scattered in a protected area. The plots at Abraham Plain, ABPL, were placed on a grid system established for another purpose. ABPL01 to ABPL04 are 100 m apart on a transect starting at grid coordinates 50 m by 20 m; ABPL05 to ABPL07 start at grid coordinates 100 m by 50 m; ABPL08 to ABPL10 start at grid coordinates 150 m by 80 m. On the eastern Pumice Plain, the 12 PUPL plots are spaced at 50 m. The transect is aligned uphill in a generally northerly directing. Along Studebaker Ridge, the SRRD plots are aligned on a transect the proceeds uphill (southeast) and are spaced at 50 m intervals. On Toutle Ridge, TORD transect is aligned uphill (east) and its plots are at 100 m intervals.

|
| FIG. 13. Diagram of permanent plot sampling design. The center is marked by a 0.6-cm diameter pole, which anchors four transects arrayed at 90° angles from each other. The end of each transect is marked by a metal pole. Six 0.25-m2 quadrats (50 × 50 cm) are placed on its left side (facing outward from the center) of each transect. Each quadrat is aligned between 1.6 and 2.1 m, 2.6 and 3.1 m, etc., as shown. Several permanent plots are normally located along transects such that the direction of the transect bi-sects the angle between measurement transects B and C. |
Photography. One photo was taken of each transect in each sample year. Photos were taken from the center of the plot such that the pole marking a transect was in the upper right corner, as shown in Krebs (2008). From 1980 to 2001, the images were recorded in black and white and in color film slides. Since 2002, digital imagery has been used for documentation. Color slides have been digitized, but original slides have been stored securely in my office files and can be scanned as high resolution images when needed.
Data Summary. In order to facilitate calculations, an Excel� program was written by L. R. Rozzell. Each value is tagged by species, quadrat, transect, plot, year, and location. The program provides a summary of species composition in each plot, richness, plot cover, diversity, evenness, and mean species frequency. Frequency (percent) for each species was the ((number of quadrats present/24) × 100), unless it did not occur within a quadrat, in which case it was assigned a frequency of 1% for each transect with which it was associated. Individual plant species have not been reported in previous publications, and the method of sampling does not offer robust frequency values. In addition, the program provides an echo of the input data (for checking against the field data sheets) and blank data forms for the next season. These forms include a notation indicating if a species was present in a plot, but did not occur within any quadrat. This assists in attempting to locate rare or nondescript species. The form of these data is suitable for input into a relational data base program.
Nomenclature: The current nomenclature for each species in this data set was confirmed on 22 May 2009 from The PLANTS Database (USDA NCRS 2009; See also MSH_SPECIES_DESCRIPTORS.csv). Thirteen of the 85 taxa have undergone revision since 1990.
Permit history: Monitoring was conducted under permit from the Mount St. Helens National Volcanic Monument, Amboy, Washington, USA.
Legal/organizational requirements: None.
Project Personnel: Roger del Moral. In addition, over the years the following have assisted with data collection, input, and validation: S. Anderson, S. Bard, C. Clampitt, A. Cook, Cousins, M. Colkitt, A. Coogan, S. Crawford, H. De la Hunt, K. Dlugosch, A. Eckert, E. Ellis, C. Fairbourn, M. Fleming, T. Fletcher, P. Frenzen, R. Fuller, A. Grant, R. Konrady, E. Jenkins, C. Jones, M. Johns, D. Lello, K. LoBuglio, L. McMullin-Taylor, P. Moody, C. Muerdter, K. Pearl, R. Robham, L. Rozzell, J. Sandler, R. Sewell Nesteruk, R. Siems, M. Spasojevic, P. Stanford, T. Thomas, J. Titus, J. van der Mark, N. Weidman, K. Welling, S. Wilson, B. Witte, C. Wolfe, and D. Wood.
CLASS III. DATA SET STATUS AND ACCESSIBILITY
A. Status
Latest Update: The data set spans the period 1980 to 2009. Data collection is ongoing through the present and will be added as collected and verified.
Latest Archive date: 30 November 2009.
Metadata status: The metadata are complete, current and are stored with the data.
Data verification: The quality of the data has been carefully reviewed by the author. Data have also undergone substantial checking throughout the initial analysis. After input, the program provides a mirror of the field data, which is then compared to the mirror. Errors are corrected at this point. Entries were checked for outliers and omissions, and were then re-checked against the original field data. Data through 2005 were also validated upon input to the H. J. Andrews long-term data set archive, long term ecological research site: (http://andrewsforest.oregonstate.edu/data/abstract.cfm?dbcode=TV070&topnav=97).
B. Accessibility
Storage location and medium: Ecological Society of America data archives (http://esapubs.org/archive/default.htm). Original data files exist on the author�s personal computers and on CDs in MS Excel� format and in comma-separated format. Field data are stored in the author�s files at the University of Washington. Summaries are available on this website: http://faculty.washington.edu/moral.
Contact person: Roger del Moral, e-mail: [email protected], Tel. 206.543.6341, 1521 NE Pacific St., Department of Biology, University of Washington, Seattle, WA 98195-1800, USA.
Copyright restrictions: None.
Proprietary restrictions: None.
Costs: None.
CLASS IV. DATA STRUCTURAL DESCRIPTORS
A. Data Set Files
Identity:
MSH_SPECIES_PLOT_YEAR.csv is a species percent cover by plot by year matrix.
MSH_STRUCTURE_PLOT_YEAR.csv is a vegetation structure (richness, cover, H�, evenness and mean frequency) by plot by year matrix.
MSH_SPECIES_DESCRIPTORS.csv provides systematic species information and details about species characteristics (family, species with authority, common name, synonymy and taxon comments, code used in notes and in species file, NLPSP code, succession status, higher taxon, life span duration, life form, growth form, degree of clonal growth, dispersal type, origin{native or exotic} and sites).
MSH_PLOT_DESCRIPTORS.csv provides geographic location for each plot in the data base, including: Plot name, plot code, first and last year sampled, UTM easting, UTM northing, longitude, latitude, potential radiation, heat load, elevation, aspect, slope, and impact types.
Size:
MSH_SPECIES_PLOT_YEAR.csv 1743 lines, not including the header row.
MSH_STRUCTURE_PLOT_YEAR.csv 1743 lines, not including the header row.
MSH_SPECIES_DESCRIPTORS.csv 85 lines, not including the header row.
MSH_PLOT_DESCRIPTORS.csv 92 lines, not including the header row.
Comments: none.
Format and Storage mode: Each file is ASCII text, comma delimited. No compression schemes were used in any file.
Header information: See variable names and descriptions in tables below.
Character attributes: Alphabetic, mixed or numeric as described below.
Special characters/fields: There are no missing data. If a plot was sampled, but lacked species, all fields are filled with 0.
Authentication procedures: Sums of species cover in the species data file was compared to that presented in plot structure file. The total number of occurrences in the species file was compared to the sum of richness values in the plot structure file (Table 1). From MSH_SPECIES_PLOT_YEAR.csv), the sum of all of the species cover data is 31301.5 and there are 26825 nonblank entries of species presence, which determines species richness. From the structure file, the sum of richness values was 26825 and from the species file, there were 26825 occurrences. The values of richness were directly compared using a logical statement, and all cases were �TRUE�, that is identical. Similarly, cover in the structure file was compared to the sum of the cover in each plot of the species file. In all cases, the cover values were the same.
TABLE 1. Authentication from plot structural data.�
Property |
From Structure |
From Species |
Minimum |
Maximum |
Mean |
Richness |
26825 |
26825 |
0 |
29 |
15.39 |
Cover |
31301.5 |
31301.5 |
0.0 |
117.0 |
17.96 |
Hprime |
3137.290 |
--- |
0.000 |
2.901 |
1.800 |
Evenness |
1193.902 |
--- |
0.000 |
1.000 |
0.685 |
Mean Frequency |
23458.3 |
--- |
0.0 |
83.0 |
13.5 |
Descriptors:
The basic species percent cover data are given in MSH_SPECIES_PLOT_YEAR.csv. Table 2 provides a description of the data in each column. Column 1 provides a unique combination of plot location, plot number, and year of observation. Columns 2 to 4 provide each of these descriptors in its own column for ease of sorting. The remaining columns provide the mean cover value of each species in each plot. These species are distributed into families, higher taxa (e.g., conifers), growth forms (e.g., evergreen forbs), and life forms (e.g., hemicryptophytes) in proportions similar to the overall species list from upland sites (based on general surveys and grid studies, but excluding wetlands).
TABLE 2. Description of columns in MSH_SPECIES_PLOT_YEAR.csv. The header row is the attribute listed below.
Column |
Attribute |
Definition |
Storage type |
1 |
PLOT_ID_Year |
PLOT ID = 10 characters composed of 4 letter alphabetic code (see below), 2 digit plot number and 4 digit year |
mixed |
2 |
PLOT_NAME |
PLOT NAME = 4 letter alphabetic code: ABPL = Abraham Plain; BUCA = Butte Camp, transect A; BUCB = Butte Camp, transect B; BUCC = Butte Camp, transect C; BUCC = Butte Camp, transect D; LAHR = lahar plots near Butte Camp; PICA = Pine Creek Ridge, transect A; PICB = Pine Creek Ridge, transect B; PICE = Pine Creek Ridge, extra; PUPL = Pumice Plain; SFTR� = South Fork Toutle Ridge; STRD = Studebaker Ridge; TORD = Toutle Ridge |
alphabetic |
3 |
PLOT_NUMBER |
PLOT NUMBER = plot sequence in transect |
numeric |
4 |
YEAR |
YEAR = Calendar year |
numeric |
5–89 |
Species code |
Percent cover value of each species designated by the six-character code; see MSH_SPECIES_DESCRIPTORS.csv for unique codes |
numeric |
The structure of each plot in each year is summarized in MSH_STRUCTURE_PLOT_YEAR.csv. In Table 3, Column 1 provides a unique combination of plot location, plot number, and year of observation. Columns 2 to 4 provide each of these descriptors in its own column for ease of sorting. The remaining columns provide community structure data (richness, cover, H' and evenness).
TABLE 3. Description of columns in MSH_STRUCTURE_PLOT_YEAR.csv. The header row is the attribute listed below.
Column |
Attribute |
Definition |
Storage type |
1 |
PLOT_ID |
Unique identifier: 10 characters composed of 4 letter alphabetic code (see Table 5), 2 digit plot number and 4 digit year |
mixed |
2 |
PLOT_NAME |
PLOT NAME = 4 letter alphabetic code |
alphabetic |
3 |
PLOT_NUMBER |
PLOT NUMBER = plot sequence in transect |
numeric |
4 |
YEAR |
YEAR = Calendar year |
numeric |
5 |
RICHNESS |
Total number of species in plot |
numeric (integer) |
6 |
COVER_% |
Total percent cover of the plot |
numeric |
7 |
HPRIME |
H' = [-∑ pilogpi] |
numeric |
8 |
EVENNESS |
E = H' / ln (Richness) |
numeric |
9 |
FREQUENCY |
Mean percentage occurrence of the species in a plot |
numeric |
The identity and ecological description of each species encountered in permanent plots are in MSH_SPECIES_DESCRIPTORS.csv (Table 4). This file provides the family, complete current species name, a common name, any recent synonymy, the code for this species used in the species file, the National code provided in �Plants�, successional status determined from the literature and regional observations, general type of plant (e.g., monocot), typical longevity, growth form, Raunkiaer life form, type of vegetative growth, and locations observed (along with disturbance at that location).
TABLE 4. Description of columns in MSH_SPECIES_DESCRIPTORS.csv. The header row is the attribute listed below.
Col. |
Attribute |
Definition |
Storage type |
1 |
Family |
Plant family name |
alphabetic |
2 |
Species_&_authority |
Formal current name of species; see Taxonomic information from http://plants.usda.gov/index.html |
alphabetic |
3 |
Common_name |
Generally accepted common English name |
alphabetic |
4 |
Synonymy _&_comment |
Names once used in this study; other comments |
alphabetic |
5 |
Raw_code |
Code used in MSH_SPECIES_PLOT_YEAR.csv |
alphabetic |
6 |
NLSPNcode |
Code used by USDA �Plants� site |
mixed |
7 |
Successional _status |
Pioneer, seral or climax |
alphabetic |
8 |
Higher_taxon |
Conifer, dicot, monocot, fern or moss |
alphabetic |
9 |
Duration |
Typical longevity of an individual, compiled from USDA �Plants� site and field observations: A = annual; PS = short-lived perennial; PM = moderate-lived perennial; PL = long-lived perennial |
alphabetic |
10 |
Growth_form |
General type of plant: |
alphabetic |
11 |
Life_form |
Raunkiaer
(1934) life forms: |
alphabetic |
12 |
Clonal |
Method of vegetative regeneration, if any: C = multiple stems in single cluster; O = single stem; R = vegetative growth by rhizomes, stolons, spreading stems or similar structures |
alphabetic |
13 |
Dispersal |
Type of dispersal observed or inferred from morphology and literature (Fuller & del Moral 2003): Ant = known to be dispersed over short distances; Bird = typically dispersed by fleshy fruit eating birds; Elk = seeds eaten and deposited with scat; Rodent = cone or seed transported, often cached; Self = possess explosive dehiscence; Water = dispersed along water courses; Wind = seed, fruit or entire plant blown through the air or tumbled along the landscape. If more than one, listed in order of importance |
alphabetic |
14 |
Origin |
General region of origin: Native = native to the Pacific Northwest; Exotic = not native to North America |
alphabetic |
15 |
Wet |
Wetland indicator status (U.S. Fish and Wildlife Service 1988, 1993): FACW = Facultative Wetland plant, usually occurs in wetlands (estimated probability 67%-99%); FAC = Facultative plant, equally likely to occur in wetlands or non-wetlands (estimated probability 34%-66%); FACU = Facultative Upland plants, usually occurs in non-wetlands (estimated probability 67%-99%); UPL= Obligate Upland plant, rarely occurs in wetland (estimated probability < 1%). NI = not listed, presumably UPL, sometimes so listed because of insufficient information |
alphabetic |
16 |
Location_&_disturbance |
Codes for location and disturbance type(s) ABPL = Abraham Plain; BUCA = Butte Camp, transect A; BUCB = Butte Camp, transect B; BUCC = Butte Camp, transect C; BUCC = Butte Camp, transect D; LAHR = lahar plots near Butte Camp; PICA = Pine Creek Ridge, transect A; PICB = Pine Creek Ridge, transect B; PICE = Pine Creek Ridge, extra; PUPL = Pumice Plain; SFTR� = South Fork Toutle Ridge; STRD = Studebaker Ridge; TORD = Toutle Ridge |
alphabetic |
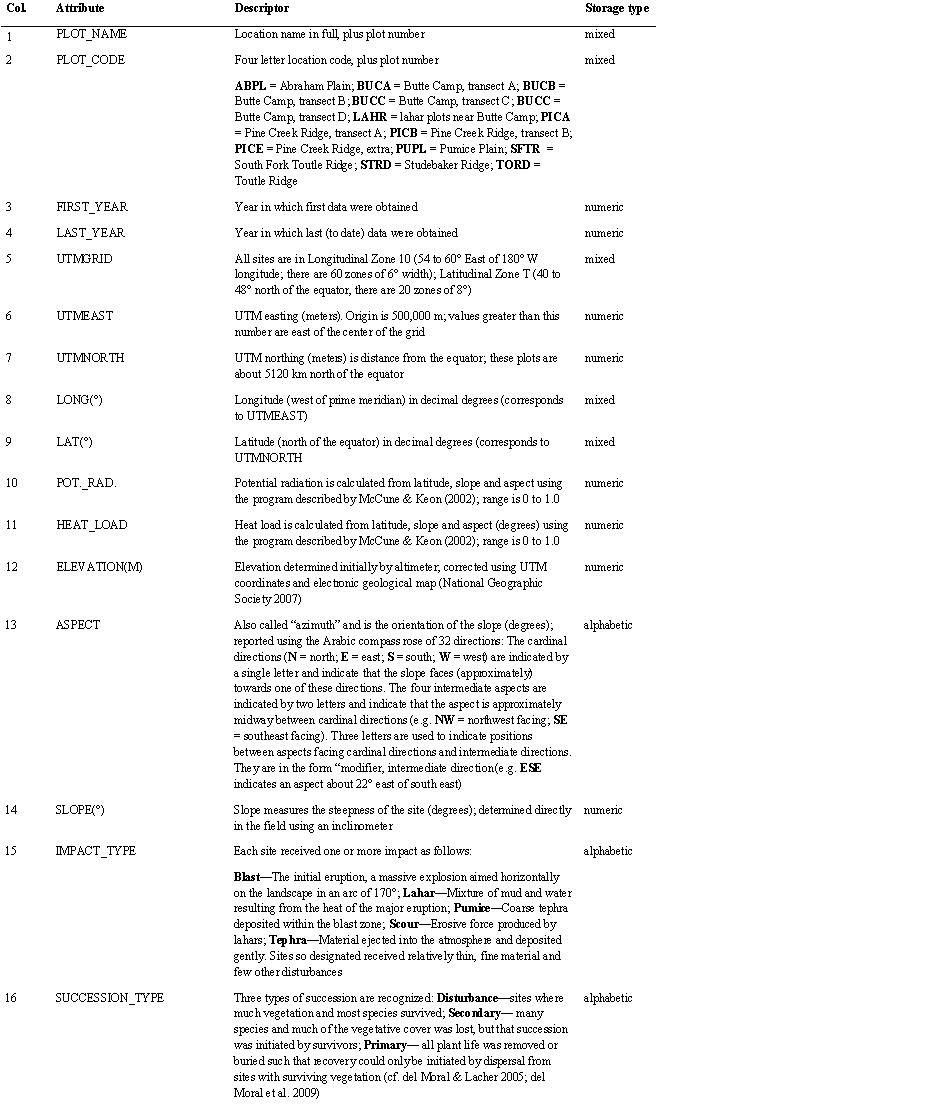
Each plot provides a unique combination of physical setting and impact type. These are described in Table 5. The plot name and code provide cross-reference to plot structure file. The first and last year of data for each location indicate the length and status of the transect (active or no longer being sampled). The UTM, longitude and latitude coordinates place each plot within a few meters, and will allow relatively easy relocation of the plots. Potential radiation and heat load indicate local insolation. Elevation is a weak indicator of growing season (see del Moral and Ellis 2004). Slope and aspect are used to calculate potential radiation and heat load. Impact type indicates the initial disturbance for the plot and succession type indicates the degree to which vegetation was impacted by the initial volcanic eruptions.
TABLE 5. Description of columns in MSH_PLOT_DESCRIPTORS.csv. The header row is the attribute listed below.
CLASS V. SUPPLEMENTARY DESCRIPTORS
A. Data acquisition
Data forms: Paper or water-proof paper field notes and electronic data summary forms.
Location of completed data forms: Computer and CD files, Roger del Moral, Department of Biology (Box 351800), University of Washington, Seattle, WA 98195-1800.
Data entry/verification procedures: Over 90% of the observations were made by RdM; observations were recorded on data forms (by field assistants) that listed prior occurrences in order to minimize missing rare species. Data were introduced into an MS-Excel� based spreadsheet program. This program summarized the plot data and calculated vegetation structure. The program produced an echo of the field data and the two were compared manually. Errors were corrected in the data base. Printout of each plot was inspected for such errors as duplicate entries or species unlikely to occur. Changes in taxonomic treatment were incorporated in the final data base. R. del Moral reviewed all individual datasets to ensure consistency. Most data have been tested in a variety of multivariate analyses to help detect subtle errors.
Original data files exist on the author�s personal computers and on CDs in MS Excel� format and in comma-separated format. Field data are stored in the author�s files at the University of Washington. Summaries are available on this website: http://faculty.washington.edu/moral.
B. Quality assurance/quality control procedures: see Authentication procedure (Class IV).
C. Related material: Permanent grids were established on two lahars, Abraham Plain and the Pumice Plain. Many permanent plots are near these grids.
D. Computer programs and data processing algorithms: Data are entered as cover per individual quadrat and summarized by plot. Excel� based program also calculates plot richness, cover, H', evenness and mean species frequency. It produces data forms for subsequent observations. The files can be exported for use in various statistical, database or spreadsheet software.
E. Archiving: Up to 2005, placed in the H. A. Andrews Long-term data archive (OREGON LTREB: http://andrewsforest.oregonstate.edu/data/abstract.cfm?dbcode=TV070&topnav=97.
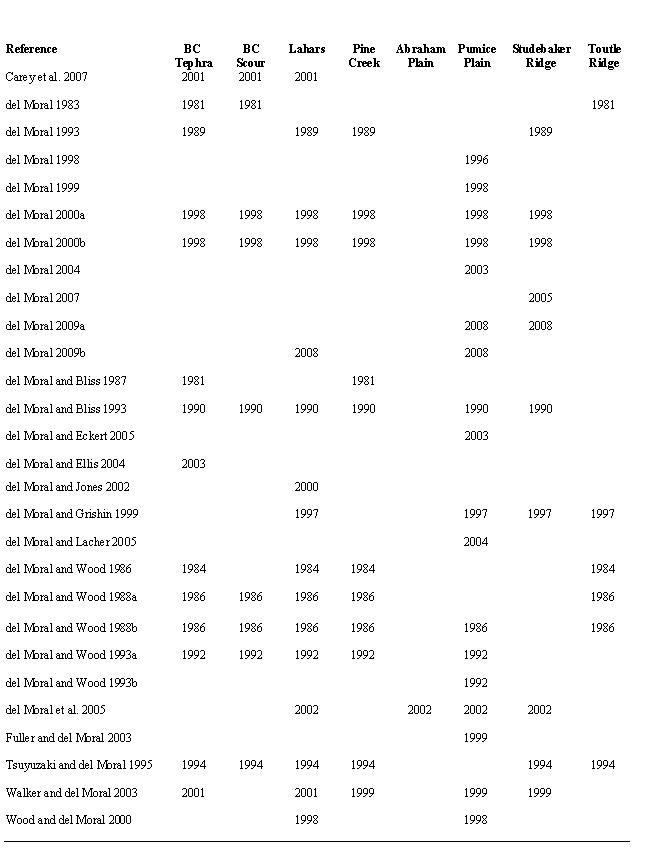
F. Publications using the data set: This full data set has not yet been used in any publication. Several papers used parts of the data as follows (Table 6).
TABLE 6. Publications using permanent plot data, showing last year employed. The complete citation for each is given below. ����
G. History of data set usage
Some of these data also have been used by Carey et al. (2007). Jeff Houlehan (U. New Brunswick) is using data in modeling studies. No requests have been denied.
H. Data set update history: Data were reviewed and updated on 30 November 2009.
I. Review history: n/a
J. Data-use policy
The data sets compiled here are publicly available data. Permission to use these data will be granted upon request by Roger del Moral.
ACKNOWLEDGMENTS
I thank all those mentioned under Project Personnel for assistance and companionship in the field. These data were collected these grants from the U.S. National Science Foundation: DEB 80-21460; DEB 84-17042; BSR 84-07213; BSR 89-06544; DEB 94-6987; DEB 00-87040; DEB 05-41972. C. L. Huang provided data summary programs used through 1998. Lara R. Rozzell developed the data summary and verification program used since 2000.
LITERATURE CITED (* = those using this data set)
Anderson, K. J. 2007. Temporal patterns in rates of community change during succession. American Naturalist 169:780–793.
Austin, M. P. 1981. Permanent quadrats: an interface for theory and practice. Vegetatio 46:1–10.
Baer, S. G., D. J. Kitchen, J. M. Blair, and C. W. Rice. 2002. Changes in ecosystem structure and function along a chronosequence of restored grasslands. Ecological Applications 12:1688–1701.
Carey, S., J. Harte, and R. del Moral. 2006. Effect of community assembly and primary succession on the species-area relationship in disturbed systems. Ecography 29:866–872.
*Carey, S., A. Ostling, J. Harte, and R. del Moral. 2007. Impact of curve construction and community dynamics on the species-time relationship. Ecology 88:2145–2153.
Csecerits, A., R. Szabo, M. Halassy, and T. Redei. 2007. Testing the validity of successional predictions on an old-field chronosequence in Hungary. Community Ecology 8:195–207.
Dale, V. H., F. J. Swanson, and C. M. Crisafulli (editors). 2005. Ecological responses to the 1980 eruption of Mount St. Helens. Springer Science, New York, New York, USA.
del Moral, R. 1981. Life returns to Mount St. Helens. Natural History 90(5):36–49.
*del Moral, R. 1983. Initial recovery of subalpine vegetation on Mount St. Helens, Washington. American Midland Naturalist 109:72–80.
*del Moral, R. 1993. Mechanisms of early succession on Mount St. Helens. Pages 79–100 in J. Milne and D. W. H. Walton, editors. Primary succession on land. Blackwell, London, UK.
*del Moral, R. 1998. Early succession on lahars spawned by Mount St. Helens. American Journal of Botany 85:820–828.
*del Moral, R. 1999. Plant succession on pumice at Mount St. Helens. American Midland Naturalist 141:101–114.
*del Moral, R. 2000a. Succession and species turnover on Mount St. Helens, Washington. Acta Phytogeographica Suecica 85:53–62.
*del Moral, R. 2000b. Local species turnover on Mount St. Helens. Pages 195–197 in P. White, editor. Proceedings of the 41st Symposium of the IAVS. Opulus Press, Uppsala, Sweden.
*del Moral, R. 2004. How Lupinus lepidus affects primary succession on Mount St. Helens. Pages 208–215 in E. van Santen, editor. Wild and cultivated lupins from the tropics to the poles. Proceedings of the 10th International Lupin Conference, Laugarvatn, Iceland, 19-24 June, 2002. International Lupin Association, Canterbury, New Zealand.
*del Moral, R. 2007. Vegetation dynamics in space and time: an example from Mount St. Helens. Journal of Vegetation Science 18:479–488.
*del Moral, R. 2009a. Primary succession on Mount St. Helens, with reference to Surtsey. Surtsey Research 12:151–155.
*del Moral, R. 2009b. Increasing deterministic control of primary succession on Mount St. Helens, Washington. Journal of Vegetation Science 20:1145–1154.
*del Moral, R., and L. C. Bliss. 1987. Initial vegetation recovery in subalpine of Mount St. Helens, Washington. Pages 148–167 in D. E. Bilderback, editor, Recovery of vegetation on Mount St. Helens. A. A. A. S. Symposium, Corvallis, Oregon, June 1981.
*del Moral, R., and L. C. Bliss. 1993. Mechanism of primary succession: Insights resulting from the eruption of Mount St. Helens. Advances in Ecological Research 24:1–66.
*del Moral, R., and A. J. Eckert. 2005. Colonization of volcanic deserts from productive patches. American Journal of Botany 92:27–36.
*del Moral, R., and E. E. Ellis. 2004. Gradients in heterogeneity and structure on lahars, Mount St. Helens, Washington, USA. Plant Ecology 175:273–286.
*del Moral, R., and S. Yu. Grishin. 1999. The consequences of volcanic eruptions. Pages 137–160, in L. R. Walker, editor. Ecosystems of disturbed ground, Chapter 5; Ecosystems of the world series. D. W. Goodall, editor-in-chief., Elsevier Science, Amsterdam, The Netherlands.
*del Moral, R., and C. C. Jones. 2002. Early spatial development of vegetation on pumice at Mount St. Helens. Plant Ecology 162:9–22.
*del Moral, R., and I. L. Lacher. 2005. Vegetation patterns 25 years after the eruption of Mount St. Helens, Washington. American Journal of Botany 92:1948–1956.
del Moral, R., and L. R. Rozzell. 2005. Effects of lupines on community structure and species association. Plant Ecology 180:203–215.
*del Moral, R., J. E. Sandler, and C. P. Muerdter. 2009. Spatial factors affect primary succession on the Muddy River lahar, Mount St. Helens, Washington. Plant Ecology 2002:177–190.
*del Moral, R., and D. M. Wood. 1986. Subalpine vegetation recovery five years after the Mount St. Helens eruption. Pages 215–221 in S. A. C. Keller, editor. Proceedings of the symposium Mount St. Helens: five years later, held May 17-18, 1985. Eastern Washington State University Press, Cheney, Washington, USA.
*del Moral, R., and D. M. Wood. 1988a. Dynamics of herbaceous vegetation recovery on Mount St. Helens, Washington, USA, after a volcanic eruption. Vegetatio 47:11–27.
*del Moral, R., and D. M. Wood. 1988b. The high elevation flora of Mount St. Helens, Washington. Madro�o 35:309–319.
*del Moral, R., and D. M. Wood. 1993a. Understanding dynamics of early succession on Mount St. Helens. Journal of Vegetation Science 4:223–234.
*del Moral, R., and D. M. Wood. 1993b. Early primary succession on a barren volcanic plain at Mount St. Helens, Washington. American Journal of Botany 80:981–991.
*del Moral, R., D. M. Wood, and J. H. Titus. 2005. How landscape factors affect recovery of vegetation on barren surfaces. Pages 93–109 in V. H. Dale, F. J. Swanson, and C. M. Crisafulli, editors. Mount St. Helens 20 years after recovery. Springer, New York, New York, USA.
Fastie, C. L. 1995. Causes and ecosystem consequences of multiple pathways of primary succession at Glacier Bay, Alaska. Ecology 76:1899–1916.
Frenzen, P. M., K. S. Hadley, J. J. Major, et al. 2005. Geomorphic change and vegetation development on the Muddy River Mudflow deposit. Pages 75–91 in V. H. Dale, F. J. Swanson, and C. M. Crisafulli, editors. Mount St. Helens 20 years after recovery. Springer, New York, New York, USA.
*Fuller, R. N., and R. del Moral. 2003. The role of refugia and dispersal in primary succession on Mount St. Helens, Washington. Journal of Vegetation Science 14:637–644.
Grishin, S. Y., and R. del Moral. 1996. Dynamics of forests after catastrophic eruptions of Kamchatka�s volcanoes. Pp. 133–146 in I. M. Turner, C. H. Diong, S. S. L. Lim, and P. K. L. Ng, editors. Biodiversity and the dynamics of ecosystems. DIWPA Series, Vol. 1.
Grishin, S. Y., R. del Moral, P. V. Krestov, and V.P. Verkholat. 1996. Succession following the catastrophic eruption of Ksudach volcano (Kamchatka, 1907). Vegetatio 127:129–153.
Johnson, E. A., and K. Miyanishi. 2008. Testing the assumptions of chronosequences in succession. Ecology Letters 11:419–431.
Jones, C. C., and R. del Moral. 2009. Dispersal and establishment both limit colonization during primary succession on a glacier foreland. Plant Ecology 204:217–230.
Krebs, C. J. 2008. The ecological world view. CSIRO Publishing, Canberra, Australia.
Krebs, C. J. 2009. Ecology: the experimental analysis of distribution and abundance. Benjamin Cummings, San Francisco, California, USA.
Leendertse, P. C., A. J. M. Roozen, and J. Rozema. 1997. Long-term changes (1953–1990) in the salt marsh vegetation at the Boschplaat on Terschelling in relationship to sedimentation and flooding. Plant Ecology 132:49–58.
Lichter, J. 1998. Primary succession and forest development on coastal Lake Michigan sand dunes. Ecological Monographs 68:487–510.
Lichter, J. 2000. Colonization constraints during primary succession on coastal Lake Michigan sand dunes. Journal of Ecology 88:825–839.
Lipman, P. W., and D. R. Mullineaux. 1981. The 1980 eruptions of Mount St. Helens, Washington. Professional Paper 1250. U. S. Geological Survey. U. S. Government Printing Office. Washington, D.C., USA.
McCune, B., and D. Keon. 2002. Equations for potential annual direct incident radiation and heat load. Journal of Vegetation Science 13:603–606.
National Geographic Society. 2007. TOPO! Seamless USGS topographic maps on CD-ROM. National Geographic Holdings, Washington, D.C., USA.
Pfitsch, W. A., and L. C. Bliss. 1988. Recovery of net primary production in subalpine meadows of Mount St. Helens following the 1980 eruption. Canadian Journal of Botany 66:989–997.
Pickett, S. T. A., M. L. Cadenasso, and S. J. Meiners. 2009. Ever since Clements: from succession to vegetation dynamics and understanding to intervention. Applied Vegetation Science 12:9–21.
Poli Marchese, E., and M. Grillo. 2000. Primary succession on lava flows on Mt. Etna. Acta Phytogeographica Suecica 85:61–70.
Raunkiaer, C. 1934. The life forms of plants and statistical plant geography. Clarendon, Oxford, UK.
Schamin�e, J. H. J., S. M. Hennekens, M. Chytr�, and J. S. Rodwel. 2009. Vegetation�plot data and data bases in Europe: an overview. Preslia 81:173–185.
Smits, N. A. C., J. H. J. Schamin�e, and L. van Duuren. 2002. 70 years of permanent plot research in The Netherlands. Applied Vegetation Science 5:121–126.
Swanson, F. J., and J. J. Major. 2005. Physical events, environments and geological-ecological interactions at Mount St. Helens: March 1980–2004. Pages 27–44 in V. H. Dale, F. J. Swanson, and C. M. Crisafulli, editors. Mount St. Helens 20 years after recovery. Springer, New York, New York, USA.
*Tsuyuzaki, S., and R. del Moral. 1995. Species attributes in early primary succession on volcanoes. Journal of Vegetation Science 6:517–522.
U. S. Department of Agriculture. National Resource Conservation Service. 2009. The plants data base. The Plant Data Center, Baton Rouge, LA, US (http://plants.usda.gov. (Last Accessed October 15, 2009).
U. S. Fish and Wildlife Service. 1988. National list of vascular plant species that occur in wetlands. U.S. Fish and Wildlife Service Biological Report 88 (26.9).
U. S. Fish and Wildlife Service. 1993. 1993 supplement to list of plant species that occur in wetlands: Northwest (Region 9). Supplement to U.S. Fish & Wildlife Service Biological Report 88 (26.9).
*Walker, L. R., and R. del Moral. 2003. Primary succession and ecosystem rehabilitation. Cambridge University Press, Cambridge, UK.
Walker, L. R., and R. del Moral. 2009. Transition dynamics in succession: implications for rates, trajectories and restoration. Pages 33–49 in K. Suding and R. J. Hobbs, editors. New models for ecosystem dynamics and restoration. Island Press, Washington, D.C., USA.
*Wood, D. M., and R. del Moral. 2000. Seed rain during early primary succession on Mount St. Helens, Washington. Madro�o 47:1–9.