Appendix C. Duration of each species to reach carrying capacity.
|
|
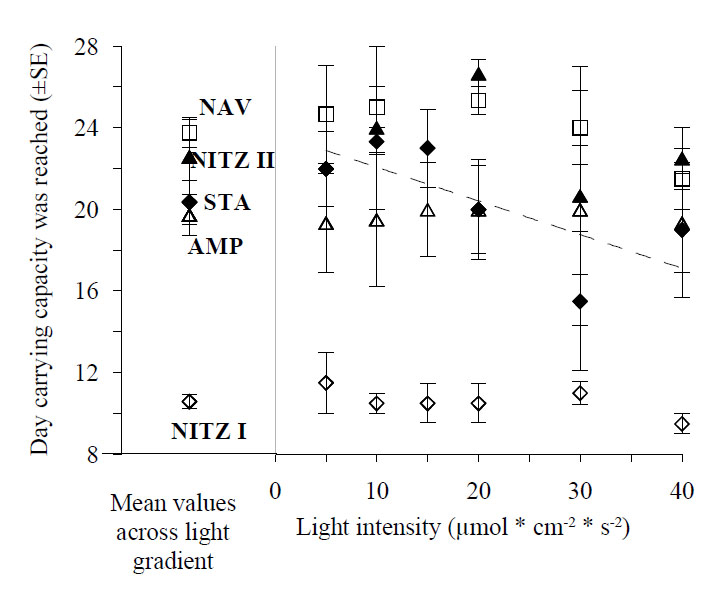
| FIG. C1. shows the day of experimental runtime when the individual species in monocultures reached carrying capacities. The tagged values are mean values across all light levels across a metacommunity. The dashed regression line shows that only STA reached carrying capacity marginal significantly earlier when light intensities where high (STA: r2 = 0.11, F1, 21 = 3.83, P = 0.06, regression slope = -0.16). |