Alexandra Weigelt, Elisabeth Marquard, Vicky M. Temperton, Christiane Roscher, Christoph Scherber, Peter N. Mwangi, Stefanie von Felten, Nina Buchmann, Bernhard Schmid, Ernst-Detlef Schulze, and Wolfgang W. Weisser. 2010. The Jena Experiment: six years of data from a grassland biodiversity experiment. Ecology 91:929.
METADATA
DATA SET DESCRIPTORS
A. Data set identity:
Title: The Jena Experiment: six years of data from a grassland biodiversity experiment.
B. Data set identification code
Suggested Data Set Identity Code: Jena_Biomass_02-08.csv and Jena_Community_02-08.csv
C. Data set description
Abstract:
This data set contains species-specific biomass and cover data as well as community leaf area index (LAI) and height from a large grassland biodiversity experiment (Jena Experiment). In this experiment, 82 grassland plots of 20 × 20 m were established from a pool of 60 species belonging to four functional groups (grasses, legumes, and tall and small herbs). In May 2002, varying numbers of plant species were sown into the plots to create a gradient of plant species richness (1, 2, 4, 8, 16, and 60 species) and functional richness (1, 2, 3, and 4 functional groups). Plots were maintained by biannual weeding and mowing. The data set encompasses the 2002–2008 May and August biomass harvests from 3–4 subplots of 0.2 × 0.5 m per experimental plot sorted to species. Moreover, plant species and community cover estimated in an approximately 9-m2 subplot per plot are included in the data set. Each biomass harvest was accompanied by measurements of vegetation height and LAI per plot. Analyses of the community biomass data have identified species richness as well as functional group composition as important drivers of a positive biodiversity–productivity relationship.
The data set can be used to study a variety of questions about how plant community composition and structure responds to changes in species richness and functional diversity over time. Sampling is ongoing, and new data will be added.D. Key words: biodiversity experiment; functional composition; height; LAI (leaf area index); plant community; species biomass; species cover.
RESEARCH ORIGIN DESCRIPTORS
All data included in this dataset were measured on the experimental grassland plots of the Jena Experiment from 2002 to 2008. The Jena Experiment is funded by the Deutsche Forschungsgemeinschaft (DFG, FOR 456), with additional support from the Friedrich Schiller University of Jena, the Max Planck Society, the University of Zurich, and the Swiss National Science Foundation (grant 3100AO-107531 to B. Schmid). Only parts of the data set have been published so far. This includes mean plot biomass from May 2003 (Roscher et al. 2005), from August 2003 and May 2004 (Bessler et al. 2009), annual species-specific and mean plot biomass from 2003 to 2007 (Marquard et al. 2009; Marquard et al., in prep.), annual mean biomass from 2003 alone (Scherber et al. 2006) and from 2006 alone (Eisenhauer et al., Ecology in press; Eisenhauer et al. Soil Biol Biochem in press), biomass of one subsample from May and August 2003 and 2004 (Roscher et al. 2009a), biomass of all subsamples from August 2005 (Weigelt et. al. 2008), mean plot biomass of one or three experimental blocks, respectively, from May and August 2003 and 2004 (Oelmann et al. 2007a,b), and species-specific biomass of the 60-species mixtures from May and August 2005 to 2007 (Petermann et al., Ecology in press). LAI, community height and species-specific cover over all years have not been used in publications so far except for cover of sown species from May 2004 (Roscher et al. 2009b). The following people have contributed to the data included in this file: biomass 2002–2004 (Vicky Temperton/Nina Buchmann), biomass 2005–2008 (Alexandra Weigelt), LAI 2003–2004 (Vicky Temperton/Nina Buchmann), height August 2002 (Vicky Temperton/Nina Buchmann), height August 2003 (Christoph Scherber/Wolfgang Weisser), height May 2004 (Peter Mwangi/Bernhard Schmid), LAI and height 2005–2008 (Alexandra Weigelt), species cover 2002–2004 and 2008 (Christiane Roscher), species cover 2005–2007 (Elisabeth Marquard/Bernhard Schmid). Those in the best position to answer questions concerning the data are Alexandra Weigelt ([email protected]), Elisabeth Marquard ([email protected]) and Christiane Roscher ([email protected]), those in the best position to answer questions concerning the experimental design are Jens Schumacher ([email protected]) and Bernhard Schmid ([email protected]).
Data set description
The metadata presented here correspond to the comma-separated-value data files named: Jena_ Biomass_02-08.csv and Jena_ Community_02-08.csv
There are two different kinds of missing values in both data sets: (1) Cells noted with "NA" indicate missing values due to the experimental design (i.e., species not sown on a respective plot). (2) Cells noted with "-9999" indicate that the information is not reported (i.e., missing sample of species sown on the respective plot), or not available at the time (e.g., species specific biomass in August 2004 where samples have not been sorted to species or LAI and community height in 2002 where these parameters have not been measured). This differentiation of missing values is important, e.g., for the calculation of plot and annual mean biomass. We included data of six additional plots not belonging to the main biodiversity gradient (management details of these plots see below): succession with mowing (plotcode B2A11 and B4A19), free succession (plotcode B3A15 and B4A23) and reference plots (plotcode B0A01 and B0A02). These plots were not sown and thus have no specific definition of species present. Missing values of individual species on these plots were coded with "NA" because no data could be expected at this point (i.e., missing biomass or cover of one of the 60 target species). However, missing community data were coded with "-9999" to indicate that information which could have been measured is not reported (i.e., missing LAI and community height).
Column numbers, headings and descriptions for file:
Jena_Biomass_02-08.csv
Column no. |
Header |
Description |
Unit |
1 |
plotcode |
Complete code of experimental plot |
|
2 |
block |
Identification (ID) of the block (1–4 blocks) |
|
3 |
plot |
ID of the plot |
|
4 |
subsample |
ID of the subsample (3 or 4 subsamples per plot) |
|
5 |
year |
Year of sampling |
|
6 |
month |
Month of sampling |
|
7 |
time |
Number of months after start of the experiment (1 = May 2002) |
|
8 |
X |
X-coordinate of 0/0 corner per large plot on a grid of the field site (see Fig. 1) |
m |
9 |
Y |
Y-coordinate of 0/0 corner per large plot on a grid of the field site (see Fig. 1) |
m |
10 |
x |
x-coordinate of subsample in each large plot relative to 0/0 corner per large plot (see Fig. 1) |
cm |
11 |
y |
y-coordinate of subsample in each large plot relative to 0/0 corner per large plot (see Fig. 1) |
cm |
12 |
sowndiv |
Number of species sown per plot |
|
13 |
numfg |
Number of functional groups sown per plot |
|
14 |
numgrass |
Number of grass species sown per plot |
|
15 |
numsherb |
Number of small herb species sown per plot |
|
16 |
numtherb |
Number of tall herb species sown per plot |
|
17 |
numleg |
Number of legume species sown per plot |
|
18 |
gr.ef |
Presence of grasses sown per plot, 0 = no, 1 = yes |
|
19 |
sh.ef |
Presence of small herbs sown per plot, 0 = no, 1 = yes |
|
20 |
th.ef |
Presence of tall herbs sown per plot, 0 = no, 1 = yes |
|
21 |
leg.ef |
Presence of legumes sown per plot, 0 = no, 1 = yes |
|
22–81 |
p[Species] |
Presence of single species with species abbreviations as given in lines 85–144 below |
|
82 |
unidentified.rest |
Sum of dry weight of unidentified parts OR sum of dry weight of species not belonging to the whole target species pool (all 60 species) on additional plots (free succession, succession with mowing, reference plots) |
g m-2 |
83 |
DOM |
Dry weight of dead organic material |
g m-2 |
84 |
target.biomass |
Sum of all sown species dry weights per subplot OR sum of dry weight of all species belonging to the whole target species pool (all 60 species) on additional plots (free succession, succession with mowing, reference plots) |
g m-2 |
85–144 |
[Species] |
Dry weight of single species and their respective functional group (special coding of missing values) |
|
85 |
Alo.pra |
Alopecurus pratensis (Grass) |
g m-2 |
86 |
Ant.odo |
Anthoxanthum odoratum (Grass) |
g m-2 |
87 |
Arr.ela |
Arrhenatherum elatius (Grass) |
g m-2 |
88 |
Ave.pub |
Avenula pubescens (Grass) |
g m-2 |
89 |
Bro.ere |
Bromus erectus (Grass) |
g m-2 |
90 |
Bro.hor |
Bromus hordeaceus (Grass) |
g m-2 |
91 |
Cyn.cri |
Cynosurus cristatus (Grass) |
g m-2 |
92 |
Dac.glo |
Dactylis glomerata (Grass) |
g m-2 |
93 |
Fes.pra |
Festuca pratensis (Grass) |
g m-2 |
94 |
Fes.rub |
Festuca rubra (Grass) |
g m-2 |
95 |
Hol.lan |
Holcus lanatus (Grass) |
g m-2 |
96 |
Luz.cam |
Luzula campestris (Grass) |
g m-2 |
97 |
Phl.pra |
Phleum pratense (Grass) |
g m-2 |
98 |
Poa.pra |
Poa pratensis (Grass) |
g m-2 |
99 |
Poa.tri |
Poa trivialis (Grass) |
g m-2 |
100 |
Tri.fla |
Trisetum flavescens (Grass) |
g m-2 |
101 |
Aju.rep |
Ajuga reptans (Small herb) |
g m-2 |
102 |
Bel.per |
Bellis perennis (Small herb) |
g m-2 |
103 |
Gle.hed |
Glechoma hederacea (Small herb) |
g m-2 |
104 |
Leo.aut |
Leontodon autumnalis (Small herb) |
g m-2 |
105 |
Leo.his |
Leontodon hispidus (Small herb) |
g m-2 |
106 |
Pla.lan |
Plantago lanceolata (Small herb) |
g m-2 |
107 |
Pla.med |
Plantago media (Small herb) |
g m-2 |
108 |
Pri.ver |
Primula veris (Small herb) |
g m-2 |
109 |
Pru.vul |
Prunella vulgaris (Small herb) |
g m-2 |
110 |
Ran.rep |
Ranunculus repens (Small herb) |
g m-2 |
111 |
Tar.off |
Taraxacum officinale (Small herb) |
g m-2 |
112 |
Ver.cha |
Veronica chamaedrys (Small herb) |
g m-2 |
113 |
Ach.mil |
Achillea millefolium (Tall herb) |
g m-2 |
114 |
Ant.syl |
Anthriscus sylvestris (Tall herb) |
g m-2 |
115 |
Cam.pat |
Campanula patula (Tall herb) |
g m-2 |
116 |
Car.pra |
Cardamine pratensis (Tall herb) |
g m-2 |
117 |
Car.car |
Carum carvi (Tall herb) |
g m-2 |
118 |
Cen.jac |
Centaurea jacea (Tall herb) |
g m-2 |
119 |
Cir.ole |
Cirsium oleraceum (Tall herb) |
g m-2 |
120 |
Cre.bie |
Crepis biennis (Tall herb) |
g m-2 |
121 |
Dau.car |
Daucus carota (Tall herb) |
g m-2 |
122 |
Gal.mol |
Galium mollugo (Tall herb) |
g m-2 |
123 |
Ger.pra |
Geranium pratense (Tall herb) |
g m-2 |
124 |
Her.sph |
Heracleum sphondylium (Tall herb) |
g m-2 |
125 |
Kna.arv |
Knautia arvensis (Tall herb) |
g m-2 |
126 |
Leu.vul |
Leucanthemum vulgare (Tall herb) |
g m-2 |
127 |
Pas.sat |
Pastinaca sativa (Tall herb) |
g m-2 |
128 |
Pim.maj |
Pimpinella major (Tall herb) |
g m-2 |
129 |
Ran.acr |
Ranunculus acris (Tall herb) |
g m-2 |
130 |
Rum.ace |
Rumex acetosa (Tall herb) |
g m-2 |
131 |
San.off |
Sanguisorba officinalis (Tall herb) |
g m-2 |
132 |
Tra.pra |
Tragopogon pratensis (Tall herb) |
g m-2 |
133 |
Lat.pra |
Lathyrus pratensis (Legume) |
g m-2 |
134 |
Lot.cor |
Lotus corniculatus (Legume) |
g m-2 |
135 |
Med.lup |
Medicago lupulina (Legume) |
g m-2 |
136 |
Med.var |
Medicago × varia (Legume) |
g m-2 |
137 |
Ono.vic |
Onobrychis viciifolia (Legume) |
g m-2 |
138 |
Tri.cam |
Trifolium campestre (Legume) |
g m-2 |
139 |
Tri.dub |
Trifolium dubium (Legume) |
g m-2 |
140 |
Tri.fra |
Trifolium fragiferum (Legume) |
g m-2 |
141 |
Tri.hyb |
Trifolium hybridum (Legume) |
g m-2 |
142 |
Tri.pra |
Trifolium pratense (Legume) |
g m-2 |
143 |
Tri.rep |
Trifolium repens (Legume) |
g m-2 |
144 |
Vic.cra |
Vicia cracca (Legume) |
g m-2 |
Column numbers, headings and descriptions for file:
Jena_ Community_02-08.csv
Column no. |
Header |
Description |
Unit |
1 |
plotcode |
Complete code of experimental plot |
|
2 |
block |
Identification (ID) of the block (1–4 blocks) |
|
3 |
plot |
ID of the plot |
|
4 |
year |
Year of sampling |
|
5 |
month |
Month of sampling |
|
6 |
time |
Number of months after start of the experiment (1 = May 2002) |
|
7 |
X |
X-coordinate of 0/0 corner per large plot on a grid of the field site (see Fig. 1) |
m |
8 |
Y |
Y-coordinate of 0/0 corner per large plot on a grid of the field site (see Fig. 1) |
m |
9 |
sowndiv |
Number of species sown per plot |
|
10 |
numfg |
Number of functional groups sown per plot |
|
11 |
numgrass |
Number of grass species sown per plot |
|
12 |
numsherb |
Number of small herb species sown per plot |
|
13 |
numtherb |
Number of tall herb species sown per plot |
|
14 |
numleg |
Number of legume species sown per plot |
|
15 |
gr.ef |
Presence of grasses, 0 = no, 1 = yes |
|
16 |
sh.ef |
Presence of small herbs, 0 = no, 1 = yes |
|
17 |
th.ef |
Presence of tall herbs, 0 = no, 1 = yes |
|
18 |
leg.ef |
Presence of legumes, 0 = no, 1 = yes |
|
19 |
LAI |
Community leaf area index (LAI) given as mean over 10 separate measurement taken along a transect of 10 m length |
|
20 |
SEL |
Standard error of mean LAI for single measurements |
|
21 |
DIFN |
Diffuse non-interceptance (fraction of sky visible to the LAI sensor) |
|
22 |
MTA |
Mean tilt angle of LAI sensor in degrees |
degrees |
23 |
SEM |
Standard error of MTA |
|
24 |
SMP |
Number of pairs of above and below observations that were included in the LAI calculations |
|
25 |
mean.height.veg |
Mean over column 25–34; 10 separate measurements of highest leaves taken along a transect of 10 m length at 1 m distances |
m |
26 |
mean.height.flo |
Mean over column 35–44; 10 separate measurements of highest flower (if present) taken along a transect of 10 m length at 1 m distances |
m |
27 |
height.1.veg |
Height of highest leaf of randomly chosen target individual at meter 1 of a 10 m transect |
m |
28 |
height.2.veg |
Height of highest leaf of randomly chosen target individual at meter 2 of a 10 m transect |
m |
29 |
height.3.veg |
Height of highest leaf of randomly chosen target individual at meter 3 of a 10 m transect |
m |
30 |
height.4.veg |
Height of highest leaf of randomly chosen target individual at meter 4 of a 10 m transect |
m |
31 |
height.5.veg |
Height of highest leaf of randomly chosen target individual at meter 5 of a 10 m transect |
m |
32 |
height.6.veg |
Height of highest leaf of randomly chosen target individual at meter 6 of a 10 m transect |
m |
33 |
height.7.veg |
Height of highest leaf of randomly chosen target individual at meter 7 of a 10 m transect |
m |
34 |
height.8.veg |
Height of highest leaf of randomly chosen target individual at meter 8 of a 10 m transect |
m |
35 |
height.9.veg |
Height of highest leaf of randomly chosen target individual at meter 9 of a 10 m transect |
m |
36 |
height.10.veg |
Height of highest leaf of randomly chosen target individual at meter 10 of a 10 m transect |
m |
37 |
height.1.flo |
Height of highest flower (if present) of the same randomly chosen target individual as for column 27 |
m |
38 |
height.2.flo |
Height of highest flower (if present) of the same randomly chosen target individual as for column 28 |
m |
39 |
height.3.flo |
Height of highest flower (if present) of the same randomly chosen target individual as for column 29 |
m |
40 |
height.4.flo |
Height of highest flower (if present) of the same randomly chosen target individual as for column 30 |
m |
41 |
height.5.flo |
Height of highest flower (if present) of the same randomly chosen target individual as for column 31 |
m |
42 |
height.6.flo |
Height of highest flower (if present) of the same randomly chosen target individual as for column 32 |
m |
43 |
height.7.flo |
Height of highest flower (if present) of the same randomly chosen target individual as for column 33 |
m |
44 |
height.8.flo |
Height of highest flower (if present) of the same randomly chosen target individual as for column 34 |
m |
45 |
height.9.flo |
Height of highest flower (if present) of the same randomly chosen target individual as for column 35 |
m |
46 |
height.10.flo |
Height of highest flower (if present) of the same randomly chosen target individual as for column 36 |
m |
47 |
cover.target |
Proportion of total area that is covered by sown species per estimated plot area |
% |
48 |
cover.weeds |
Proportion of total area that is covered by non-sown species per estimated plot area |
% |
49 |
cover.bare.ground |
Proportion of total area that is covered by bare ground per estimated plot area |
% |
50 |
cover.dead |
Proportion of total area that is covered by dead material per estimated plot area |
% |
51–111 |
[Species] |
Cover estimates of single species (abbreviations as given in lines 85–144 in metadata table 1) per estimated plot area |
% |
Methods
We encourage users of this data set to read the detailed methods that have appeared in Roscher et al. (2004) and Marquard et al. (2009) and other papers cited above.
Description of the study area and experimental design:
The field site of the Jena Experiment encompasses approx. 10 ha of former agricultural land in the floodplain of the river Saale near Jena (Germany, 50°55' N, 11°35' E, 130 m altitude). The area around Jena is characterized by a mean annual air temperature of 9.3 °C, and a mean annual precipitation of 587 mm (Kluge and Müller-Westermeier 2000). The soil consists of sandy loam in the vicinity of the river which gradually changes to silty clay with increasing distance from the river.
In May 2002, 82 plant assemblages of common Central European grassland species were sown with a total of 1000 viable seeds per m² on plots of 20 × 20 m that had been kept fallow in the year before sowing, harrowed bimonthly and treated with glyphosate (Roundup, Monsanto company, St. Louis, Missouri USA) in July 2001. Species compositions were determined by constrained random selection from a pool of 60 species. Based on a cluster analysis of ecological and morphological traits, these 60 target species had been assigned to four functional groups: 16 grasses, 12 small herbs, 20 tall herbs and 12 legumes. Details about species traits and trait data measured on additional monoculture plots of all species were published elsewhere (Roscher et al. 2004, Heisse et al. 2007). In mixtures, all species were sown with equal proportions and in plots with more than one functional group all functional groups were sown as evenly as possible (Roscher et al. 2004). Table 1 in Marquard et al. (2009) shows the sown levels of species richness and functional group richness as well as the sown proportions of each functional group at the different diversity levels. Species richness, functional group richness and the presence of the functional groups were varied as orthogonally as possible. However, there were not enough legumes and small herbs in the overall species pool to assemble them in mixtures with 16 species of the same functional group. Each functional group was sown in four monocultures, six 2-species mixtures, ten 4-species mixtures, ten 8-species mixtures, nine or ten 16-species mixtures and all four 60-species mixtures which resulted in the presence of each functional group on 43 (legumes and small herbs) or 44 (tall herbs and grasses) of the 82 plots.
All experimental plots were maintained without fertilizer application and mown twice a year (in early June and early September). Species occurring on plots where they had not been sown were removed during biannual weeding campaigns (at the beginning of the growing season and after the first mowing). Weeding was mainly done by hand; herbicides were used where target species composition allowed their application (herbicides against dicotyledonous plants in pure grass communities and against grasses on plots with herbs or legumes only). Empirical data showed that the application of herbicides did not affect the relationship between biodiversity and aboveground community biomass: on each of our grassland plots, a small subplot was only weeded and never treated with herbicides. These subplots showed the same biodiversity–productivity relationship as observed on the remaining area of the plots (Roscher et al. 2009a). The weeding treatment however might have decreased or increased the biodiversity–productivity relationship to some extent because low-diversity plots had to be weeded more intensively than high-diversity plots (Weigelt, unpublished data).
We also included data of 6 additional 20 × 20 m plots not belonging to the main biodiversity gradient. These are four succession plots which received the same soil preparations as all other large plots in 2001 (fallow land, harrowing, glyphosate treatment) but no sowing of plant species in May 2002. Two of these four plots were mown twice a year together with the rest of the experimental plots (succession with mowing, plotcode B2A11 and B4A19) and two were left without mowing (free succession, plotcode B3A15 and B4A23). In addition, one plot on each of two managed grasslands less than 100 m south and north of the field site were measured (reference plots, plotcode B0A01 and B0A02, respectively). These grasslands were also mown twice a year in early June and September and received no fertilizer. All additional plots were not weeded.
The field site was divided into four blocks to account for altering soil and water conditions. Plots of all diversity levels were distributed in nearly equal shares across all four blocks. Weeding, mowing and herbicide application were completed blockwise in rotating order.
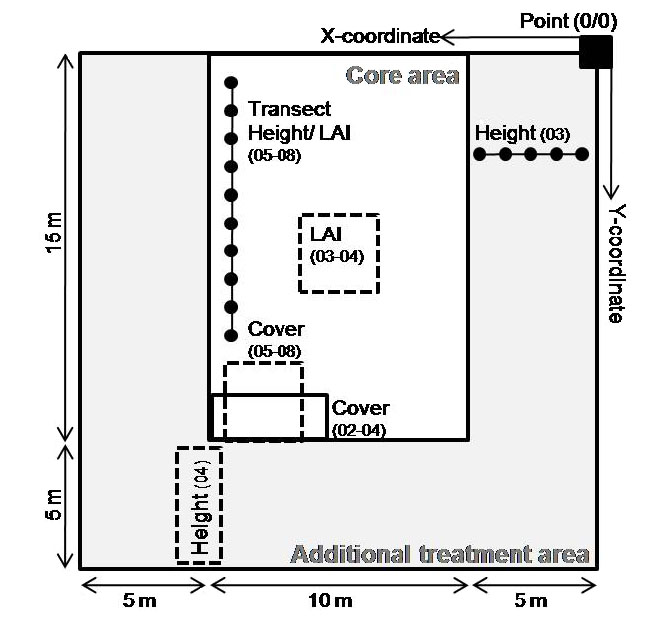
Each 20 × 20 m plot was subdivided according to Fig. 1. The 'core area' was exclusively used for non-destructive measurements without any additional treatment but the sown diversity gradient. The 'additional treatment area' contained subplots with, e.g., planted phytometers, free invasion, insecticide application, earthworm or small mammal exclusion, fertilization or minirhizotrones as well as control areas without additional treatments where the measurements of community height were taken in 2003 and 2004.
|
|
| FIG. 1. Subdivision of experimental plots in the Jena-Experiment. |
Response variables:
Biomass harvest: Aboveground community biomass was harvested in September 2002 and from 2003–2008 twice a year just prior to mowing (during peak standing biomass in late May and in late August) on all experimental plots. This was done by clipping the vegetation at 3 cm above ground in four (in May 2005 and from August 2007 onwards only three) rectangles of 0.2 × 0.5 m per large plot. The location of these rectangles was assigned prior to each harvest by random selection of coordinates (given as × and y coordinates in file 'Jena_ Biomass_02-08.csv') within the core area of the plots (Fig. 1). The positions of the rectangles within plots were identical for all plots at a particular harvest. The harvested biomass was sorted into target species (species sown at the particular plot), total weeds (species not sown at the particular plot) and detached dead organic material and dried to constant weight (70°C, ≥ 48 h). In August 2004, the harvested biomass samples were not sorted into species (they were only sorted into legumes and non-legumes; data not reported). For all biomass harvests in 2003 and 2004 the biomass subsample number 4 was collected in an extra carefully weeded subplot of the core area, e.g., weeding of this area was performed by a few very well trained people in a short period of time while the rest of the large plots was weeded by a large number of trained but less experienced student helpers and took up to three weeks per campaign.
To calculate plot and annual means from the species specific biomass given per subplot it is important to be aware of the special missing values in the data set. Subplots with single missing values indicated by "-9999", result in a difference between the following means: (1) first sum up species specific biomass per subplot and then average over the subplots or (2) first average species specific biomass over subplots and then sum these averages to get an overall plot mean.
LAI measurement: Community leaf area index (LAI) was measured twice a year just before biomass harvest (during peak standing biomass in late May and in late August) from 2003 to 2008 with a LAI-2000 plant canopy analyzer (LI-COR) using high resolution and a view cap masking 45° of the azimuth towards the operator. In 2003 and 2004, 10 randomly allocated measurements were taken at 5 cm height (i.e., the height of the lens above the ground when the sensor was placed on the ground) within an area of 3 × 3 m in the center of the core area (Fig. 1). From 2005 onwards all measurements were taken along a 10 m transect (Fig. 1) in the core area of each experimental plot. One above reading was taken at the first transect point, followed by 10 below readings taken at 5 cm height and with 1 m distance from each other. Given in the dataset is the mean over the 10 calculated LAI values from the below readings as mean community LAI per plot.
Vegetation height: Plant height was measured twice a year just before biomass harvest (during peak standing biomass in late May and in late August) concurrently to LAI from 2002 to 2008, except for May 2003 and August 2004. In August 2002, stretched height of 3 target plant individuals (if present) per sown species was measured in the core area of each experimental plot (Fig. 1). Given is mean stretched height over all species measured per plot. In August 2003, 30 target plant individuals were harvested at 10 cm distances along a 5 m transect in a control area (no additional treatments) at the margin of each experimental plot (Fig. 1). Given is the mean length of the main axis for these 30 individuals. In May 2004, standing height (without stretching the plant) was measured at three points in another control area at the margin of each experimental plot (Fig. 1). From 2005 onwards all measurements were taken along a 10 m transect (Fig. 1) in the core area of each experimental plot using a rule. Standing height of the highest leaf and flower (if present) of target plant individuals was recorded at 10 points along the transect separated by 1 m each. The community data table gives all individual measurements as well as the mean standing community height.
Species and community cover: Sown species cover was visually estimated in September 2002 and twice a year just before biomass harvest (during peak standing biomass in late May and in late August) from 2003 to 2008. Community cover data (columns 47–50) were estimated directly as percentages. Single species cover data (columns 51–111) were estimated using the cover classes given below. From 2002 to 2004, measurements were taken in two extra carefully weeded sub-areas of 2 × 2.25 m (Fig. 1, see explanation above for weeding). We report the average value based on these two estimates for community cover (columns 47–50). For single species cover, we report the smaller of the two estimates in cover classes as a conservative measure if cover values differed by only one cover class between sub-areas and the intermediate cover class if cover values differed by two or more cover classes between sub-areas (columns 51–111). From 2005 onwards all measurements were taken in one 3 × 3 m area in the core area of each experimental plot (Fig. 1). 0 = species missing; 1: ≤ 1%; 2: 1 % < × ≤ 5%; 10: 5 % < × ≤ 15%; 20: 15 % < × ≤ 25%; 30: 25 % < × ≤ 35%; 40: 35 % < × ≤ 45%; 50: 45 % < × ≤ 55%; 60: 55 % < × ≤ 65%; 70: 65 % < × ≤ 75%; 80: 75 % < × ≤ 85%; 90: > 85%. See below for comments on weed cover.
Weed cover: In the file "Jena_Community_02-08.csv" column 48 gives the cover of weed species, e.g., all non-sown species per plot. This data is included as a measure of weed pressure shortly before biomass harvest, but it is no standardized measurement and we strongly advise users to handle this variable with care for two reasons: (1) the large area of experimental plots in the Jena Experiment leads to weeding periods of 3–5 weeks depending on weather conditions. (2) Increasing weed pressure over time made it sometimes impossible to weed all plots twice a year, especially when unfavorable weather conditions restricted the time frame when weeding was possible (wet soil conditions and high vegetation would have caused too much damage if weeding would have been carried out). Therefore plot specific time between last weeding and vegetation cover estimates varies from 3–8 weeks or even up to a year depending on the time when the plot was last weeded.
DATA-USE POLICY
The data presented here are publicly available. Those wishing to publish results from this data set should read this metadata document. The data set should be cited as: Weigelt, Alexandra, Elisabeth Marquard, Vicky M. Temperton, Christiane Roscher, Christoph Scherber, Peter N. Mwangi, Stefanie von Felten, Nina Buchmann, Bernhard Schmid, Ernst-Detlef Schulze, and Wolfgang W. Weisser. 2010. The Jena Experiment: six years of data from a grassland biodiversity experiment. Ecology 91:929.
The following analyses using either species-specific biomass or cover data from 2003 to 2008 are in preparation:
1. Biodiversity and sustaining ecosystem functioning across several years. E. Allen, W. W. Weisser, H. Hillebrand et al. This paper will test for temporal multifunctionality, i.e., if more species are required to maintain functioning across several subsequent years. We analyzed species-specific biomass data, calculating the number of species required to ensure 50% of biomass productivity per plot for single years and for multiple years.
2. How abiotic and biotic filters influence phylogenetic dispersion in grassland communities. E. Allen, A. Fergus, T. Jenkins, B. Schmid et al. This approach tests if communities which have been randomly assembled initially, become increasingly phylogenetically structured with time. We will calculate phylogenetic diversity based on abundance data for each plot in each year.
3. Stability in space and time: a case study using plant biomass. R. Proulx, E. Allan, A. Weigelt et al. In this approach we calculate determinism and multivariate CV using species-specific biomass over time to see if biomass stability in space, between seasons (May and August) and between years changes with increasing diversity of the plant community.
4. Plant traits as predictors for species yields in experimental grasslands. C. Roscher, A. Lipowsky, M. Gubsch, N. Buchmann, B. Schmid, E.-D. Schulze et al.. In this study we analyze morphological, ecophysiological and demographic plant traits measured for all species in monocultures and mixtures as predictors for species yields, its temporal changes including weather data and explore the role of plant functional trait plasticity.
5. Relationships between mean plant functional traits, functional trait diversity and ecosystem processes. C. Roscher, J. Schumacher, A. Lipowsky, M. Gubsch, N. Buchmann, B. Schmid, E.-D. Schulze et al. Using a method based on Rao’s quadratic diversity (Schumacher and Roscher 2009) we assess the importance of abundance-weighted mean trait values and functional trait diversity. This analysis uses plant functional traits measured in monocultures and species mixtures and incorporates trait plasticity.
ACKNOWLEDGMENTS
We wish to thank the numerous people who helped to maintain the experimental plots, especially S. Eismann, S. Junghans, S. Hengelhaupt, U. Köber, K. Kunze, H. Scheffler, U. Wehmeier and G. Kratzsch. The Jena Experiment is funded by the Deutsche Forschungsgemeinschaft (DFG, FOR 456), with additional support from the Friedrich Schiller University of Jena, the Max Planck Society, the University of Zurich, and the Swiss National Science Foundation (grant 3100AO-107531 to B. Schmid).
LITERATURE CITED
Beßler, H., V. M. Temperton, C. Roscher, N. Buchmann, B. Schmid, E. D. Schulze, W. W. Weisser, and C. Engels. 2009. Aboveground overyielding in grassland mixtures is associated with reduced biomass partitioning to belowground organs. Ecology 90:1520–1530.
Eisenhauer, N., H. Beßler, C. Engels, G. Gleixner, M. Habekost, A. Milcu, S. Partsch, A. C. W. Sabais, C. Scherber, S. Steinbeiss, A. Weigelt, W. W. Weisser, and S. Scheu. 2009. Plant diversity effects on soil microorganisms support the singular hypothesis. Ecology, in press.
Eisenhauer, N., A. Milcu, A. C. W. Sabais, H. Bessler, A. Weigelt, C. Engels, and S. Scheu. 2009. Plant community impacts on the structure of earthworm communities depend on season and change with time. Soil Biology and Biochemistry, in press.
Heisse, K., C. Roscher, J. Schumacher, and E. D. Schulze. 2007. Establishment of grassland species in monocultures: different strategies lead to success. Oecologia 152:435–447.
Kluge, G., and G. Müller-Westermeier. 2000. Das Klima ausgewählter Orte der Bundesrepublik Deutschland: Jena. Deutscher Wetterdienst, Offenbach/Main.
Marquard, E., B. Schmid, and A. Weigelt. Contrasting species performance in monoculture and mixture explains temporal changes in biodiversity effects. In preparation.
Marquard, E., A. Weigelt, V. M. Temperton, C. Roscher, J. Schumacher, N. Buchmann, M. Fischer, W. W. Weisser, and B. Schmid. 2009. Plant species richness and functional composition drive overyielding in a 6-year grassland experiment. Ecology, in press.
Oelmann, Y., Y. Kreutziger, V. M. Temperton, N. Buchmann, C. Roscher, J. Schuhmacher, E. D. Schulze, W. W. Weisser, and W. Wilcke. 2007a. Nitrogen and phosphorus budgets in experimental grasslands of variable diversity. Journal of Environmental Quality 36:396–407.
Oelmann, Y., W. Wilcke, V. M. Temperton, N. Buchmann, C. Roscher, J. Schumacher, E. D. Schulze, and W. W. Weisser. 2007b. Soil and plant nitrogen pools as related to plant diversity in an experimental grassland. Soil Science Society of America Journal 71:720–729.
Petermann, J. S., A. J. F. Fergus, C. Roscher, L. A. Turnbull, A. Weigelt, and B. Schmid. Biology, chance or history? The predictable re-assembly of temperate grassland communities. Ecology, in press.
Roscher, C., J. Schumacher, J. Baade, W. Wilcke, G. Gleixner, W. W. Weisser, B. Schmid, and E.-D. Schulze. 2004. The role of biodiversity for element cycling and trophic interactions: an experimental approach in a grassland community. Basic and Applied Ecology 5:107–121.
Roscher, C., V. M. Temperton, M. Scherer-Lorenzen, M. Schmitz, J. Schumacher, B. Schmid, N. Buchmann, W. W. Weisser, and E. D. Schulze. 2005. Overyielding in experimental grassland communities - irrespective of species pool or spatial scale. Ecology Letters 8:419–429.
Roscher, C., V. M. Temperton, N. Buchmann, and E.-D. Schulze. 2009a. Community assembly and biomass production in regularly and never weeded experimental grasslands. Acta Oecologia 35:206–217.
Roscher, C., H. Beßler, Y. Oelmann, C. Engels, W. Wilcke, and E.-D. Schulze. 2009b. Resources, recruitment limitation and invader species identity determine pattern of spontaneous invasion in experimental grasslands. Journal of Ecology 97:32–47.
Scherber, C., P. N. Mwangi, V. M. Temperton, C. Roscher, J. Schumacher, B. Schmid, and W. W. Weisser. 2006. Effects of plant diversity on invertebrate herbivory in experimental grassland. Oecologia 147:489–500.
Schumacher, J., and C. Roscher. 2009. Differential effects of functional traits on aboveground biomass in semi-natural grasslands. Oikos, in press.
Weigelt, A., J. Schumacher, C. Roscher, and B. Schmid. 2008. Does biodiversity increase spatial stability in plant community biomass? Ecology Letters 11:338–347.