Kerry D. Woods. 2009. Multi-decade, spatially explicit population studies of canopy dynamics in Michigan old-growth forests. Ecology 90:3587.
INTRODUCTION
Assessment of hypotheses concerning plant population and community dynamics and the role of species interactions in regulating community and ecosystem properties requires data-sets of appropriate temporal and spatial scale and resolution. With only rare exceptions, experimental approaches to such study use assemblages of fast-growing species with short generation times, observed over periods of a few years. While such studies have generated many insights, generalizing their findings to communities of large, long-lived species requires the problematic assumption that species of very different life-histories will display similar properties in interaction. 'Slow systems' dominated by species with competitive life-history properties and behaviors are likely to manifest different properties and dynamics from those observed in assemblages of weedy, opportunistic species. Consequently, for even much-studied slow systems, we have relatively little understanding of dynamic spatio-temporal properties, regulation of species coexistence and diversity, effects of population dynamics and interactions on productivity, and how these properties might interact with environmental change.
Late-successional forests of eastern North America are probably among the most intensively studied ecosystems, but, with dominant species that can live several centuries, are particularly subject to these constraints on powerfully assessing hypotheses and models. The generation of hypotheses about community structure and population processes has long outpaced the availability of appropriate data for testing those hypotheses. Consequently, decades-long debates about the relative importance of equilibrial and non-equilibrial processes, the effects of disturbance at various scales, and processes regulating diversity and coexistence remain unresolved. Ultimately, most attempts to address questions about long-term dynamics in these systems are based on either chronosequence ('space-for-time') studies at some scale, paleoecological reconstruction, or simulation modeling, and each of these approaches is subject of significant limitations without long-term observational data.
Space-for-time studies, using spatial distributions to infer temporal processes, include both classical successional studies and a wide range of analyses of 'gap-phase' and mosaic dynamics at finer spatial scales. Such inference is subject to critical assumptions about constancy of driving forces and equilibrial properties of the system (Pickett 1989). Paleoecological approaches, while often challenging the assumptions of space-for-time studies, at least for some scales, are themselves constrained by availability of appropriate deposition sites and limited spatial and temporal resolution and can resolve within-stand patterns and dynamics only in very special circumstances (Calcote 1998, Jackson and Kearsley 1998, Parshall 1999, Arseneault 2004). Similar issues apply to most historical data, such as early land surveys (e.g., Cogbill et al. 2002). Consequently, empirical data availability for address of population and community processes in late-successional forests suffers from a 'blind-spot' with regard to temporal dynamics over periods of decades to a few centuries and for spatial patterns at resolutions of tens to hundreds of meters. These are precisely the scales at which critical population and community processes -- stand dynamics -- presumably play out. Stand reconstruction techniques can offer appropriate spatial and temporal resolution (e.g. Henry and Swan 1974, Abrams et al. 1998), but are restricted in spatial extent by labor-intensiveness. While simulation models can address these spatial and temporal scales (see Busing and Mailly 2004), structuring and parameterizing models without long-term data can be subject to assumptions similar to space-for-time approaches; the most sophisticated models of forests comparable to those addressed here (see Pacala et al. 1996 and subsequent publications) are based on current spatial pattern and short-term measurements of growth, mortality, and fecundity.
The value of long-term (multi-decade), high-resolution data derived for circumventing some of these problems has long been recognized (Magnuson 1990, Swanson and Sparks 1990). Quantitative monitoring of networks of permanent plots may offer the most valuable kinds of data (Bakker et al. 1996, 2002, Bekker et al. 2007) However, the inherent time-scales of late-successional forests impose logistical constraints on the initiation of new studies specifically directed towards very long-term observation. Multi-decade permanent-plot studies remain very few, and only a handful of these are in late-successional forests (e.g., Peet 1984, Whitney 1984, Jackson and Abrell 1994, Fulton and Harcombe 2002, Woods 2000a, 2000b, 2007, Lin and Augspurger 2006, Holmes 2006). Among these, most are based on total sampled areas of less than 1.0 ha, and very few allow tracking of individual stems over time. No LTER sites in eastern temperate forests involve work in old-growth systems. Consequently, understanding of late-successional forest communities and populations retains a large anecdotal element and many widely cited hypotheses about late-successional dynamics remain poorly tested (see, for example, Christensen and Peet 1984, Leps and Rejmanek 1991 and expectations concerning predictability and convergence in late succession).
Further, newly initiated permanent-plot studies, lacking retrospective base-line, are at a disadvantage in addressing some of the questions most demanding of long-term observation (e.g., assessment of the effects of new kinds of environmental change). This places a particularly high value on exploitation of existing data with signficant temporal depth, even though use of such data-sets is hampered by problems of data retrieval, differences in measurement approaches and data format, etc. (Woods 2007).
The data-sets presented here span up to seven decades with multiple measurements over a network of permanent plots in old-growth forests in northern Michigan, USA. As such they are among the longest-term quantitative, plot-based records for old-growth forests in eastern North America (see Parker and Leopold (1985), Spetich and Parker (1998) for the only old-growth study, to my knowledge, of longer duration). The high sampling intensity (256 sample plots, totaling ca. 20 ha within a 100 ha stand) and spatial regularity of the plot network further enhances potential for analyses across spatial scales. Data published here have already been used to address questions and test hypotheses concerning long-term dynamics of tree populations and community composition at various scales, interactions between disturbance and species coexistence, and the effects of new pathogens. I hope availability to the research community will support further analyses both direct and comparative.
|
|
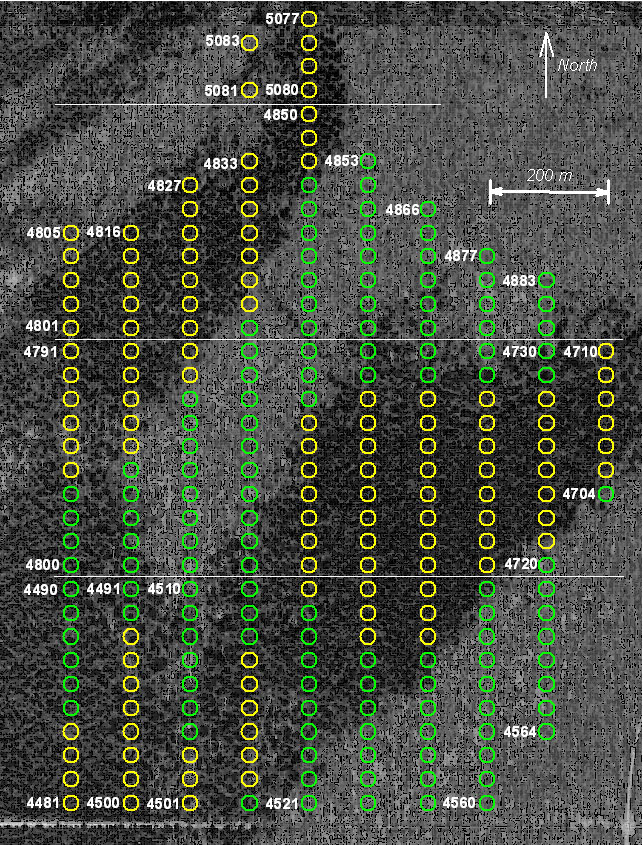
| FIG. 1. Sample plot network within the Dukes RNA. Circles represent 0.2 acre (809 m2, radius 16.05 m) permanent plots, spaced 2 chains (40.23 m) apart in N-S lines and 5 chains (100.58 m) apart E-W. Total sampled area is approximately 20 ha, or 20% of the entire stand. Plot numbering is in four series separated by horizontal white lines; within series, plot numbers are sequential in N-S lines of 10 with numbering proceeding in alternating direction in each line; plot numbers are displayed to demonstrated sequence in first three rows (SW corner of stand), and at other points to identify starting numbers for new series. Green plot symbols represent upland plots that have been remeasured, with mapping of stems, 3–4 times since 1989; yellow symbols are plots on saturated soils (organic peats and mucks) and have been sampled less frequently and without stem-mapping. The backdrop image is from a U.S. Geological Survey orthophoto (obtained on-line through NASA-WorldWind software) during leaf-off conditions; upland stands dominated by deciduous trees are shown in lightest grays, darkest grays are generally Thuja-dominated swamp forests. Swamp forests lie 1–2 m lower than surrounding uplands; overall, elevation ranges from about 335 m asl (near plot 4560) to about 329 m asl (at northernmost boundary of the RNA). The road intersection at extreme SE corner of image is between Larson Road or U.S. Forest Service Forest Road 2918 (NS) and Selma Rd or Forest Road 2915 (EW) in Skandia Township, Marquette Co., Michigan, USA. |
METADATA
CLASS I. DATA SET DESCRIPTORS
A. Data set identity: Title: Repeated measurements of woody stems, 1935-2004, from permanent plots in the Dukes Research Natural Area, Hiawatha National Forest, Michigan, USA.
B. Data set identification code: Suggested data set identity code: Dukes_RNA_plots
C. Data set description
Principal Investigator: Kerry D. Woods, Natural Sciences, Bennington College, Bennington, VT USA
Abstract: Established in 1935, a regular grid of 256 permanent plots includes about 20% of a 100-ha old-growth forest at the Dukes Research Natural Area in northern Michigan, USA. Woody stems have been re-measured 3–7 times providing extensive quantitative records of population and community dynamics over periods of up to 72 years. Woody stems in upland hemlock–northern hardwood stands, about half of the study plots, have been mapped and individually tracked since about 1990. Remaining plots are in swampy stands dominated by Fraxinus nigra and Thuja occidentalis. Detailed, long-term demographic data for late-successional forests are rare in general; this data set is both of exceptional duration and unusual in spatial intensity and detail. Because sample plots are in a regular array over the stand, they can support analyses of spatiotemporal pattern at various scales. A major wind disturbance in 2002 provides a unique opportunity to compare disturbance response to baseline dynamics. Several publications based on this data set have already provided new insights into late-successional processes, but general availability of the data set with metadata should permit a range of further comparative and integrative analyses. The study is ongoing, and new measurements will be added to the archived data set.
D. Key words: Acer saccharum; Betula alleghaniensis; Fagus grandifolia; Fraxinus nigra; long-term studies; northern hardwood forest; old-growth forest; permanent plots; succession; Thuja occidentalis; tree mapping; Tsuga canadensis.
CLASS II. RESEARCH ORIGIN DESCRIPTORS
A. Overall project description
Identity: Multi-decade, spatially explicit population studies of tree community and population dynamics in Michigan old-growth forests.
Originator: Identity of individuals involved in first two plot measurement periods (1935 and 1948) is unknown. Measurements in 1974–1980 were under direction of Dr. Frederick Metzger, then at the Northern Hardwood Laboratory of the North-Central Forest Experiment Station, U.S. Forest Service. All subsequent work (1989 onward) under direction of K. D. Woods.
Period of Study: Woody stems censused at various intervals and varying minimum size from 1935 through 2004. Stem mapping began in 1989.
Objectives: This study has the general objective of testing hypotheses about compositional dynamics and spatial and temporal patterns in late-successional forests through direct, quantitative measurement over time, and to compare these patterns across compositional gradients within the study site. It is also intended to provide baseline data for comparison with long-term records from managed forests, for assessment of long-term community response to environmental change, and for opportunistic assessment of the effects of rare events on forest dynamics.
Abstract: Same as above.
Sources of funding: Andrew W. Mellon Foundation, U.S. Forest Service, National Science Foundation.
B. Specific subproject description
Site description: The 100-ha Dukes Research Natural Area (RNA) (Fig. 1) is part of the Hiawatha National Forest in northern Michigan, USA (46º02'N, 87º09'W). Lake Superior lies ca. 15 km to the north, and influences a generally continental, cool-temperate climate. At Marquette, Michigan (30 km NW from the study site), annual average temperature 1970–2000 was 4.2 C (average January temperature = -10.9 C, average July temperature = 18.3 C), and annual precipitation averaged 92 cm. Snowfall is high, generally exceeding 400 cm per winter.
Total relief within the RNA is < 10 m, but soil drainage, texture, and chemistry vary greatly. Soils of mesic upland areas (about half the study area) are developed on thick glacial till over Paleozoic sedimentary bedrock, and range from sandy to silty loams (Munising and Shoepac-Trenary series silt-loams, Munising fine sandy loam; Schwenner 2007); these are classified as haplorthods and fragiorthods, with cation exchange capacities classed as 'active' to 'superactive' (Soil Survey Staff 1999). These areas are typically strongly hardwood documented (especially Acer saccharum). Somewhat poorly drained silt-loams (Sundell series; hapludolls with superactive CEC) frequently have well-developed shallow hard-pans and support mixtures of northern hardwood species and Tsuga canadensis. Soils in the remainder of the RNA are poorly drained organic mucks and peats (Nahma mucks, Carbondale and Tawas peats and mucks; humaquepts and haplosaprists respectively) that are generally of relatively high pH (5.8–7.0) and CEC.
Forests of upland areas are typical of 'hemlock-northern hardwood' late-successional forests of the region, dominated by mixtures of highly shade-tolerant Acer saccharum, Fagus grandifolia, and Tsuga canadensis, along with varying amounts of Betula alleghaniensis, Tilia americana, and Acer rubrum. Fagus has been present locally <1000 yr (Woods and Davis 1989), and its regional range-limit is < 10 km to the west. Peaty wetlands are dominated by Thuja occidentalis, Picea mariana and P. glauca, Fraxinus nigra, Acer rubrum, and, formerly, Ulmus americana along with admixtures of species more prominent on uplands (Woods 2000b, 2004, 2007).
There is no record or evidence of logging within the RNA. Increment cores confirm that populations of shade-tolerant canopy dominants are mixed-age, with maximum ages approaching 400 yr (unpublished data), indicating that there have been no stand-initiating disturbances for several centuries, probably > 500 yr. Stand-initiating disturbances, primarily extreme winds, are estimated to occur in this region with return times of several millennia (Canham and Loucks 1984, Frelich and Lorimer 1991, Zhang et al. 1999) Only a handful of unlogged mesic forests remain in the larger region, but it is reasonable to assume that, in terms of successional status, the RNA is representative of a significant fraction of the pre-settlement landscape. The RNA is buffered on all sides by never-cleared stands experimentally managed with long cutting cycles and high residual basal area.
Permanent plots were established throughout the RNA in 1935, and subsequent remeasurements show compositional trends towards increasing dominance of shade-tolerant species (especially Fagus) and commensurate declines in less tolerant dominant species (especially Betula alleghaniensis in uplands, Fraxinus nigra in swampy forests). Even in centuries-old stands, non-equilibrial, essentially successional dynamics dominate compositional trends. Compositional trends appear to depend on local habitat, primarily soil properties, and are convergent within relatively uniform habitat patches. (Woods 2000, 2007).
In 2002, the stand was affected by a local but intense wind-storm. Immediate consequences for upland areas were consistent with interpretations of stand dynamics above. Canopy destruction was patchy, with some plots losing over 30% of basal area. Disturbance intensity was greatest in areas with well-developed hard-pan and highest canopy diversity, generating gaps averaging about 800–1000 m2 (large enough to favor regeneration of less tolerant species). Mortality risk varied with species; shade-tolerant competitive dominants Fagus and Acer suffered much higher mortality than Betula (Woods 2004).
Research methods:
In 1935, U.S. Forest Service personnel established 246 0.2-acre (809 m2) continuous forest inventory (CFI) plots on a 2 × 5 chain (40.2 × 100.6 m) grid (2 chain spacing on north-south lines) over the entire RNA (Fig. 2). Plot centers were marked with steel pipes. Stems >5 in (12.7 cm) diameter at 1.4 m height (diameter at breast height, DBH) were tallied by species in 1-inch (2.54 cm) diameter classes for most plots (n = 236). In 1948, alternate plots along N-S lines were censused in the same manner (n = 123).
In 1974–1980, under the direction of Dr. Frederick Metzger of the U.S. Forest Service, all CFI plots were recensused, with all woody stems >0.5 in (1.27 cm) DBH recorded by species and DBH to nearest 0.1 inch using Biltmore 'cruising sticks' (Frederick Metzger, personal communication). Standing dead stems > 10 in (25.4 cm) DBH and with bark intact were also recorded, but probably not consistently (see below). Data for three plots have not been relocated (n = 243). Active Forest Service research at the RNA was suspended following closure of the Forest Service Northern Hardwoods Laboratory in Marquette, MI in the early 1980s. Some species, occurring primarily as large shrubs, may not have been consistently recorded (Acer spicatum, Alnus sp, Amelanchier sp, Cornus sp, Corylus cornuta).
Beginning in 1989 and continuing over the next several years, I initiated remeasurements, initially for upland plots only. For upland plots (n = 134), all woody stems > 5 cm DBH were measured to nearest 0.1 cm and mapped in polar coordinates from the plot center. Smaller stems were similarly mapped and measured in a central sub-plot 8 m in radius: in 1989 the minimum size for recording stems in the sub-plot was 3 cm; in 1992, minimum size was 2.5 cm; for all subsequent years all stems > 1 cm DBH were included. In 1989–1992, distances were measured using tapes and azimuth using Suunto site-through compasses; from 1993 onward, distances were measured using Sonin ultrasonic rangers. Subsequently, woody stems in upland plots have been remeasured and newly established stems mapped and measured at, generally, five-year intervals (three or four measurements for most); since 1999, these plots have been consolidated into two groups sampled at staggered intervals such that the most recent measurements are for 2004 and 2007. For some species of large shrubs (Acer spicatum, Corylus cornuta, Cornus rugosa) stems were tallied without mapping. All dead stems > ca. 20 cm (including down stems and stumps) were included in initial samples of upland plots. Dead stems were identified to species where possible, and rated on an 8-point decay scale (Table 1), and classed as standing, tipped up, or broken (with height of break recorded); DBH was measured or estimated for dead stems where possible (for decay codes of 7–9, diameter measurements were typically impossible). In subsequent remeasurements of upland plots, stems dying since previous measurements were similarly coded (generally using only the first two grades of the decay scale) where possible (dead smaller stems could not always be relocated); after initial plot measurements, DBH was not recorded for dead stems.
Since 1994, with major efforts beginning in 2001, I have remeasured a total of 65 additional plots in wetlands on peat and muck soils. As for upland plots, all stems > 5 cm DBH were measured for the entire plot and stems from 1–5 cm for an 8-m radius sub-plot, but stems were not mapped in these stands. Dead stems were not consistently recorded, and are not included here.
TABLE 1. Decay scale. "Comments" fields in data files for mapped CFI plots, 1989 and after, include for trees recorded as dead a three-part code with: a) decay-scale score (0–8); b) T, B, or no entry for tipped up, broken, or standing; c) height of break (m) for broken stems. The three sections of code are separated by hyphens, even when there is no entry for one section. Thus, "1-B-2" indicates a tree broken at 2 m and still retaining fine twigs, "2-T-" indicates at tip-up in slightly more advanced decay (loss of most small twigs), and "3--" indicates a dead tree still standing but with significant bark and branch loss.
Decay Scale |
Description |
0 |
died in current growing season; leaves remaining on tree (wilted or brown); may be still standing |
1 |
no leaves but nearly all terminal twigs remaining on tree (died within last 1–2 years); may be still standing |
2 |
small twigs lost or mostly lost; bark generally still intact; may be still standing |
3 |
small branches lost or mostly lost, significant bark loss; may be still standing |
4 |
few if any branches remaining, bark mostly gone, outer wood soft; sometimes still standing |
5 |
wood deeply rotted; rarely still standing |
6 |
bole rotted through, but still retaining cylindrical shape |
7 |
rotting log losing integrity; sagging or crumbling |
8 |
well-rotted stump; log, if visible, reduced to mound or ridge on forest floor |
Several ancillary data-sets have been collected in conjunction with those presented here. These include understory composition for several hundred square-meter sub-plots, hemispherical canopy photographs associated with understory quadrats, basic soil descriptions and analyses for a subset of upland plots, and about 200 increment cores. Researchers interested in using these data should contact the author.
Project personnel: Individuals involved in 1935 and 1948 measurements are not known. Measurements from 1974–1980 were under direction of Frederick Metzger; field-crew members are not known. Data from 1935, 1948, and most 1974–1980 measurements were entered in spreadsheets from original by U.S. Forest Service personnel under the oversight of Thomas Crow. The following individuals assisted in data collection in various years since 1989: Megan Adcock, Agnes Benoit, Morgan Bender-deMoll, Wesley Bernegger, Marc Bogonovich, Lauren Boisvert, Daniel Brese, Javier B. Brockmann, David Camphouse, Amanda Caron, Casey Cochran, Aurora Dawson, Jason Fridley, Jenny Grout, Catherine Hamilton, Amie Huff, Josie Lawlor, Daniel Levitis, Rebecca LoDolce, Karina Melanson, Nathalie Maroger, Jay Metz, Arielle Middleman, Avi Ragaven, Garth Silberstein, Jason Smith, Jennifer Smith, Dorothy Wallace-Senft, Elizabeth Ward, Lucas Westcott, Peregrine Whitehurst, and Katie Zingle.
CLASS III. DATA SET STATUS AND ACCESSIBILITY
A. Status
Latest update: April 2009 for all data files.
Latest Archive date: April 2009
Metadata status: Metadata are complete to last update and are stored with data.
Data verification: Data collected since 1989 have been checked by comparison of digital files with field data-sheets. For plots with multiple measurements since 1989, species identifications, unlikely values, and map coordinates have been checked in the field in subsequent measurements. Field data-sheets are available for some plots for the 1970s measurements, and these have permitted similar comparison checking. Data for earlier measurements were proofread by comparison with field sheets following entry into spreadsheets. All data were checked visually and by various internal comparisons by K. Woods; implausible values were flagged and either corrected through subsequent field measurement, adjusted if errors were obvious (e.g., decimal point confusions), or dropped from analyses.
B. Accessibility
Storage location and medium: All data are stored in digital form on author's personal computer and in multiple back-ups. Field-sheets for measurements from 1989 onward are in personal files of author. Field-sheets for earlier measurements are stored at the Rhinelander Lab of the Northern Forest Experiment Station, U.S. Forest Service.
Contact person: Kerry D. Woods, Natural Sciences, Bennington College, Bennington, VT 05201 USA; tel 802-440-4465; [email protected]
Copyright restrictions: None.
Proprietary restrictions: None for data through 2004; permission of author for more recent measurements.
Costs:None.
CLASS IV. DATA STRUCTURAL DESCRIPTORS
A. Data Set File
Identity:
all_plots_1935_1948.txt -- data for all stems measured in 1935 and 1948.
all_plots_1974-1980.txt -- data for all stems measured in 1974 through 1980.
upland_plots_89-07.txt -- data for upland plots mapped and measured two or more times, 1989 through 2007.
swamp_all_modern.txt -- data for wetland plots censused from 1992 through 2007.
species_codes.txt -- four-letter codes and full names for all species.
sampling_history.txt -- table summarizing sampling history for all plots.
Size:
all_plots_1935_1948.txt -- 8990 lines, not including header row
all_plots_1974-1980.txt -- 28987 lines, not including header row
upland_plots_89-07.txt -- 39601 lines, not including header row
swamp_all_modern.txt -- 10764 lines, not counting header row
species_codes.txt -- 32 lines, not including header row
sampling_history.txt -- 246 lines, not including header row
Comments:
Measurement errors: From 1989 onward, DBH was measured by diameter tape or calipers for smaller stems. Field crews were trained to measure at uniform height (1.4 m), and periodically checked for consistency between and within individual crew members through repeated measurement of the same trees. After training, differences among measurements were rarely more than 0.2 cm for trees < 25 cm DBH or more than 0.3 cm for larger trees. Errors in measurement may accrue through measurement at different heights (due to irregularities in tree-trunks or in ground surface around tree) or in failure to measure a diameter normal to the axis of the trunk (this is especially likely in larger trees or in leaning trees). The latter type of error can only produce over-measurements, so errors are likely to be slightly biased towards over-measurement.
Mapping errors: Errors in stem mapping were also subjectively assessed, after field-crew training, by comparing repeated measurements for the same trees. Measurement of angular coordinates (azimuth) included relatively frequent errors of up to 2–3º (due primarily to failure to allow compass to stabilize properly). Measurements of distance from plot center, after adoption of Sonin ultrasonic rangers, varied very little — almost never more than 0.2 m (due primarily to failure to place emitter or target precisely) except in rare cases where sight-lines were blocked and multiple measurements were required. Cumulatively, these errors would produce a maximum mapping error of about 1 m at the periphery of the plot, decreasing inwards. Larger mapping errors are likely to have been corrected during multiple remeasurements of mapped plots.
Identification errors: Species identification errors are unlikely in mapped plots from 1989 forward; multiple remeasurements allowed correction of occasional misidentifications. Most species in the study area are not easily confused, but there are some exceptions, and these may lead to some identification errors, particularly in earlier measurements and in post-1989 measurements of 'swamp' plots (with stem-mapping and remeasurement). Most likely confusions include: species of Picea; species of Fraxinus (especially F. pensylvanica and F. americana); and Acer saccharum and Acer rubrum (especially for largest trees). Identification of dead stems is more error-prone, particularly in distinguishing species of Acer.
Data file format: Note, particularly, that blank fields in data files are not missing data; in the case of data files for mapped plots, DBH fields are empty for particular trees if that individual was dead prior to the measurement year or grew into measurable size classes only after that measurement year. Fields indicating mortality are filled only for the first measurement year after tree death. Comment fields are filled only if comments were entered on field sheets for that measurement year. Actual MISSING DATA are always indicated by "NA".
all_plots_1935_1948.txt:
These data were obtained in digital form and so could not be checked against original field sheets. Data were entered as numbers of stems by size category; there were no implausible values. However, comparisons of size and species distributions at different sample dates suggest occasional confusions between Acer saccharum and A. rubrum. DBH measurements in 1935 through 1980 were made with 'Biltmore sticks' or forestry cruising sticks. No field assessments of measurement errors were reported, but this parallax-based method is subject to errors due to differences in how observers hold the stick; errors of up to 0.5 inch (1.25) cm are likely to be relatively common, but there is no reason to assume bias.
all_plots_1974-1980.txt:
These data were also obtained in digital form, but were entered as individual measurements. Errors in DBH measurement should be assumed as for previous file. A small number of implausible diameter values were judged to be decimal point errors or double-keystroke errors and corrected accordingly. One plot was clearly incompletely sampled (large stem numbers far smaller than bracketing sample years) and was dropped. Dead trees were not recorded for 42 plots measured in 1979; patterns suggest that recording of dead trees for other plots in the 1974–1980 period may have been inconsistent, particularly for smaller stems (dead stems were recorded only if DBH > 10 in). Confusion between Acer species and Fraxinus species is suggested by some plot-comparisons (1974–1980 samples were, at least in part, conducted in the winter, making some species distinctions more difficult). 1974 measurements were taken in late summer. All 1978 and 1979 measurements were taken in the winter of 1978-1979, while all 1980 measurements were taken in the first two months of that year, before the growing season.
upland_plots_89-07.txt:
Repeated measurement of mapped stems allows detection of large DBH and mapping errors (both in field measurement and data-entry) in these samples, and corrections have been incorporated where gross inconsistencies and obvious errors were detected; no attempt was made to adjust smaller measurement errors; consequently, slowly growing stems may have apparent negative growth values for individual 5-year measurement intervals (up to 4% of all stems, for some measurement intervals, show negative diameter changes, some as great as 1.0 cm; small negative values are frequent for small, suppressed individuals and larger negative values are almost exclusively for large canopy trees where tape measurements errors are more likely due to positioning of tape or irregularities in trunk). Presumably, five-year growth rates are overestimated by similar margins for similar proportions of stems. While errors in DBH measurement are positively biased (it is easier to measure a stem as larger than its true size), it is likely that measurement errors are similar over different measurement years, so that distribution of errors in growth rate (diameter change) shows little or no bias.
"Comment" fields include any notes made by workers in the field, including codes for state of dead trees as in Table 1 and indication of whether mortality or damage was related to the 2002 storm.
Large shrubby species (Acer spicatum and Alnus incana) are included in these measurements, but were not mapped in some instances; coordinate fields for those records = "NA". In these instances, the same individual may be recorded on separate lines (records) in different years. DBH fields may contain "NA" for living trees where trees are tipped-up and unmeasurable but still alive, or where measurement was impossible due to other fallen trees.
swamp_all_modern.txt:
For these plots, generally measured only once and without mapping, measurement and identification errors are more probable but difficult to assess.
Format and storage mode:ASCII text, tab delimited. No compression
Authentication procedures:
all_plots_1935_1948.txt: sum of stem counts ('count' column) = 14394, sum for DBH(in) column = 105333
all_plots_1974-1980.txt: sum for DBH(in) column = 132823.4, sum for DEAD column = 196
upland_plots_89-07.txt: values in STEM column are 1 through 13624, sum for DIST. column = 368255.2, sum for 'dead' column = 2430
swamp_all_modern.txt: sum for DBH column = 123191.3
species_codes.txt: The 12th SPCODE listed is "fagr" and corresponding SPECIES name is "Fagus grandifolia"; the 32nd (and final) code is "unkn", corresponding to "unknown (dead)"
sampling_history.txt: number of non-blank entries for 1935 = 226; for 1979 = 42; for 2004 = 54; for 2007 = 89
B. Variable definitions
all_plots_1935_1948.txt
Variable name |
Variable definition |
Units |
Storage type |
Range numeric values |
Missing value codes |
YEAR |
Year sample; here either 1935 or 1948 |
year |
Integer |
1935,1948 |
N/A |
PLOT |
Identifier for CFI plot (see Figure 1) |
numeric code |
Integer |
4481 to 5083 |
N/A |
SPCODE |
Four-letter code uniquely identifying species (see species_codes.txt) |
text |
string |
N/A |
N/A |
DBH(IN) |
Diameter at Breast Height category |
inch |
integer |
5 to 45 |
N/A |
COUNT |
Number stems in DBH category |
number |
integer |
1 to 21 |
N/A |
all_plots_1974-1980.txt
Variable name |
Variable definition |
Units |
Storage type |
Range numeric values |
Missing value codes |
PLOT |
Identifier for CFI plot (see Fig. 1) |
numeric code |
Integer |
4481 to 5083 |
N/A |
SPCODE |
Four-letter code uniquely identifying species (see species_codes.txt) |
text |
string |
N/A |
N/A |
DBH(in) |
Diameter at Breast Height to nearest 0.1 inch |
inch |
integer |
0.1 to 46.9 |
N/A |
DEAD |
= 0 for live trees; = 1 for dead trees. Dead trees recorded only if > 10 inches DBH, with bark intact |
Numeric code |
integer |
0 or 1 |
N/A |
YEAR |
Year sampled; here 1974, 1978, 1979, or 1980 |
year |
integer |
1974, 1978, 1979, 1980 |
N/A |
upland_plots_89-07.txt
Variable name |
Variable definition |
Units |
Storage type |
Range numeric values |
Missing value codes |
STEM |
Identifier assigned to each mapped stem. Mapped stems have same stem number across measurements. |
numeric code |
integer |
1 to 13624 |
N/A |
YEAR |
Year of measurement |
year |
integer |
1989,1992,1994,1997,1999,2001,2002,2004,2007 |
N/A |
PLOT |
Identifier for CFI plot (see Figure 1) |
numeric code |
integer |
4534 to 4880 |
N/A |
SPCODE |
Four-letter code identifying species (species_codes.txt) |
text |
string |
N/A |
N/A |
AZIM. |
Azimuth: angular polar coordinate in degrees E of magnetic N; not recorded for some large shrubs (= "NA"). |
degrees |
integer |
0 to 360 |
"NA" |
DIST. |
Distance: from plot center; not recorded for some large shrubs (= "NA"). |
m |
floating point |
0 to 16.0 |
"NA" |
DBH |
Diameter at Breast Height (see comments for minimum sizes and sub-plot dimensions); for dead stems, DBH = "NA", EXCEPT for year of first measurement of plot |
cm |
floating point |
1.0 to 104.5 |
"NA" |
dead |
0 = living stem; 1 = dead stem (recorded only for first plot measurement at which stem was dead) |
numeric code |
integer |
blank or 1 |
N/A |
Comments |
Descriptive comments recorded in measurement year. includes codes for condition of dead trees (Table 1); for 2002 through 2007, prefix "STRM" indicates mortality due to 2002 storm; "D" indicates significant storm damage. |
text |
string |
N/A |
N/A |
species_codes.txt
Variable name |
Variable definition |
Units |
Storage type |
Range numeric values |
Missing value codes |
SPCODE |
unique four-letter code for all species in data set |
text |
string |
N/A |
N/A |
SPECIES |
full name of species, from USDA Plants Database (http://plants.usda.gov/), |
text |
string |
N/A |
N/A |
swamp_all_modern.txt
Variable name |
Variable definition |
Units |
Storage type |
Range numeric values |
Missing value codes |
Year |
Year sampled |
Year |
Integer |
1993–2007 |
N/A |
Plot |
Identifier for CFI plot (see Fig. 1) |
Numeric code |
Integer |
4493 to 5080 |
N/A |
SPCODE |
Four-letter code uniquely identifying species (see species_codes.txt) |
text |
string |
N/A |
N/A |
DBH |
Diameter at Breast Height |
cm |
floating point |
1.0–120.7 |
N/A |
sampling_history.txt
Variable name |
Variable definition |
Units |
Storage type |
Range numeric values |
Missing value codes |
Plot |
Identifier for CFI plot (see Fig. 1) |
Numeric code |
Integer |
4481to 5083 |
N/A |
1935 |
"C1" indicates plot censused in 1935 for all stems > 5 in DBH |
text |
string |
N/A |
N/A |
1948 |
same as previous column for 1948 |
text |
string |
N/A |
N/A |
1974 |
"C2" indicates plot censused in 1974 for all stems > 0.6 in DBH |
text |
string |
N/A |
N/A |
1978 |
same as previous, for 1978 |
text |
string |
N/A |
N/A |
1979 |
same as previous, for 1979 |
text |
string |
N/A |
N/A |
1989 |
"M" indicates plot censused and stems mapped |
text |
string |
N/A |
N/A |
1992 |
same as previous, for 1992 |
text |
string |
N/A |
N/A |
1993 |
same as previous, for 1993; "C3" indicates plot |
text |
string |
N/A |
N/A |
1994 |
same as previous, for 1994 |
text |
string |
N/A |
N/A |
1997 |
same as previous, for 1997 |
text |
string |
N/A |
N/A |
2001 |
same as previous, for 2001 |
text |
string |
N/A |
N/A |
2002 |
same as previous, for 2002 |
text |
string |
N/A |
N/A |
2004 |
same as previous, for 2004 |
text |
string |
N/A |
N/A |
2007 |
same as previous, for 2007 |
text |
string |
N/A |
N/A |
CLASS V. SUPPLEMENTAL DESCRIPTORS
A. Data acquisition
Data forms: Data forms.
Location of completed data forms: Data forms from 1935, 1948 and 1974–1979/1980 measurements are held in U.S. Forest Service files at Northern Research Laboratory facilities in Rhinelander, WI. Data forms for 1989–2007, soil descriptions, reports from soil analyses, and field logs are held in the lab of Kerry Woods at Bennington College, Bennington, Vermont, USA.
B. Quality assurance/quality control procedures: Field sheets were proofed every day in the field and concerns addressed in next day's field work. Remeasurement of stems in repeated samples allowed further quality assurance (see above).
C. Related material: n/a.
D. Computer programs and data processing algorithms: n/a.
E. Archiving: n/a
F. Publications and results:
Analyses of these data have contributed to the following publications:
Woods, K. D. 2000. Long-term change and spatial pattern in a late-successional hemlock-northern hardwood forest. Journal of Ecology 88:267–282.
Woods, K. D. 2004. Intermediate disturbance in a late-successional hemlock-northern hardwood forest. Journal of Ecology 92:464–476.
Papaik, M. J., C. D. Canham, E. F. Latty, and K. D. Woods. 2005. Effects of an introduced pathogen on resistance to natural disturbance: beech bark disease and windthrow. Canadian Journal of Forest Research 35:1832–1843.
Woods, K. D. 2007. Predictability, contingency, and convergence in late succession: slow systems and complex data-sets. Journal of Vegetation Science 18:543–554.
G. History of data set usage: See F above.
H. Data set update history: Dates for all woody stem measurements on CFI plots are in sampling_history.txt with data files; the most recent field measurements, for ca. 80 plots, were in 2007. Data files were compiled in current form in 2009.
Review history: n/a
Questions and comments from secondary users: n/a
ACKNOWLEDGMENTS
All individuals assisting in field work are listed under 'personnel' above; this work has been completely dependent on the work and reliability of over 30 field assistants, most of whom were Bennington College undergrads. Fred Metzger made me aware of the existence of the Dukes CFI plot network and, with Tom Crow, made data from pre-1989 measurements available; both are with the U.S. Forest Service. Tom Crow arranged entry of earlier data-sets into digital formats. I have received funding support for this project from the U.S. Forest Service, the National Science Foundation, the Andrew W. Mellon Foundation, the Huron Mt. Wildlife Foundation, and Bennington College. A sabbatical fellowship at the National Center for Ecological Analysis and Synthesis supported the focused curatorial work, compilation, and documentation required to prepare this data paper.
LITERATURE CITED
Abrams, M. D., C. M. Ruffner, and T. E. DeMeo. 1998. Dendroecology and species co-existence in an old-growth Quercus–Acer–Tilia talus slope forest in the central Appalachians, USA. Forest Ecology and Management 106:9–18.
Arseneault, D., and L. Sirois. 2004. The millennial dynamics of a boreal forest stand from buried trees. Journal of Ecology 92:490–504.
Bakker, J. P., H. Olff, J. H. Willems, and M. Zobel. 1996. Why do we need permanent plots in the study of long-term vegetation dynamics? Journal of Vegetation Science 7:147–155.
Bakker, J. P., R. H. Marrs, and R. J. Pakeman. 2002. Long-term vegetation dynamics: Successional patterns and processes. Introduction. Applied Vegetation Science 5:2–6.
Bekker, R. M., E. van der Maarel, H. Bruelheide, and K. Woods. 2007. Long-term datasets: from descriptive to predictive data using ecoinformatics. Journal of Vegetation Science 18:458–462.
Busing, R. T., and D. Mailly. 2004. Advances in spatial, individual-based modelling of forest dynamics 15:831–842.
Calcote, R. 1995. Pollen Source Area and Pollen Productivity: Evidence from Forest Hollows. The Journal of Ecology 83:591–602.
Canham, C. D., and O. L. Loucks. 1984. Catastrophic windthrow in the presettlement forests of Wisconsin. Ecology 65:803–809.
Christensen, N. L., and R. K. Peet. 1984. Convergence during secondary forest succession. Journal of Ecology 72:25–36.
Cogbill, C. V., J. Burk, and G. Motzkin. 2002. The forests of presettlement New England, USA: spatial and compositional patterns based on town proprietor surveys. Journal of Biogeography 29:1279–1304.
Frelich, L. E., and C. G. Lorimer. 1991. Natural disturbance regimes in hemlock-hardwood forests of the upper Great Lakes region. Ecological Monographs 61:145–164.
Fulton, M. R., and P. A. Harcombe. 2002. Fine-scale predictability of forest community dynamics. Ecology 83:1204–1208.
Henry, J. D., and J.M.A. Swan. 1974. Reconstructing forest history from live and dead plant material -- an approach to the study of forest succession in southwest New Hampshire. Ecology 55:772–783.
Holmes, T. 2006. Four decades of change in an old-growth beech-maple forest in Indiana. M.S., University of Missouri - Columbia.
Jackson, M., and D. ABRELL. 1994. Versailles State Park revisited: twenty years of change in old-growth forests of Laughery Bluff and Dogwood Nature Preserves. Proceedings of the Indiana Academy of Science 98:401–413.
Jackson, S. T., and J. B. Kearsley. 1998. Quantitative representation of local forest composition in forest-floor pollen assemblages. Journal of Ecology 86:474–490.
Leps, J., and M. Rejmanek. 1991. Convergence or divergence: What should we expect from vegetation succession? Oikos 62:261–264.
Lin, Y., and C. Augspurger. 2006. A long-term study of neighbour-regulated demography during a decline in forest species diversity. Journal of Vegetation Science 17:93–102.
Pacala, S. W., C. D. Canham, and E. Ribbens. 1996. Forest models defined by field measurements: Estimation, error analysis and dynamics. Ecological Monographs 66:1–43.
Parker, G. R., and D. Leopold. 1985. Tree dynamics in an old-growth, deciduous forest. Forest Ecology and Management 11:31–57.
Parshall, T. 1999. Documenting forest stand invasion: fossil stomata and pollen in forest hollows. Can. J. Bot 77:1529–1538.
Peet, R. K. 1984. Twenty-six years of change in a Pinus strobus, Acer saccharum forest, Lake Itasca, Minnesota. Bulletin of the Torrey Botanical Club 111:61–68.
Pickett, S. T. A. 1989. Space-for-time substitution as an alternative to long-term studies. Pages 110–135 in G. E. Likens, editor. Long-term Studies in Ecology: Approaches and Alternatives. Springer, New York, NY USA.
Schwenner, C. 2007. Soil survey of Marquette County, Michigan. Page 1340 . Natural Resources Conservation Service, USDA.
Soil Survey Staff. 1999. Soil Taxonomy: A Basic System of Soil Classification for Making and Interpreting Soil Surveys.Second. U.S. Department of Agriculture, Natural Resources Conservation Service.
Spetich, M. A., and G. R. Parker. 1998. Distribution of biomass in an Indiana old-growth forest from 1926 to 1992. The American Midland Naturalist 139:90–107.
Whitney, G. G. 1984. Fifty years of change in the arboreal vegetation of Heart's Content, an old-growth hemlock-white-pine-northern hardwood stand. Ecology 65:403–408.
Woods, K. D. 2000a. Dynamics in late-successional hemlock-hardwood forests over three decades. Ecology 81:110–126.
Woods, K. D. 2000b. Long-term change and spatial pattern in a late-successional hemlock-northern hardwood forest. Journal of Ecology 88:267–282.
Woods, K. D. 2004. Intermediate disturbance in a late-successional hemlock-northern hardwood forest. Journal of Ecology 92:464–476.
Woods, K. D. 2007. Predictability, contingency, and convergence in late succession: Slow systems and complex data-sets. Journal of Vegetation Science 18:543–554.
Woods, K. D., and M. B. Davis. 1989. Paleoecology of range limits: Beech in the Upper Peninsula of Michigan. Ecology 70:681–696.
Zhang, Q., K. S. Pregitzer, and D. D. Reed. 1999. Catastrophic disturbance in the presettlement forests of the Upper Peninsula of Michigan. Canadian Journal of Forest Research 29:106–114.