Appendix A. Capture–mark–resighting models.
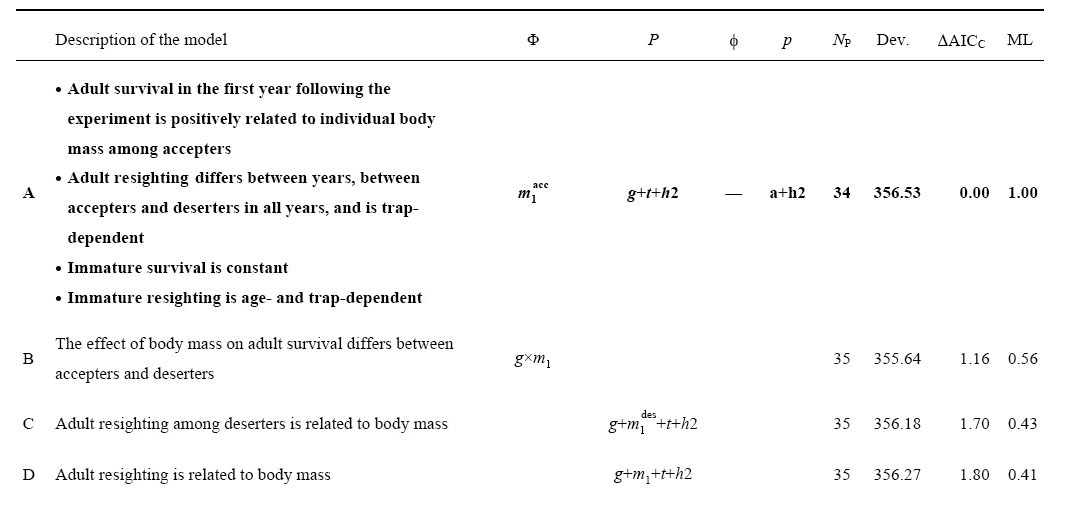
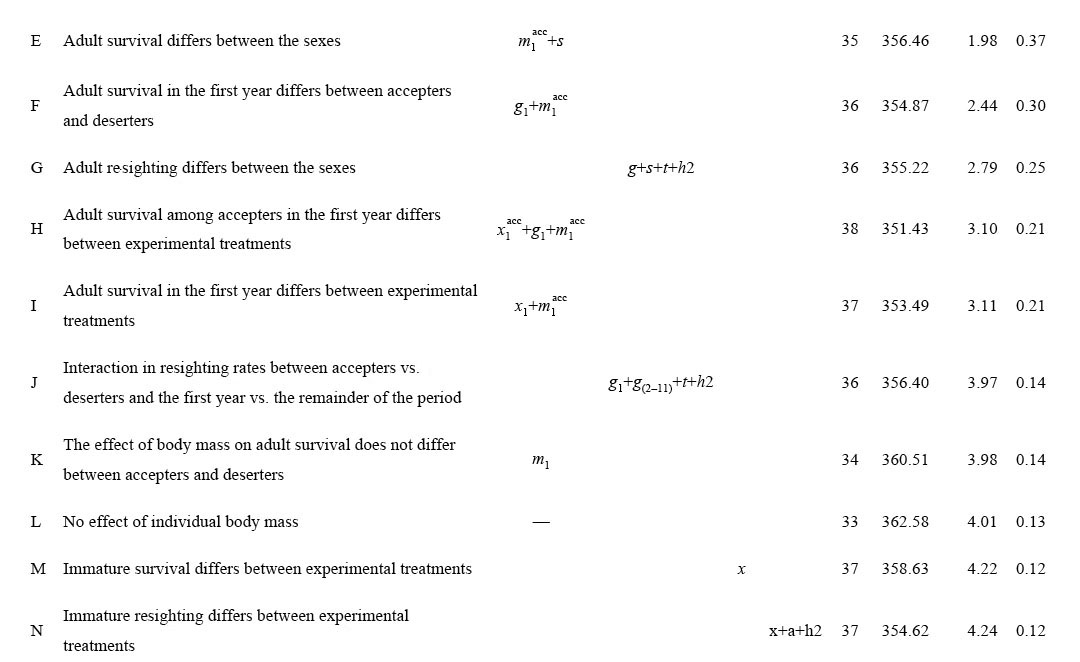
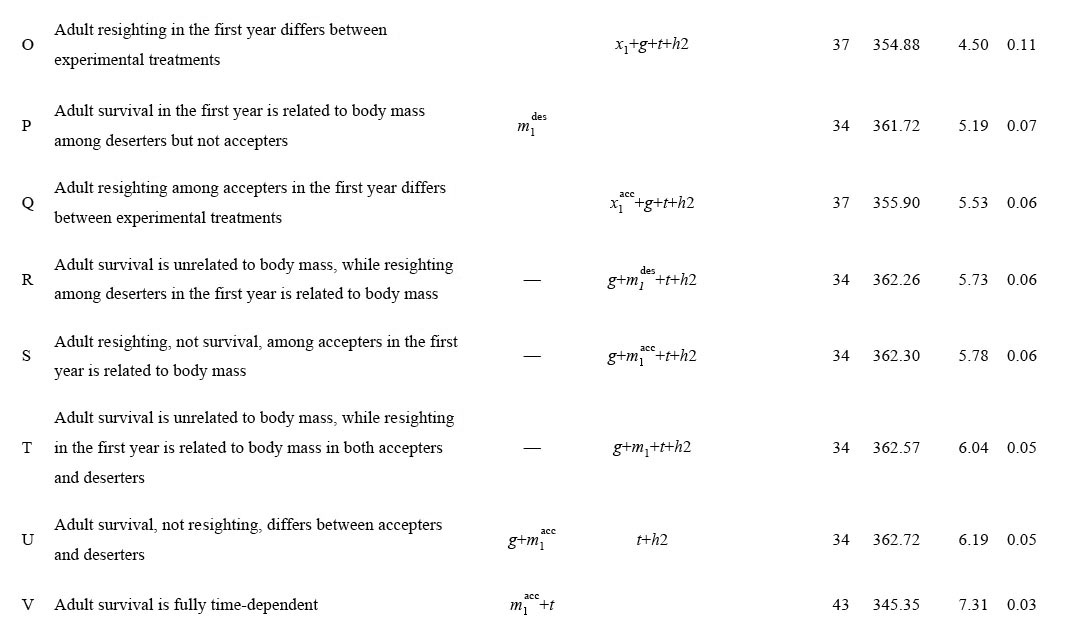
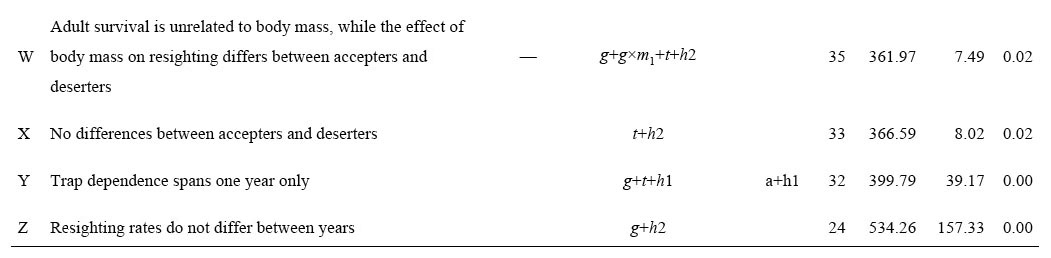
TABLE A1. Models of puffin adult survival eleven years after experimental manipulation.
|
|
|
|
|
|
|
|
Notes: The table compares the final model (model A, boldface) with its neighborhood. Models are sorted in order of ascending ΔAICC values. The columns give a description of the difference between each model and model A, followed by the model notations (only shown for the parts that deviate from model A) for adult survival (Φ), adult resighting (P), immature survival (φ), immature resighting (p), the number of parameters (NP), model deviance (Dev., twice the difference between the log-likelihoods of each model and the full model, i.e., {Φ(x*g*s*t) P(x*g*s*t+h2) φ(a*x) p(a*x+h2)}, where “*” symbolizes additive effects plus interactions), ΔAICC (difference between AICC of each model and model A) and model likelihood (evidence ratio). The AICC (weight) of model A was 7543.25 (0.153). Legend to abbreviations used: a, age; g, “response group”, i.e., “accepters” vs. “deserters”; hn, sighting heterogeneity extending for n years after the last sighting; m, body mass; s, sex; t, time effect, i.e., the number of years after the experiment; x, experimental treatments “shortened” vs. “control” vs. “prolonged”; —, no effect (constancy). Subscripts indicate that effects are constrained to certain years (e.g., m1, effect of body mass in the first year following the experiment). Superscripts indicate that effects are constrained to certain response groups (acc, accepters; des, deserters). Operators: +, additive effect; ×, interaction.