Ecological Archives E090-019-D1
Hervé Sinoquet, Sylvain Pincebourde, Boris Adam, Nicolas Donès, Jessada Phattaralerphong, Didier Combes, Stéphane Ploquin, Krissada Sangsing, Poonpipope Kasemsap, Sornprach Thanisawanyangkura, Géraldine Groussier-Bout, and Jérôme Casas. 2009. 3-D maps of tree canopy geometries at leaf scale. Ecology 90:283.
INTRODUCTION
Plant architecture has a strong impact on various ecologically relevant processes. The canopy architecture of plants determines directly light interception (e.g., Ackerly and Bazzaz 1995; Sinoquet et al. 2001). The close relationships between individual organ irradiance and plant architecture imposes a spatial-dependence on (i) leaf gas exchange (CO2 assimilation, water vapor loss), anatomy and nutrient content (e.g., Le Roux et al. 1999; Piel et al. 2002), (ii) plant growth and productivity (e.g., Evers et al. 2005), and (iii) the dynamics of populations (e.g., Schmid and Bazzaz 1994), for example in the context of competition for light (e.g., Tremmel and Bazzaz 1993; Sipe and Bazzaz 1994). In the last decade, tools, concepts, and models for the elaboration of 3-D plant representations have been extensively developed, improving our understanding of both the spatial distribution of plant biological processes and the relation between plant structure and function (Godin and Sinoquet 2005; Pearcy et al. 2005). Those studies indicated that describing canopy geometry down to leaf scale can be useful to accurately model and predict plant performance (e.g., Sinoquet et al. 2007). Such level of detail would also improve our ability to determine the impact of both climate variability (both intra- and interannual) and global change on plant performance and, more globally, energy fluxes in canopies. As of today, spatial geometry of plant canopies has never been considered explicitly in the context of climate change and its ecological impacts, except for Pincebourde et al. (2007).
Plant canopy architecture influences other organisms. Plants interact with their environment according to the 3-D distribution of plant organs, and modify their microclimate mainly through light interception, wind attenuation, and water vapor release (Nobel 1999; Godin and Sinoquet 2005). The canopy microclimate is highly heterogeneous and has a complex spatial and temporal structure (e.g., Sinoquet et al. 2001; Chelle 2005). Several studies showed that insects clearly exploit the microclimatic heterogeneity of their food-plant by moving from a location to another within a single plant during the day (e.g. Willmer 1986). Describing canopy architecture down to leaf scale is crucial to determine whether an insect resting on a leaf at a given location within canopy is exposed to solar radiation (Pincebourde et al. 2007). The metabolism associated to nutritional processes of phytophagous insects depends on leaf attributes, i.e., assimilation rate, transpiration, and surface temperature (van Loon et al. 2005), and is therefore also affected by canopy geometry. In particular, the paths taken by insects foraging for mates and food cannot be understood without reference to, and modeling of, the geometry of the environment in which they move (Casas and Aluja 1997; Casas and Djemai 2002). However, few studies have explicitly linked 3-D plant architecture and behavioral or physiological ecology of herbivores through the impacts of plant geometry and leaf physiology on fine-scale microenvironmental patterns relevant to the insects.
We have carried out several projects over the last decade, based on experiments using 3-D plant architecture models. The first one was to evaluate the effect of canopy structure on light interception properties of trees. Total light interception has been shown to be related to primary production in beech (Balandier et al. 2007) and to fruit yield in apple orchards (Wünsche et al. 1996). Moreover, light distribution within a canopy influences fruit quality, e.g., anthocianin content (Mabrouk and Sinoquet 1998). The second objective was to detail the impact of plant canopy geometry on the thermal ecology of an endophytic herbivore attacking apple leaves (Pincebourde and Casas 2006; Pincebourde et al. 2007). Apple leaf miners feed and develop at a fixed position, i.e. inside leaves within canopies. Their thermal budget and metabolism depends on both their position within the canopy and the architecture of this canopy, leading to a strongly heterogeneous risk of mortality under severe climatic conditions (e.g., heat wave events) and high variance of developmental time at canopy scale. The third objective was the development of concepts and methods (especially photo methods) using 3D plant models to estimate the pertinent canopy structure parameters at tree scale (Phattaralerphong and Sinoquet 2005; Phattaralerphong et al. 2006). Plant 3D architecture models made it possible to generate virtual plant images (2-D), where computer algorithms can be applied to re-generate 3-D structural attributes (e.g., crown volume and total leaf area). The comparison between structural attributes computed from the database obtained by digitizing the trees and inferred from the photo method was used as a way for testing the photo method accuracy (i.e., the deviation between inferred and measured structural parameters like total leaf area). The advantage was that several sources of uncertainty were removed (e.g., with regard to image processing, or field measurements of plant structure attributes).
All these three projects needed 3-D representations of the tree canopy, namely the spatial distribution of leaf attributes, i.e., leaf size and area, spatial co-ordinates and angular orientation. The data set reports this information for a set of six trees, i.e., one apple, two mangos, two rubbers, and one walnut. We offer an unprecedented compilation of several 3-D models of different plant architectures, to be used by both physiologists and ecologists, working at the organism or population levels, on any organism living in canopies, when studying organismal performance in heterogeneous environments. The data set can be implemented readily into any spatially explicit ecological and/or physiological model to reveal the impact of local heterogeneity (i.e., canopy scale) on organism and population performance. Thus, the data set is flexible as one can easily use the architecture and modify leaf size and/or density. Our hope is that these data will serve as a basis to mechanistic studies investigating the impact of climate on plant–organism interactions, which are urgently needed in the current context of global change.
METADATA
CLASS I. DATA SET DESCRIPTORS
A. Data set identity: Leaf-scale 3-D maps of tree canopy geometries
B. Data set identification code: We provide six separate data sets, one for each tree: Apple_Tree.txt; Mango_Tree1.txt; Mango_Tree2.txt; Rubber_Tree1.txt; Rubber_Tree2.txt; Walnut_Tree.txt
C. Data set description
Principal Investigator(s):
Hervé Sinoquet
UMR547 PIAF, INRA, Université Blaise Pascal, 63100 Clermont Ferrand,
France
Deceased 14 September 2008
Sylvain Pincebourde, corresponding author
Institut de Recherche sur la Biologie de l’Insecte, Université François Rabelais,
Faculté des Sciences et Techniques, 37200 Tours, France
E-mail: [email protected]
Boris Adam
UMR547 PIAF, INRA, Université Blaise Pascal, 63100 Clermont Ferrand, France
Nicolas Donès
UMR547 PIAF, INRA, Université Blaise Pascal, 63100 Clermont Ferrand, France
Jessada Phattaralerphong
UMR547 PIAF, INRA, Université Blaise Pascal, 63100 Clermont Ferrand,
France, and
Faculty of Botany, Kasetsart University, 50 Paholyothin Road, Chatuchak, Bangkok. 10900. Thailand and
Faculty of Natural Resources and Agro-Industry, Kasetsart University Chalermphrakiat Sakonnakhon
Province Campus, 59 Moo1 Sakonnakhon-Nakhonphranom Rd., Moung District, Sakonnakhon
Province, 47000, Thailand
Didier Combes
UR4 Unité d'Ecophysiologie des Plantes Fourragères, INRA, BP
6, 86600 Lusignan, France
Stéphane Ploquin
UMR547 PIAF, INRA, Université Blaise Pascal, 63100 Clermont Ferrand,
France
Krissada Sangsing
Surat Thani Rubber Research Center, Office of Agricultural Research and development Region 7, Department of Agriculture, Thailand
Poonpipope Kasemsap
Faculty of Horticulture, Kasetsart University, 50 Paholyothin Road, Chatuchak, Bangkok. 10900. Thailand
Sornprach Thanisawanyangkura
Faculty of Botany, Kasetsart University, 50 Paholyothin Road, Chatuchak, Bangkok. 10900. Thailand
Géraldine Groussier-Bout
Institut de Recherche sur la Biologie de l’Insecte, Université François Rabelais,
Faculté des Sciences et Techniques, 37200 Tours, France
Jérôme Casas
Institut de Recherche sur la Biologie de l’Insecte, Université François Rabelais,
Faculté des Sciences et Techniques, 37200 Tours, France
Abstract
The geometrical structure of plant canopies has many implications for plant functioning, microclimatic conditions, and
plant-pathogen/herbivore interactions. Plant geometry can be described at several scales. At the finest scale, canopy structure includes the shape, size, location, and orientation of each organ in the canopy. This data set reports the three-dimensional (3-D) geometry of a set of fruit and rubber trees at the leaf scale. A 3-D magnetic digitizer was used to measure the spatial coordinates and the orientation angles of each leaf, namely, the midrib azimuth and inclination angles, and the rolling angle of leaf lamina around the midrib. In addition, for most trees, branching or flush order is given as well as the ranking of leaves along branches and the leaf identity of leaflets in compound-leaved trees. Leaf length was also measured for most trees. Leaf width was measured or estimated based on allometric relationships. Leaf area was derived from allometric relationships with leaf length and width. The data set includes the 3-D geometry of six trees: one apple, two mangos, two rubbers, and one walnut. Plant height ranged from 1.6 m for mango trees to 5.3 m for the large rubber tree. The number of leaves ranged from 895 for the small rubber tree to 26,283 for the apple tree. Total leaf area ranged from 3.6 m2 for the small rubber tree to 36.4 m2 for the apple tree. Most of the data were used to show how canopy geometry determines light interception and subsequently plant primary production and fruit yield. The data set was also used to test the quality of innovative methods for canopy structure description at tree scale. The apple tree was used to study the thermal environment of a leaf miner insect, to show how canopy geometry leads to a strongly heterogeneous risk of mortality, in particular under heat-wave conditions. Overall, our data set provides explicit plant architectures suitable for spatial modeling of plant physiological ecology and plant–herbivore interactions, allowing us to determine the mechanisms through which climate impacts biological and ecological processes involved in these functions.
D. Key words: Key words: canopy geometry; fruit tree; leaf area; leaf coordinates; leaf orientation; light interception; microclimate; plant architecture; rubber tree; 3-D digitizing.
CLASS II. RESEARCH ORIGIN DESCRIPTORS
A. Overall project description
Identity: Light interception by trees and environmental biophysics of endophytic herbivores.
Originator:Hervé Sinoquet and Jérôme Casas.
Period of Study: 1998–continuing.
Objectives:To understand the effect of canopy structure on light interception by trees and partitioning between tree components; To understand how the herbivore feeding activity impacts the animal’s thermal environment and performance from leaf to canopy scale; To test simplified methods to describe the canopy structure of trees.
The aim of the project is:
- Light interception: (i) to identify canopy structure parameters which influence light interception by isolated trees; (ii) to relate local leaf irradiance to the spatial distribution of leaf physiological properties in the tree crown.
- Spatial distribution of herbivores’ performance within canopies: (i) to analyze the physiological interaction between an endophytic insect (leaf miner) and its host plant, (ii) to quantify the effects of plant tissue modifications on the thermal environment of the herbivore at leaf scale, (iii) to model the insect thermal environment at plant canopy scale to estimate the differences in developmental times within a tree canopy.
- Test of simplified methods for canopy structure description: (i) to test a photo method for estimating crown volume and total leaf area; (ii) to test foliage reconstruction methods from a subsample of 3-D digitized leaves.
Sources of funding: This project corresponds to a set of doctoral positions funded by the French Ministry of Scientific Research and the French Embassy in Thailand. Additional funding was obtained from INRA and from the ACI Ecologie quantitative ‘Ecologie physique des organismes’.
B. Specific subproject description
Site description:Globally, the trees described below were selected mainly for their potential to show a pronounced radiative and thermal gradient through the canopy. This gradient can result from interception of radiation by outer foliage layers, for example. This characteristic was important given our initial objectives to capture significant level of spatial heterogeneity at canopy scale. Accessibility of a tree was also an important criterion as deploying and using the digitizer requires free space all around the tree canopy.
Apple tree: The 20-year-old apple tree (Malus communis) was located in a private property in Vouvray, near Tours, France (47.37° N, 0.67°E). The tree was located in an open area, with two neighboring apple trees. There was no contact between the canopies of each tree. The alignment of the three trees was East-West orientated. The tree canopy was approximately 4.8 m in height, and 4.1 m and 4.9 m in the East-West and North-South directions, respectively (Table 1). The tree was measured in summer 2004. This apple tree is representative of an apple tree in a typical agricultural landscape.
Mango trees: The two two-year-old mango trees (Mangifera indica cv. Nam Dok Mai) were grown in an orchard in Ban Bung, near Chonburi, Thailand (13.17°N 101.25°E). Tree spacing was 5 × 5 meters with a North-South row orientation. At the time of digitizing (i.e., November 1997), trees were markedly isolated with a distance of about 3 meters between tree crowns. The size of both trees was similar and representative of the orchard, with height and diameter about 1.6–1.7 m (Table 1).
Rubber trees: Both trees (Hevea brasiliensis) were grown as isolated trees. The smaller 1.5-year-old tree (clone ‘RRIT251’) was grown in the garden of Department of Agronomy, Kasetsart University, Bangkok, Thailand (13.85°N, 100.75°E). The bigger one (clone ‘RRIM600’) was three-year old, and grown in Suwan Wajokkasikit Field Crops Research Station, Pak Chong,Thailand (14.7°N, 101.24°E). Tree height and diameter were 3.9 and 1.4 m, and 5.3 and 3.9 m, for the smaller and bigger tree, respectively (Table 1).
Walnut tree: The three-year-old walnut tree (Juglans intermedia NG38xRA) was grown in a research field at INRA Research Center in Clermont-Ferrand, France (45.78° N, 3.08° E). Tree spacing was 7 and 10 m on the line and between rows, respectively, with East-West row orientation. Tree height and diameter were 3.9 and 1.4 m, respectively (Table 1). The walnut tree was selected for its accessibility and for its representativeness of the trees present in the field in terms of general shape.
Experimental or sampling design: Leaf location and orientation were measured using an electromagnetic 3D digitizer (Fastrak, Polhemus Inc., Colchester, VT, USA). For all trees but the apple, all leaves or leaflets in case of compound leaves (i.e., the walnut and rubber trees) were digitized. In case of the apple tree, about eighty percent of the tree canopy was digitized at leaf scale. The remainder of the tree (about 20%), which was not digitized, corresponded to the portion of the tree (North-oriented) which never receives radiation. It did not shade the other plant portions. This portion can however be modeled as a homogeneous matrix of leaves by users if in need to have a complete 3-D plant model. For all trees, the area of each leaf was estimated from allometric relationships obtained from leaves sampled within the canopy.
Research methods:
Material: the 3-D digitizer is described in Sinoquet et al. (1998). Briefly, the device consists of a pointer which measures both location and orientation of a leaf within an electromagnetic field created by an emitter positioned below the tree. In the field, the error in location is about 1 cm and results from plant movements generated by wind and operator placement. Digitizing was completed under calm conditions (i.e., low wind conditions). Though we acknowledge that our data can be applied only under calm conditions, capturing the geometry of a plant under windy conditions is currently virtually not feasible. Spatial coordinates (3-D: x, y and z) and orientation of each leaf were obtained from a single record. Orientation consisted of the three Euler’s angles: azimuth angle (rotation around axis z), inclination angle (rotation around axis y) and rolling angle (rotation around axis x) (Sinoquet et al. 1998). For each leaf or leaflet, the digitized point was the junction between petiole and lamina. The pointer was held parallel to the leaf blade, and the pointer axis was parallel to the leaf midrib as proposed by Sinoquet et al. (1998). Orientation angles given by the digitizer were therefore the midrib azimuth, the midrib elevation and lamina rolling around the midrib.
Field/laboratory: the space referential was fixed on the ground at the beginning of the experiment. By convention, the X, Y, and Z axis were North, East, and vertical downwards oriented, respectively. Two persons were necessary for the digitization process, the first one handing the pointer within the tree and the second one observing and controlling for the data-capture process on the computer screen. Strict rules were applied to avoid digitizing several times a same leaf (or leaflet): we measured each main branch successively, and we followed all branches (first and secondary branches etc.) from the proximal to distal tip of each branch. For most tree specimens (see details below), we therefore know precisely the rank order of leaves along each last-order branch (from bottom of a last-order branch to the apex). In the case of mango trees, branching architecture is not available but these trees were digitized according to their flushes. Mangoes can have two or three growing periods per year and the leaves resulting from each of these periods are assigned to their respective flush. In the case of compound-leaved species (rubber trees and walnut), the data set give information on affiliation of leaflets to leaves.
For all trees, leaf or leaflet length (i.e., lamina length, excluding petiole) was measured with a ruler. For mango and walnut trees, maximum leaf width was also measured. In apple and rubber trees (i.e., when leaf width was not measured for all tree leaves), an allometric relationship was established between maximum leaf width (W, cm) and leaf length (L, cm) measured with a ruler on a sample of 50 – 100 leaves. W was correlated to L, with a scaling coefficient in the range 0.408 – 0.437 (Table 1). The relationship was used to estimate maximum leaf width of all digitized leaves.
For all trees, allometric relationships between leaf area (A, cm²) and the product L*W were established on a set of 50–100 freshly sampled leaves. Leaf area was measured with a Licor 3100 area meter (Licor Inc., Lincoln, Nebraska, USA). For all trees, leaf area was strongly correlated (R² > 0.98, P < 0.001) to the product L*W, with a slope in the range 0.613 – 0.735 (Table 1). The relationships were used to estimate the leaf area of all leaves in the trees. For the apple tree, leaf length was measured with a ruler at the same time as digitizing for leaves in the first measured branch, i.e., 5,015 leaves. We verified that leaf length was not correlated to location on any of the three axes. Then, for the other branches, leaf length was generated following this method: first, the mean leaf length found previously (mean + SD = 5.45 + 2.06 cm) was assigned to each leaf and it was then allowed to vary within the variance we measured previously and according to the normal distribution of leaf length we measured. Therefore, leaf length was weighted by the actual distribution of measured leaves.
Project personnel (for each subproject):
- Light interception: Hervé Sinoquet, Boris Adam, Nicolas Donès, Jessada Phattaralerphong, Didier Combes, Krissada Sangsing, Poonpipope Kasemsap, Sornprach Thanisawanyangkura.
- Spatial distribution of herbivores’ performance within canopies: Sylvain Pincebourde, Jérôme Casas, Hervé Sinoquet, Géraldine Groussier-Bout.
- Test of simplified methods for canopy structure description: Hervé Sinoquet, Boris Adam, Nicolas Donès, Jessada Phattaralerphong.
CLASS III. DATA SET STATUS AND ACCESSIBILITY
A. Status
Latest update:
21 September 2008.
Latest Archive date: N/A.
Metadata status: 22 January 2008, metadata is current.
Data verification:
Data has undergone substantial data quality and assurnace checking.
B. Accessibility
Storage location and medium: Original data file exists on authors’ personal computers (S. Pincebourde, B. Adam, N. Donès and J. Casas) in tabular Excel format.
Contact persons: Sylvain Pincebourde, Institut de Recherche sur la Biologie de l’Insecte, UMR6035, CNRS, Université François Rabelais, Faculté des Sciences et Techniques, 37200 Tours, France. E-mail: [email protected]
Nicolas Donès, UMR547 PIAF, INRA, Université Blaise Pascal, Site de Crouelle, 234 avenue du Brézet, 63100 Clermont Ferrand, France.
E-mail: [email protected]
Boris Adam, UMR547 PIAF, INRA, Université Blaise Pascal, Site de Crouelle, 234 avenue du Brézet, 63100 Clermont Ferrand, France.
E-mail: [email protected]
Jérôme Casas, Institut de Recherche sur la Biologie de l’Insecte, UMR6035, CNRS, Université François Rabelais, Faculté des Sciences et Techniques, 37200 Tours, France.
E-mail: [email protected]
Copyright restrictions: None.
Proprietary restrictions: None.
Costs: None, data are free for scientific or scholar use.
CLASS IV. DATA STRUCTURAL DESCRIPTORS
A. Data Set File
Identity: Apple_Tree.txt; Mango_Tree1.txt; Mango_Tree2.txt; Rubber_Tree1.txt; Rubber_Tree2.txt; Walnut_Tree.txt
Size:The number of rows (including header row), and columns are given for each file:
Apple: 26,255 rows and 17 columns;
Mango1: 1,637 rows and 11 columns;
Mango2: 2,460 rows and 11 columns;
Rubber1: 896 rows and 10 columns;
Rubber2: 12,142 rows and 14 columns;
Walnut: 1,559 rows and 12 columns.
Format and storage mode: ASCII text, tab delimited. No compression schemes were used.
Header information:The first 10 columns are similar for all data sets and their header is (from left to right; unit is given in brackets): Entity#, Length (cm), Width (cm), Area (cm²), TransX (cm), TransY (cm), TransZ (cm), RotX (degrees), RotY (degrees) and RotZ (degrees). Definitions of variables are given below in section B ‘variable definitions’. More information is given for all trees but Rubber1. The amount of additional information available differs from tree to tree as they were digitized for different research purposes. Therefore, the eleventh column and the followings are specific to each data set:
- Apple: First, Second, Third, Fourth, Fifth, Sixth and Leaf_Pos.
- Mango1: Flush#.
- Mango2: Flush#.
- Rubber2: First, Second, Third and Leaf_Pos.
- Walnut: First and Leaf_Pos.
Alphanumeric attributes: Mixed.
Special characters/fields: There are no missing values. The absence of a ranking for a given branch-order implies that this order does not exist for the given branch (i.e., the last order of the branch corresponds to the last rank number given).
Authentication procedures:
The sums for the first 10 numeric columns are given below for each file:
|
Tree (data set file) |
Factor |
Apple |
Mango1 |
Mango2 |
Rubber1 |
Rubber2 |
Walnut |
Entity# |
26,254 |
1,636 |
2,459 |
895* |
12,141* |
1,558* |
Length |
142,932.7 |
24,952.5 |
33,452.6 |
10,660 |
115,373.7 |
18,066 |
Width |
93,370.8 |
6,400.3 |
9,217.6 |
4,383 |
47,018.3 |
8,113.7 |
Area |
363,729 |
64,752 |
82,740.3 |
36,112.5 |
339,012 |
73,541 |
TransX |
-6,069,719.7 |
7.4 |
6.5 |
-556.8 |
104,386.6 |
3,433.2 |
TransY |
-3,019,216.7 |
-2.1 |
-3.1 |
-12,114.7 |
2,089.3 |
1,392.9 |
TransZ |
-6,174,121.9 |
-203,355.8 |
-289,347.5 |
-289,141.8 |
-4,350,188.3 |
-220,026.2 |
RotX |
176,615 |
-7,114.2 |
-13,304.9 |
-1,789.2 |
-10,587.4 |
-1,684 |
RotY |
13,102.9 |
-41,629.8 |
-60,826.3 |
-14,325.4 |
-195,321.6 |
-30,972.3 |
RotZ |
4,698,661.3 |
290,404.7 |
451,725.7 |
150,856.7 |
1,959,293.8 |
276,212.5 |
The asterisk (*) denotes that the basic entity is not the leaf but the leaflet.
The sums for the additional numeric factors (eleventh column and after) are given in the following table for each file:
|
Tree (data set file) |
Factor |
Apple |
Mango1 |
Mango2 |
Rubber1 |
Rubber2 |
Walnut |
First |
426,975 |
N/A |
N/A |
N/A |
21,751 |
6,033 |
Second |
206,360 |
N/A |
N/A |
N/A |
47,226 |
N/A |
Third |
160,120 |
N/A |
N/A |
N/A |
21,880 |
N/A |
Fourth |
51,810 |
N/A |
N/A |
N/A |
N/A |
N/A |
Fifth |
7,932 |
N/A |
N/A |
N/A |
N/A |
N/A |
Sixth |
282 |
N/A |
N/A |
N/A |
N/A |
N/A |
Leaf_Pos |
331,377 |
N/A |
N/A |
N/A |
624,113* |
18,450* |
Flush# |
N/A |
4,205 |
4,451 |
N/A |
N/A |
N/A |
N/A signifies that the given factor is not available for the given tree.
*In case of compound-leaved trees, the ranking of the leaves identifies leaflets which belong to a same leaf (i.e., leaflets have the same leaf ranking).
B. Variable definitions
The table below gives the definition of the variables that are common to all data sets (i.e., corresponding to the first 10 columns). The range of numeric values is given by merging all data sets.
| Variable name |
Variable definition |
Units |
Storage type |
Range |
Entity# |
Identification number of the leaves or leaflets; The last number gives the total number of leaves or leaflets |
N/A |
Floating point |
1 to 26,254 |
Length |
Length of a leaf, taken along the leaf midrib |
Centimeters |
Floating point |
0.8 to 29.8 |
Width |
Maximal leaf width, taken in the middle of the limb |
Centimeters |
Floating point |
0.7 to 10.1 |
Area |
Estimated area of a leaf |
Square centimeters |
Floating point |
0.9 to 160.4 |
TransX |
Leaf co-ordinate along the axis X (translation from axis X) |
Centimeters |
Floating point |
-446 to 197.8 |
TransY |
Leaf co-ordinate along the axis Y (translation from axis Y) |
Centimeters |
Floating point |
-333.9 to 157.6 |
TransZ |
Leaf co-ordinate along the axis Z (translation from axis Z) |
Centimeters |
Floating point |
-531.7 to –33.4 |
RotX |
Rolling angle of Euler. It corresponds to the twist angle of the lamina from the midrib |
Degrees |
Floating point |
-180.0 to 180.0 |
RotY |
Inclination angle of Euler. It corresponds to the inclination of the midrib |
Degrees |
Floating point |
-89.1 to 88.5 |
RotZ |
Azimuth of the leaf midrib. |
Degrees |
Floating point |
0.0 to 360.0 |
The table below describes the additional variables given in the data set. The range of numeric values is given by merging all data sets in which a factor appears.
Variable name |
Variable definition |
Units |
Storage type |
Range |
First |
Number of the first order branch to which a leaf belong to |
N/A |
Floating point |
1 to 32 |
Second |
Number of the second order branch to which a leaf belong to |
N/A |
Floating point |
1 to 38 |
Third |
Number of the third order branch to which a leaf belong to |
N/A |
Floating point |
1 to 33 |
Fourth |
Number of the fourth order branch to which a leaf belong to |
N/A |
Floating point |
1 to 26 |
Fifth |
Number of the fifth order branch to which a leaf belong to |
N/A |
Floating point |
1 to 15 |
Sixth |
Number of the sixth order branch to which a leaf belong to |
N/A |
Floating point |
1 to 4 |
Leaf_Pos |
Position of the leaf along the last order branch from the departure to the apex of the branch |
N/A |
Floating point |
1 to 229 |
Flush# |
Flush number from younger (#1) to older (#6) flush |
N/A |
Floating point |
1 to 6 |
C. Data set references
N/A
CLASS V. SUPPLEMENTAL DESCRIPTORS
A. Data acquisition
Data forms: N/A.
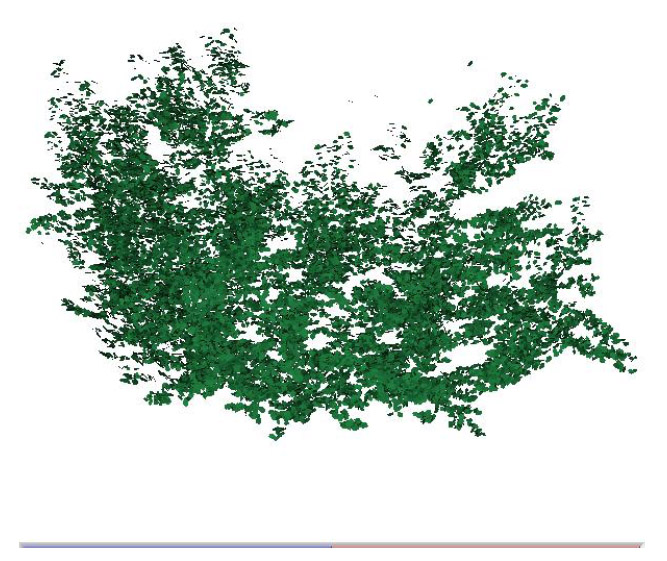
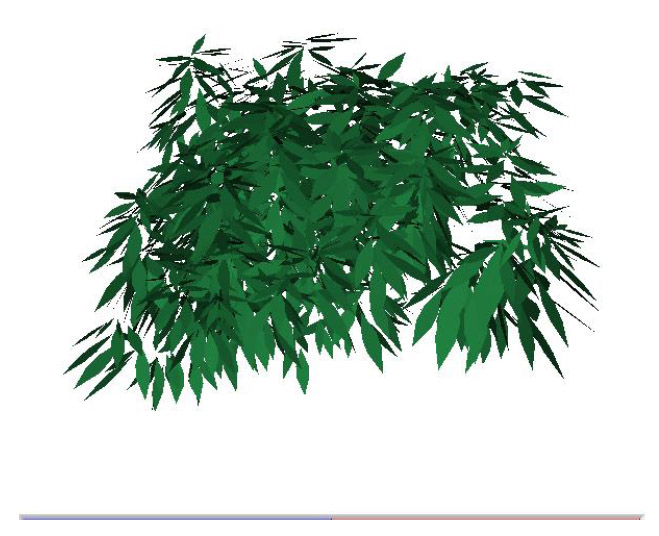
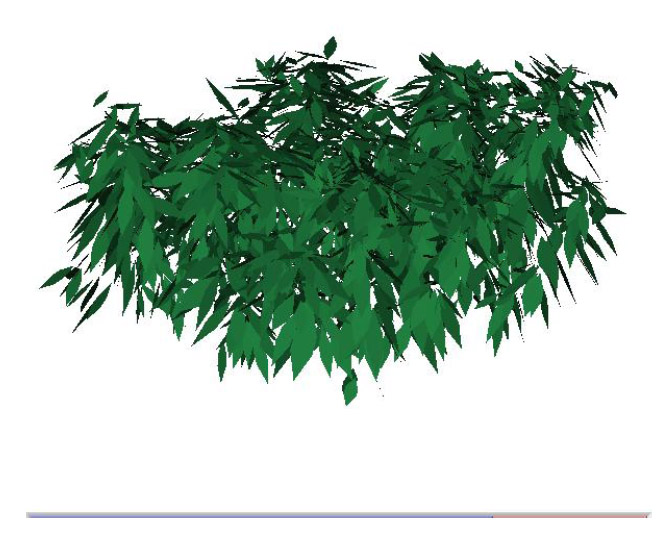
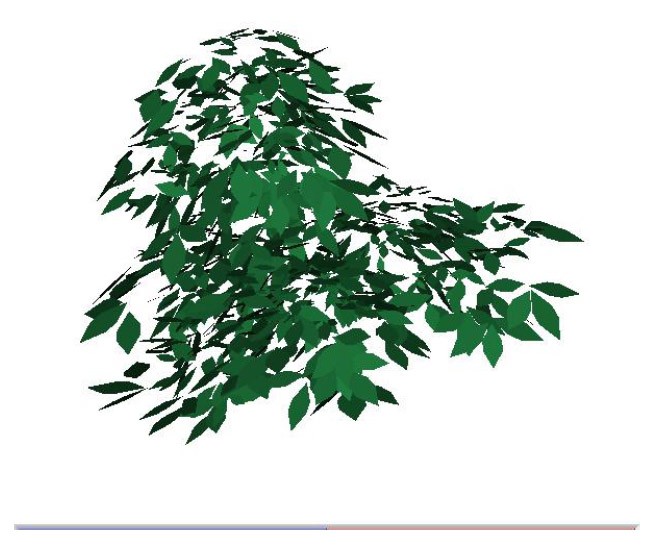
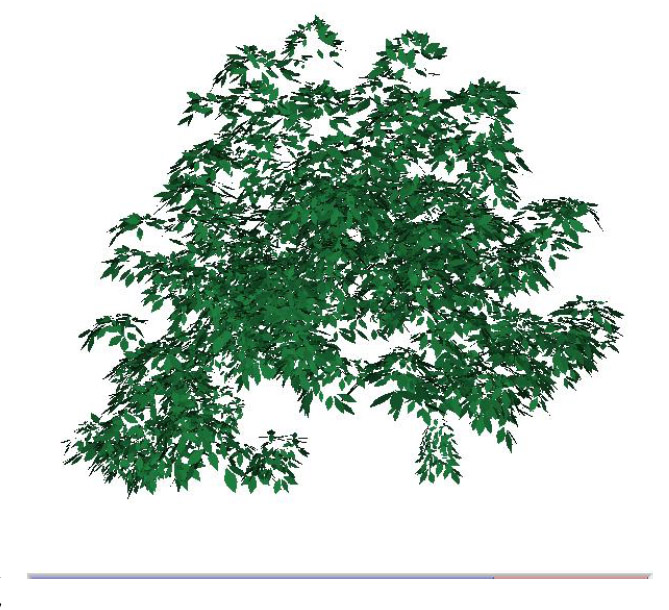
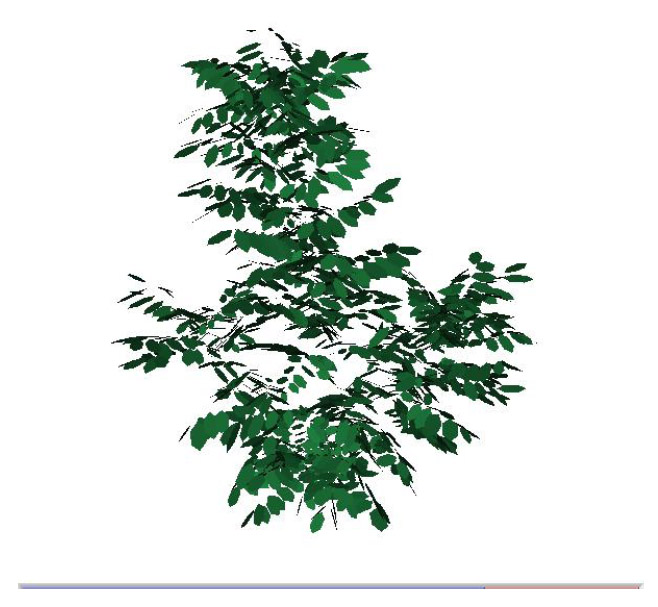
B. Quality assurance/quality control procedures: Quality of the data set was controlled during three steps. First, several benchmarks, consisting in white paint spots, were made on the trunk of the trees. Their spatial coordinates were measured each day at the beginning of a digitalization session to ensure that the data capture is well functioning (i.e., benchmarks should have the same coordinates every day). Second, coordinates of each digitized leaf were verified for their coherence with reality by the second experimenter on the computer screen at the time of measurement. This verification allowed detecting and correcting for aberration points. Finally, the 3-D canopy representations were elaborated using the VegeSTAR3 software program (Adam et al. 2002). These representations were compared visually to photographs of the actual tree to check that the general shape of the tree is respected. A 3-D representation of the trees is given in Fig. 1.
C. Related material.
D. Computer programs and data processing algorithms.
E. Archiving
F. Publications and results:
All six data sets have been used in previously published studies. Below are the references of these articles (the name of the corresponding dataset(s) is indicated in square brackets):
Giuliani, R., E. Magnanini, F. Nerozzi, E. Muzzi and H. Sinoquet. 2005. Probabilistic canopy reconstruction simulated from Monte Carlo point-intercept leaf sampling. Agricultural and Forest Meteorology 128:17–32. [Walnut_Tree].
Phattaralerphong, J. and H. Sinoquet. 2005. A method for 3D reconstruction of tree crown volume from photographs: assessment with 3D-digitized plants. Tree Physiology 25:1229–1242. [Mango_Tree2; Walnut_Tree].
Phattaralerphong, J., J. Sathornkich and H. Sinoquet. 2006. A photographic gap fraction method for estimating leaf area of isolated trees: assessment with 3D digitized plants. Tree Physiology 26:1123–1136. [Mango_Tree2; Rubber_Tree1; Rubber_Tree2; Walnut_Tree].
Pincebourde, S., H. Sinoquet, D. Combes and J. Casas. 2007. Regional climate modulates the canopy mosaic of favourable and risky microclimates for insects. Journal of Animal Ecology 76:424–438. [Apple_Tree].
Sinoquet, H., J. Phattaralerphong, P. Kasemsap and S. Thanisawanyangkura. 2004. Light and carbon acquisition partitioning between flushes of two-year-old mango trees. In: Proc. 4th workshop on Functional-Structural Plant Models (FSPM04), Montpellier, 7-11 June 2004, p. 146–149. [Mango_Tree1; Mango_Tree2].
Sinoquet, H., G. Sonohat, J. Phattaralerphong and C. Godin. 2005. Foliage randomness and light interception in 3D digitised trees: an analysis from multiscale discretisation of the canopy. Plant Cell and Environment 28:1158–1170. [Mango_Tree1; Mango_Tree2; Walnut_Tree].
All data sets will be used in several other forthcoming publications.
G. History of data set usage
Data request history: To present, the dataset has been used solely by the authors themselves.
ACKNOWLEDGMENTS
This Data Paper stands in the memory of Hervé Sinoquet who left us on September 14th, 2008. We are grateful to Jean Guern and Dominique Lidoreau, the owners of the apple tree; Jean-Luc Regnard and Evelyne Costes for lending the 3-D digitizer for the apple tree.
LITERATURE CITED
Ackerly, D. D., and F. A. Bazzaz. 1995. Seedling crown orientation and interception of diffuse radiation in tropical forest gaps. Ecology 4:1134–1146.
Adam, B., N. Donès, and H. Sinoquet. 2002. VegeSTAR version 3.0: calcul de l’interception lumineuse et de la photosynthèse. UMR PIAF, INRA-UBP, Clermont-Ferrand, Internal Report.
Balandier, P., H. Sinoquet, E. Frak, R. Giuliani, M. Vandame, S. Descamps, L. Coll, B. Adam, B. Prevosto, and T. Curt. 2007. Six-year time course of light-use efficiency, carbon gain and growth of beech saplings (Fagus sylvatica) planted under a Scots pine (Pinus sylvestris) shelterwood. Tree Physiology 27:1073–1082.
Casas, J., and I. Djemai. 2002. Canopy architecture and multitrophic interactions. Pages 174–196 in T. Tscharntke and B. A. Hawkins, editors. Multitrophic Interactions, Cambridge University Press, Cambridge, UK.
Casas, J., and M. Aluja. 1997. The geometry of search movements of insects in plant canopies. Behavioral Ecology 8:37–45.
Chelle, M. 2005. Phylloclimate or the climate perceived by individual plant organs: What is it? How to model it? What for? New Phytologist 166:781–790.
Evers, J. B., J. Vos, C. Fournier, B. Andrieu, M. Chelle, and P. C. Struik. 2005. Towards a generic architectural model of tillering in Gramineae, as exemplified by spring wheat (Triticum aestivum). New Phytologist 166:801–812.
Godin, C., and H. Sinoquet. 2005. Functional-structural plant modeling. New Phytologist 166:705–708.
Le Roux, X., S. Grand, E. Dreyer, and F. A. Daudet. 1999. Parameterization and testing of a biochemically based photosynthesis model for walnut (Juglans regia) trees and seedlings. Tree Physiology 19:481–492.
Loon, J. J. A. v., J. Casas, and S. Pincebourde. 2005. Nutritional ecology of insect plant-interactions: persistent handicaps and the need for innovative approaches. Oikos 108:194–201.
Mabrouk, H., and H. Sinoquet. 1998. Indices of light microclimate and canopy structure of grapevines determined by 3D digitizing and image analysis, and their relationships to grape quality. Australian Journal of Grape and Wine Research, 4:2–13.
Nobel, P. S. 1999. Physicochemical and environmental plant physiology. Academic Press, New York, New York, USA.
Pearcy, R. W., H. Muraoka, and F. Valladares. 2005. Crown architecture in sun and shade environments: assessing function and trade-offs with a three-dimensional simulation model. New Phytologist 166:791–800.
Phattaralerphong, J., J. Sathornkich, and H. Sinoquet. 2006. A photographic gap fraction method for estimating leaf area of isolated trees: assessment with 3D digitized plants. Tree Physiology 26:1123–1136.
Phattaralerphong, J., and H. Sinoquet. 2005. A method for 3D reconstruction of tree crown volume from photographs: assessment with 3D-digitized plants. Tree Physiology 25:1229–1242.
Piel, C., E. Frak, X. Le Roux, and B. Genty. 2002. Effect of local irradiance on CO2 transfer conductance of mesophyll in walnut. Journal of Experimental Botany 53:2423–2430.
Pincebourde, S., and J. Casas. 2006. Multitrophic biophysical budgets: thermal ecology of an intimate herbivore insect-plant interaction. Ecological Monographs 76:175–194.
Pincebourde, S., H. Sinoquet, D. Combes, and J. Casas. 2007. Regional climate modulates the canopy mosaic of favourable and risky microclimates for insects. Journal of Animal Ecology 76:424–438.
Schmid, B., and F. A. Bazzaz. 1994. Crown construction, leaf dynamics, and carbon gain in two perennials with contrasting architecture. Ecological Monographs 2:177–203.
Sinoquet, H., X. Le Roux, B. Adam, T. Ameglio, and F. A. Daudet. 2001. RATP: a model for simulating the spatial distribution of radiation absorption, transpiration and photosynthesis within canopies: application to an isolated tree crown. Plant, Cell and Environment 24:395–406.
Sinoquet, H., J. Stephan, G. Sonohat, P. E. Lauri, and Ph. Monney. 2007. Simple equations to estimate light interception by isolated trees from canopy structure features: assessment with three-dimensional digitized apple trees. New Phytologist 175:94–106.
Sinoquet, H., S. Thanisawanyangkura, H. Mabrouk, and P. Kasemsap. 1998. Characterization of the light environment in canopies using 3D digitizing and image processing. Annals of Botany 82:203–212.
Sipe, T. W., and F. A. Bazzaz. 1994. Gap partitioning among maples (Acer) in central New England: shoot architecture and photosynthesis. Ecology 8:2318–2332.
Tremmel, D. C., and F. A. Bazzaz. 1993. How neighbor canopy architecture affects target plant performance. Ecology 7:2114–2124.
Willmer, P. 1986. Microclimatic effects on insects at the plant surface. Pages 65–80 in B. E. Juniper, and T.R.E. Southwood, editors. Insects at the plant surface, Edward Arnold, Oxford, UK.
Wünsche, J. N., A. N. Lakso, T. L. Robinson, F. Lenz, and S. S. Denning. 1996. The bases of productivity in apple production systems: the role of light interception by different shoot types. Journal of the American Society of Horticultural Science 121:886–893.
TABLE 1. Characteristics of the 3-D digitized trees. Digitizing scale (element type): leaf or leaflet; Number of digitized elements; Total leaf area (TLA, m2); Tree height (m); Crown diameter (m) along the North-South (X) and East-West (Y) directions; Mean crown diameter (m); Measured attributes on all elements (L, leaf length, W, maximum leaf width); Slope of the allometric relationship between leaf area and the product L*W; Slope of the allometric relationship between maximum leaf width and leaf length.
|
Tree |
Apple |
Mango1 |
Mango2 |
Rubber1 |
Rubber2 |
Walnut |
|
Element type |
Leaf |
Leaf |
Leaf |
Leaflet |
Leaflet |
Leaflet |
Number |
26283 |
1636 |
2459 |
895 |
12141 |
1558 |
TLA (m²) |
36.40 |
6.48 |
8.27 |
3.61 |
33.91 |
7.35 |
|
Height (m) |
4.1 |
1.7 |
1.6 |
3.9 |
5.3 |
2.8 |
Diam N-S (m) |
5.3 |
1.7 |
1.8 |
1.5 |
4.0 |
1.9 |
Diam E-W (m) |
4.9 |
1.5 |
1.5 |
1.3 |
3.8 |
1.5 |
Mean diameter (m) |
5.1 |
1.6 |
1.7 |
1.4 |
3.9 |
1.7 |
|
Measured attributes |
L |
L and W |
L and W |
L |
L |
L and W |
Slope A-LW |
0.689 |
0.620 |
0.620 |
0.613 |
0.626 |
0.735 |
Slope W-L |
0.408 |
--- |
--- |
0.437 |
0.408 |
--- |
|
[Back to E090-019]