Alain Paquette, Etienne Laliberté, André Bouchard, Sylvie de Blois, Pierre Legendre, and Jacques Brisson. 2007. Lac Croche understory vegetation data set (1998–2006). Ecology 88:3209.
INTRODUCTION
The importance of, and the difficulties involved in carrying long-term vegetation data collections have been recognized for the study of forest community dynamics in response to natural or artificial perturbation, invasion from non-indigenous plants or pathogens, land use, or climate change (Irland et al. 2006, Lovett et al. 2007). For example, the Long-Term Ecological Research network (LTER) has shown how important these studies are and how they can be combined to reveal dynamics taking place at greater scales (Kartz et al. 2003, Hobbie et al. 2003).
In community ecology, the study of spatial patterns and scale has gained much interest in the last two decades. Temporal patterns of community dynamics have also been studied in a range of ecosystems (e.g., Ysebaert and Herman 2003, Wright et al. 2005) but are faced with the difficulties associated with carrying long-term, repeated sampling in permanent plots (Symstad et al. 2003, Barker Plotkin and Foster 2006). Spatio-temporal investigations are essential to understand and predict community responses to natural or human-induced perturbations such as fire, windthrow or logging (Mabry and Korsgren 1998, Motzkin et al. 1999, Harmon and Lauenroth 2003). Because gathering data to answer such questions often involves time frames longer than the average duration of a research grant or even of a researcher’s career, making such data available to the scientific community is important.
The Lac Croche vegetation data set includes detailed understory plant inventories carried out every year within the same permanent plots. These data were obtained at the Station de biologie des Laurentides (SBL) of Université de Montréal (Québec, Canada), where northern temperate forest is the dominant vegetation type. The data set was gathered in the context of an ongoing upper undergraduate field course in plant ecology to study changes in community composition along an environmental gradient. Repeated measurements over the years in permanent plots have resulted in a highly valuable data set that monitors the spatio-temporal dynamics of the understory. It has recently been used to test hypotheses on the relative influences ofdeterministic and stochastic processes on tree seedling patterns at different scales (Laliberté et al., submitted).
The Lac Croche data set now covers a nine-year period during which vegetation was sampled in 43 permanent 400-m2 plots. Tree seedlings, herbs and shrubs where sampled every year from 1998 to 2006 (with some exceptions). The data set also includes stable environmental variables such as slope, rockiness, key soil variables, as well as the basal area of mature trees. It should prove useful for testing statistical methods developed for the analysis of the spatio-temporal variation of plant distributions, as well as community dynamics following climate change and land use outside the SBL boundaries (logging, residential and recreational development). Since the SBL is under protection, it can also serve as a reference site from the Laurentides region which is under increasing pressure for development. The Lac Croche data set is an ongoing project and new data will be added every year. This project allows a number of students to be involved annually in a long-term research effort and so serves academic purposes as well.
METADATA CLASS I. DATA SET DESCRIPTORS
A. Data set identity:
Title: Lac Croche understory vegetation data set (1998–2006): Station de biologie des Laurentides (SBL), Université de Montréal (Québec, Canada)
B. Data set identification code
Suggested Data Set Identity Code: Croche_[data type]
C. Data set description
Principal Investigator: Alain Paquette’s current address is Centre d'étude de la Forêt (CEF), Université du Québec à Montréal, C.P. 8888, succursale Centre-ville, Montréal, QC, Canada H3C 3P8. E-mail: [email protected]
Abstract: The Lac Croche data set covers a nine-year period (1998–2006) of detailed understory vegetation sampling of a temperate North American forest located in the Station de Biologie des Laurentides (SBL), Québec, Canada. After having been submitted to logging in the late 19th and early 20th centuries followed by a major fire in 1923, the forest is currently in a transition state dominated by pioneer canopy tree species. The sampling design is based on the annual re-sampling of 43 permanent 400-m2 plots along five transects running parallel to an elevation gradient from a lake (Lac Croche) to the top of a hill. Abundances of all understory vascular plants (tree seedlings, herbs, and shrubs) are included in the data set and are expressed either as absolute densities or cover classes, depending on life form. The location and elevation of each plot, as well as some key environmenatl descriptors such as slope, rockiness, canopy openness, age of the largest tree, basal area of mature trees, and a number of soil variables are also available. The Lac Croche data set should prove useful for testing hypotheses about forest vegetation dynamics at different sacles, as well as to test new statistical tools developed for the analysis of the spatio-temporal variation of plant distributions. Sampling is ongoing, and new data will be added every year.
D. Key words: community patterns ; forest succession; spatial variation; Station de Biologie des Laurentides (SBL); temperate forest; temporal variation; understory plants; vegetation dynamics.
CLASS II. RESEARCH ORIGIN DESCRIPTORS
A. Overall project description
Identity: Spatial and temporal vegetation variation of the temperate forest of Lac Croche, Station de Biologie des Laurentides, Québec, Canada
Originators:
André Bouchard and Jean-Pierre Simon, professors
Sylvie de Blois and Alain Paquette, teachers
Université de Montréal
Actual supervisor (2006–)
Jacques Brisson, professor
Université de Montréal
Period of study: 1998–2006 included; project is ongoing.
Transects and plots were established in 1998. The data set covers a nine-year period, from 1998 to 2006. Vegetation data from 2002 could not be retrieved and therefore were not included. The course is ongoing and the sampling will be repeated every year.
Objectives, course summary
BIO3753, Stage d'écologie végétale (field course in plant ecology) is part of the curriculum in ecology within the B.Sc. Biology program at Université de Montréal. The course is given each year in mid-August at SBL and lasts ten days. The main objective is to learn and apply vegetation sampling methods, with strong emphasis on forest ecosystems. Students are taught the relevant theories and field methods in plant ecology, including multivariate statistical methods. The course culminates with the inventory and analysis of the Lac Croche vegetation transects.
Source of funding
Université de Montréal
Département de sciences biologiques
C.P. 6128, succursale Centre-ville, Montréal, QC, Canada, H3C 3J7
Site description
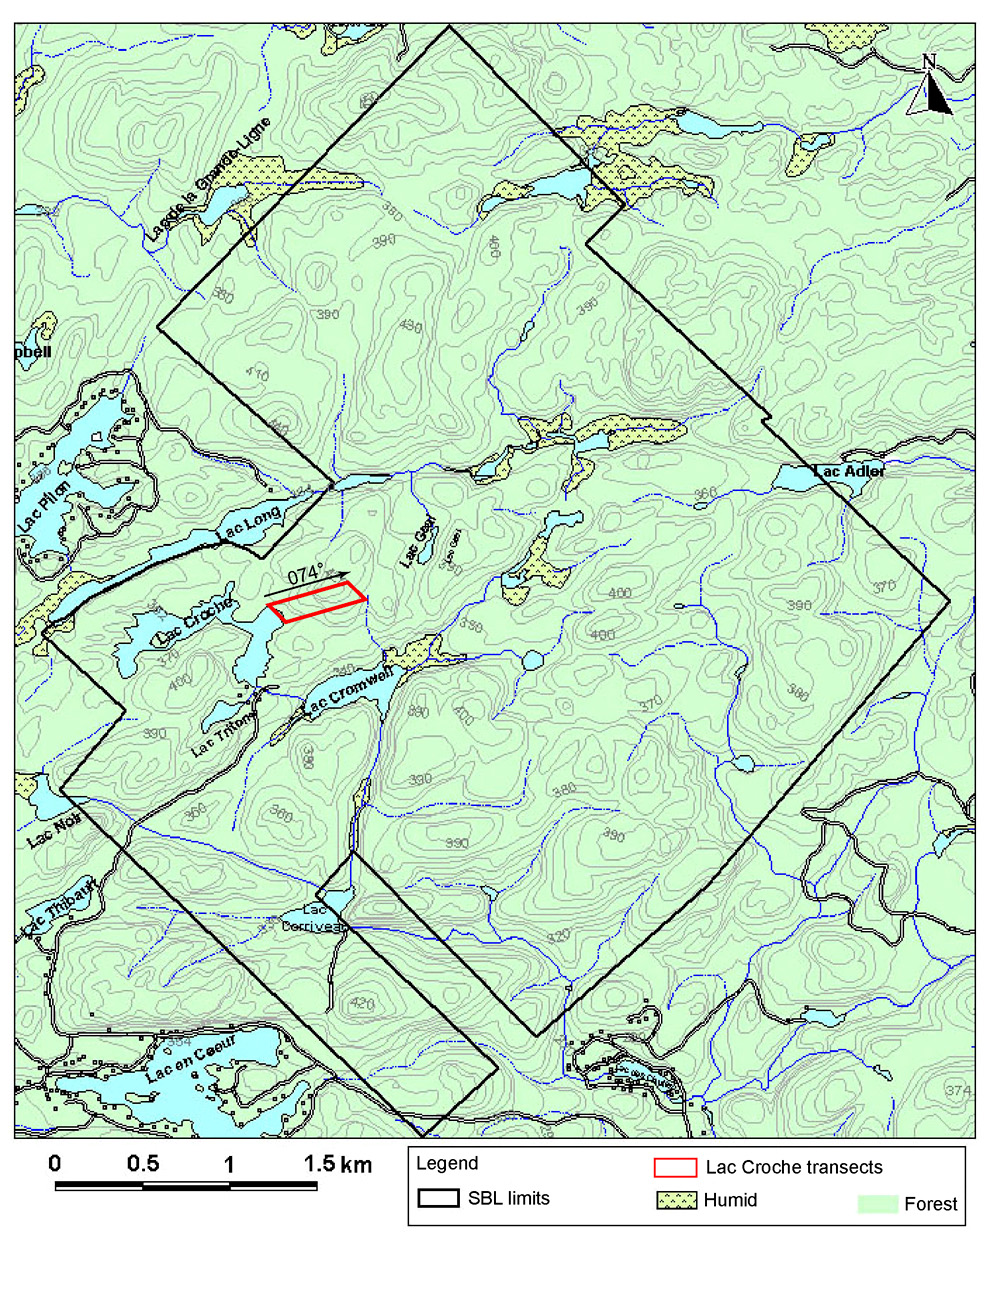
The study site is located within the SBL (Fig. 1), which is located north of Montréal in St-Hippolyte, Québec, Canada. The SBL was acquired in 1963 by the Département des Sciences biologiques (Université de Montréal) as a long-term research facility. Located at the foot of the Laurentides geological formation (part of the Canadian Shield), it is part of the sugar maple - yellow birch ecological region. The territory is mostly forested with several lakes and bogs typical of the region. The SBL (46°58’ – 46°01’N, 73°57’ - 74°01’W) covers 16.5 km2 of mountainous, irregular ground with much evidence of the Wisconsinian glaciation (e.g., erratic boulders). Bedrock is primarily composed of anorthosite. Altitude varies from 270m to 450m. Mean annual temperature is 3.9°C and annual precipitations average 1153 mm, of which 26% falls as snow (1970-2000 averages; SIMAT 2000). While the climax forest type on mesic sites in the region is typically Acer saccharum - Betula alleghaniensis forest, a large number of mesic sites are currently in transition states that are dominated by A. rubrum and pioneer tree species such as B. papyrifera and Populus grandidentata (Savage 2001). This is likely due to perturbations such as logging episodes early in the 19th and 20th century, as well as a fire which occurred in 1923 (Lortie 1979). Conifers are dominant on hydric and xeric sites. On August 1st 2006, a windstorm with 100 km/h winds created gaps in the canopy where patches of large pioneer species were still present.
Sampling design
The data were collected during a plant ecology field course (BIO3753) given each summer in mid-August by the Département de sciences biologiques, Université de Montréal. Five permanent transects were established in 1998 at the north-eastern tip of Lac Croche (Fig. 1). Transects are separated by about 50 m. The transects, which run more or less parallel to each other at an azimuth of 074º, start at the edge of the lake and follow an elevation gradient uphill. Along the transects, 43 permanent plots were established (1998) approximately every 50 m. Their location is marked by permanent steel rods in their center. Plots are 20 × 20 m (400 m2). Sampling of the Lac Croche transects takes approximately three days to complete; the dates given in the data set is that of the first sampling day each year.
Within each plot, the cover of herbaceous and shrub species was assessed every year usinga modified Braun-Blanquet (1932)semi-quantitative cover scale (Table 1) (Barbour et al. 1999). Tree seedlings (DBH < 1 cm) were also inventoried within two classes according to height (smaller or taller than 30 cm) (Table 2), using ten 1 m x 1 m sub-plots that were established every 2 m along the center of each plot, following the transect axis. Within each sub-plot, all tree seedlings were counted and identified to species. Data from those ten sub-plots were then pooled and multiplied by 40 to give an estimate of tree seedling abundance over the whole 400 m2 plot. In 1998, 2000 and 2001, the two classes of seedlings were joined. Tree seedlings were not inventoried in 1999.
A number of abiotic and biotic environmental variables were also evaluated. In 2005, all mature trees (DBH > 10 cm) were identified to species and their diameter at breast height (DBH) measured. The total basal area (BA) per species was then calculated for each plot. A pedon was dug just outside each plot (in order not to disturb the area for subsequent years). From this pedon, the following edaphic variables were evaluated: thickness of the organic (O) horizon, thickness of horizon A, presence of eluviation (E horizon) (Soil Survey Division Staff 1993), and maximum root depth. Pedons were as deep as necessary to collect all variables. Slope was measured using a clinometer (PM-5 model, Suunto, Vantaa, Finland), and slope orientation was measured using a compass. Slope shape was judged on a qualitative scale (concave, convex, or regular). Surface rockiness (including exposed bedrock) was evaluated on the modified Braun-Blanquet cover scale (Table 1). Canopy openness was measured with Gap Light Analyzer (Frazer et al. 2000), from hemispherical photographs of the canopy taken in the middle of each plot at one meter above ground. Geographic coordinates, as well as elevation, were measured with a differential GPS receiver (Trimble Navigation Ltd., Sunnyvale, CA, USA) with estimated 2-m accuracy.
Table 1. Modified Braun-Blanquet cover classes used in this study.
Class |
Cover |
1 |
< 1% |
2 |
1 - 5% |
3 |
5 - 15% |
4 |
15 - 25% |
5 |
25 - 50% |
6 |
50 - 75% |
7 |
> 75% |
Table 2. Size classes used for tree seedlings and corresponding codes.
Code |
Type |
Size class |
1 |
Seedlings (DBH < 1 cm) |
Height < 30 cm |
2 |
Seedlings (DBH < 1 cm) |
Height ≥ 30 cm |
0 |
Seedlings (DBH < 1 cm) |
All |
CLASS III. DATA SET STATUS AND ACCESSIBILITY
A. Status
Latest update: August 2006
Metadata status: Metadata are complete for this period and are stored with the data.
Data verification
Teachers and assistants (one for every six students) are always present during data collection on the Lac Croche transects. Special attention is given to assist the students in evaluating the cover of shrubs and herbs over the whole 400 m2 plot. A list of the species present is first made by walking the surface and identifying every species encountered. The plot is divided into four 10 m by 10 m quadrats using tapes and flags to help visualize and sample the whole surface. Cover is then estimated using classes (Table 1), ensuring uniformity between observers at the cost of some loss of precision (Barbour et al. 1999).
Data entry on automated worksheets is also supervised by teaching staff. A variety of methods are used afterwards to check the data, for example min-max and lists of species to detect outliers and entry mistakes. Possible errors are investigated using data from the previous years or by returning to the plot. Finally, the data is analysed first by the teaching staff using a variety of multivariate methods (mainly ordinations and cluster analysis). The data are then given to the students to complete their own analyses and final report.
For the purpose of the data-paper, some plants for which identification to the species was difficult or impossible in late August were grouped together (e.g., Viola sp.) (Table 3). Since some environmental descriptors were evaluated several times over the years, we used in general the most recent entry for that particular variable (details below).
B. Accessibility
Storage location and medium: Data and metadata are updated annually and stored on computer hard drives at the SBL, as well as at the plant ecology laboratory of Institut de recherche en biologie végétale (IRBV).
Contact person at the SBL: Éric Valiquette, Station de biologie des Laurentides, Université de Montréal, Département de sciences biologiques, C.P. 6128, succursale Centre-ville, Montréal, QC, H3C 3J7 Canada. Phone: (450) 563-3111, Fax (450) 563-4642. Email: [email protected]
Copyright and proprietary restrictions: None. The authors believe scientific data should be freely accessible for scientific use.
CLASS IV. DATA STRUCTURAL DESCRIPTORS
A. Data set files
Identity and size (number of records per file):
Vegetation cover: Croche_VegCover.txt ; 7660
Seedling density: Croche_SeedDens.txt ; 1447
Environmental descriptors: Croche_Env.txt ; 557
Basal area of mature trees: Croche_BA.txt ; 205
See "sampling design" above for further details.
Format and Storage mode: ASCII text, tab delimited. No compression.
Header information: More details on how some variables were measured are given in section B below. Column order in data tables ascends (left to right).
Vegetation sampling file Croche_VegCover.txt is arranged as follows:
Attribute |
Definition |
Units |
Data type |
Attribute type |
Range (-999 not incl.) |
Transect |
A |
Character |
Enumerated |
A-E |
|
Plot |
xx |
Character |
Enumerated |
00 - 10 |
|
SampleDate |
First day of sampling |
yyyymmdd |
Integer |
Range |
19980825 - 20060815 |
Year |
yyyy |
Integer |
Range |
1998 - 2006 |
|
Species |
Species codes (Table 3) |
AAAA |
Character |
Taxonomic |
|
Cover |
Species cover (Table 1) |
x |
Integer |
Enumerated |
1-7 |
Seedling density file Croche_SeedDens.txt is arranged as follows:
Attribute |
Definition |
Units |
Data type |
Attribute type |
Range (-999 not incl.) |
Transect |
A |
Character |
Enumerated |
A-E |
|
Plot |
xx |
Character |
Enumerated |
00 - 10 |
|
SampleDate |
First day of sampling |
yyyymmdd |
Integer |
Range |
19980825 - 20060815 |
Year |
yyyy |
Integer |
Range |
1998 - 2006 |
|
Species |
Species codes (Table 3) |
AAAA |
Character |
Taxonomic |
|
SizeClass |
Size code (Table 2) |
x |
Integer |
Enumerated |
0-2 |
Density |
Species density |
n/ha |
Floating |
Range |
40 - 19120 |
Environmental descriptor files Croche_Env.txt is arranged as follows:
Attribute |
Definition |
Units |
Data type |
Attribute type |
Range (-999 not incl.) |
|
Transect |
A |
Character |
Enumerated |
A-E |
||
Plot |
xx |
Character |
Enumerated |
01 - 10 |
||
SampleDate |
First day of sampling |
yyyymmdd |
Integer |
Range |
19980825 - 20060815 |
|
Year |
yyyy |
Integer |
Range |
1998 - 2006 |
||
Parameter |
See the following list of parameters |
|||||
Lat |
Latitude at the center of the plot |
deg |
Floating |
Range |
45.991 - 45.995 |
|
Long |
Longitude at the center of the plot |
deg |
Floating |
Range |
-73.998 - -74.004 |
|
Elev |
Elevation above sea level (m) |
m |
Floating |
Range |
365 - 426 |
|
Slope |
Average descending slope of the plot |
% |
Floating |
Range |
0 - 54 |
|
SloOrien |
Azimuth direction of the slope (descending) |
deg |
Floating |
Range |
4 - 352 |
|
SloShape |
Slope shape: Regular (1), concave (2) or convex (3) |
Integer |
Enumerated |
1-3 |
||
SurfRock |
Surface rockiness (Table 1) |
Integer |
Enumerated |
1-7 |
||
ThickO |
Thickness of the organic (O) horizon |
cm |
Floating |
Range |
0 - 9 |
|
ThickA |
Thickness of the A horizon |
cm |
Floating |
Range |
0 - 12 |
|
PresE |
Presence (1) or absence (0) of an E horizon |
Binary |
Enumerated |
0 - 1 |
||
RootDpth |
Maximum depth of roots |
cm |
Floating |
Range |
0 - 40 |
|
CanOpen |
Canopy openness (%) |
% |
Floating |
Range |
2 - 24 |
|
TreeYear |
Birth year of largest tree |
yyyy |
Integer |
Range |
1902 - 1946 |
|
Value |
Measured values for the above parameters |
Tree basal area file Croche_BA.txt is arranged as follows:
Attribute |
Definition |
Units |
Data type |
Attribute type |
Range (-999 not incl.) |
Transect |
A |
Character |
Enumerated |
A-E |
|
Plot |
xx |
Character |
Enumerated |
01 - 10 |
|
SampleDate |
First day of sampling |
yyyymmdd |
Integer |
Range |
19980825 - 20060815 |
Year |
yyyy |
Integer |
Range |
1998 - 2006 |
|
Species |
Species codes (Table 3) |
AAAA |
Character |
Taxonomic |
|
BA |
Species basal area |
m2/ha |
Floating |
Range |
0.2 – 30.81 |
B. Supplemental variable descriptions
Special characters/fields: "-999" denotes a lack of information for that field (sampling was not carried in that particular plot for that year).
Surface rockiness. Cover class (Table 1) of the surface occupied by stones in the plot, including exposed bedrock.
Canopy openness. Evaluated using hemispherical photographs taken one meter above the ground and analyzed with Gap Light Analyzer (Frazer et al. 2000).
Birth year of largest tree. Evaluated with a core borer.
Species basal area. Total basal area of mature trees (DBH > 10 cm) per species.
CLASS V. SUPPLEMENTAL DESCRIPTORS
History of data set usage: Laliberté, E., A. Paquette, P. Legendre, and A. Bouchard. 2007. Analyzing the role of deterministic and stochastic processes on beta diversity: a case study from a temperate forest. (submitted).
Data set update and quality: Data are updated annually in August and stored on computer hard drives at the SBL and at IRBV. Data entry on automated worksheets is done under the supervision of teaching staff. A variety of methods are used for quality assessment (see above). Starting in 2007, the metadata will be presented to the students to facilitate the standardization of data entry and storage at the source, as well as raise their awareness to the importance of the quality of the data.
Future plans: Future plans include the evaluation of new environmental parameters, such as soil fractions and pH, and the re-evaluation of canopy openness and basal area following the windstorm of August 1st 2006 (100 km/h winds).
Data set analysis recommendations: This data set is of particular interest for testing theories and statistical methods related to the spatial and temporal variation of plant distributions. Some words of caution:
Seedling classes were joined in 1998, 2000, and 2001. Abundances from other years should first be combined if they are to be used in an analysis covering the whole temporal range.
Seedlings and herbaceous/shrub species were not evaluated on a common scale. Distance-based analyses involving all species should be conducted with that in mind. For example, within-class relative scores should first be calculated before distances are computed.
Species that are absent in a given year/plot, but otherwise present in other years or in other plots, are not listed and should not be interpreted as missing values. Nil densities or cover should be manually entered when required.
ACKNOWLEDGMENTS
We gratefully acknowledge the long-term support of Université de Montréal and especially the staff at the Station de biologie des Laurentides (SBL), as well as S. Daigle and S. Hay at IRBV. We wish to thank the following teaching assistants for the supervision of data collection from 1998 to 2006: K. Benjamin, J. Corriveau, G. Couture, L. d’Orangeville, M. Lapointe, R. Léonard, G. Maltais-Landry, C. Mercier, P.-O. Roy, C. Savage, R. Schmucki, J. Thibeault, M.-A. Vaillancourt, and J. Villeneuve. Finally, we want to acknowledge the dedication of several cohorts of students who enthusiastically participated in this sampling effort.
LITERATURE CITED
Barbour, M. G., J. H. Burk, W. D. Pitts, F. S. Gilliam, and M. W. Schwartz. 1999. Terrestrial plant ecology. Third edition. Benjamin/Cummings, Menlo Park, Californai, USA.
Barker Plotkin, A. A., and D. R. Foster. 2006. Sustaining long-term research through changing times at the Harvard Forest. Pages 41–52 in L. C. Irland, A. E. Camp, J. C. Brissette, and Z. R. Donohew, editors. Long-term silvicultural and ecological studies: Results for science and management. The Global Institute of Sustainable Forestry; Yale School of Forestry and Environmental Studies.
Borcard, D., P. Legendre, C. Avois-Jacquet, and H. Tuomisto. 2004. Dissecting the spatial structure of ecological data at multiple scales. Ecology 85:1826–1832.
Braun-Blanquet, J. 1932. Plant sociology : the study of plant communities (translated, revised and edited by G. D. Fuller and H. S. Conrad). McGraw-Hill, New York, New York, USA.
Frazer, G. W., C. D. Canham, and K. P. Lerstzan. 2000. Gap Light Analyzer 2.0. Bulletin of the Ecological Society of America 81:191–197.
Harmon, M. E., and W. K. Lauenroth. 2003. Ecological variability in space and time: Insights gained from the US LTER program. BioScience 53:57–67.
Hobbie, J. E., S. R. Carpenter, N. B. Grimm, J. R. Gosz, and T. R. Seastedt. 2003. The US Long Term Ecological Research program. BioScience 53:21–32.
Irland, L. C., A. E. Camp, J. C. Brissette, and Z. R. Donohew, editors. 2006. Long-term silvicultural and ecological studies: Results for science and management. The Global Institute of Sustainable Forestry; Yale School of Forestry and Environmental Studies.
Kratz, T. K., L. A. Deegan, M. E. Harmon, and W. K. Lauenroth. 2003. Ecological variability in space and time: Insights gained from the US LTER program. BioScience 53:57–67.
Laliberté, E., A. Paquette, P. Legendre, and A. Bouchard. 2007. Analyzing the role of deterministic and stochastic processes on beta diversity: a case study from a temperate forest. (submitted).
Legendre, P. 1993. Spatial autocorrelation: trouble or new paradigm? Ecology 74:1659–1673.
Levin, S. A. 1992. The problem of pattern and scale in ecology. Ecology 73:1943–1967.
Lortie, M. 1979. Arbres, forêts et perturbations naturelles au Québec. Les Presses de l'Université Laval, Québec, 173 pp.
Lovett, G. M., D. A. Burns, C. T. Driscoll, J. C. Jenkins, M. J. Mitchell, L. Rustad, J. B. Shanley, G. E. Likens, and R. Haeuber. 2007. Who needs environmental monitoring? Frontiers in Ecology and the Environment 5:253–260.
Mabry, C., and T. Korsgren. 1998. A permanent plot study of vegetation and vegetation-site factors fifty-three years following disturbance in central New England, U.S.A.. Écoscience 5:232–240.
Motzkin, G., P. Wilson, D. R. Foster, and A. Allen. 1999. Vegetation patterns in heterogeneous landscapes: The importance of history and environment. Journal of Vegetation Science 10:903–920.
Savage, C. 2001. Recolonisation forestière dans les Basses Laurentides au sud du domaine climacique de l'érablière à bouleau jaune. M.Sc. thesis. Département des sciences biologiques, Université de Montréal, Montréal, Canada.
Soil Survey Division Staff. 1993. Soil survey manual. Soil Conservation Service. U.S. Department of Agriculture Handbook no. 18, Washington D.C., USA.
SIMAT. 2000. 1970–2000 meteoroligical data for the St-Hippolyte station. Service de l'information sur le milieu atmosphérique, Direction du suivi de l'état de l'environnement, Ministère du Développement durable, de l'Environnement et des Parcs, Québec, Canada.
Symstad, A. J., F. S. Chapin, D. H. Wall, K. L. Gross, L. F. Huenneke, G. G. Mittelbach, D. P. C. Peters, and D. Tilman. 2003. Long-term and large-scale perspectives on the relationship between biodiversity and ecosystem functioning. BioScience 53:89–98.
Wiens, J. A., J. F. Addicott, T. J. Case, and J. Diamond. 1986. Overview: the importance of spatial and temporal scale in ecological investigations. Pages 145–153 in J. Diamond and T. J. Case, editors. Community Ecology. Harper and Row Publishers, New York, New York, USA.
Wright, S. J., H. C. Muller-Landau, O. Calderon, and A. Hernandez. 2005. Annual and spatial variation in seedfall and seedling recruitment in a neotropical forest. Ecology 86:848–860.
Ysebaert, T., and P. M. J. Herman. 2002. Spatial and temporal variation in benthic macrofauna and relationships with environmental variables in an estuarine, intertidal soft-sediment environment. Marine Ecology Progress Series 244:105–124.
FIG. 1. Station de biologie des Laurentides (SBL) and Lac Croche vegetation transects area.
Table 3. Species codes (generally the first two letters of the genus followed by the first two letters of the species).
Species name |
Code |
Abies balsamea |
ABBA |
Acer pensylvanicum |
ACPE |
Acer rubrum |
ACRU |
Acer saccharum |
ACSA |
Acer spicatum |
ACSP |
Achillea millefolium |
ACMI |
Actaea sp. |
ATSP |
Amelanchier sp. |
AMSP |
Antennaria sp. |
ANSP |
Apocynum androsaemifolium |
APAN |
Aralia hispida |
ARHI |
Aralia nudicaulis |
ARNU |
Aster acuminatus |
ASAC |
Aster cordifolius |
ASCO |
Aster macrophyllus |
ASMA |
Athyrium filix-femina |
ATFI |
Betula alleghaniensis |
BEAL |
Betula papyrifera |
BEPA |
Carex sp. |
CASP |
Chamaedaphne calyculata |
CHCA |
Chimaphila umbellata |
CHUM |
Chiogenes hispidula |
CHHI |
Clintonia borealis |
CLBO |
Convolvulus sepium |
COSE |
Coptis groenlandica |
COGR |
Cornus alternifolia |
COAL |
Cornus canadensis |
COCA |
Corylus cornuta |
COCO |
Cypripedium acaule |
CYAC |
Dalibarda repens |
DARE |
Dennstaedtia punctilubola |
DEPU |
Diervilla lonicera |
DILO |
Dryopteris marginalis |
DRMA |
Dryopteris phegopteris |
DRPH |
Dryopteris spinulosa |
DRSP |
Epigea repens |
EPRE |
Epipactis helleborine |
EPHE |
Equisetum sylvaticum |
EQSY |
Fagus grandifolia |
FAGR |
Gallium sp. |
GASP |
Gaultheria procumbens |
GAPR |
Goodyera repens |
GORE |
Gymnocarpium dryopteris |
GYDR |
Habenaria orbiculata |
HAOR |
Hieracium florentinum |
HIFL |
Kalmia angustifolia |
KAAN |
Ledum groenlandicum |
LEGR |
Linnaea borealis |
LIBO |
Lonicera canadensis |
LOCA |
Lycopodium annotinum |
LYAN |
Lycopodium clavatum |
LYCL |
Lycopodium complanatum |
LYCO |
Lycopodium lucidulum |
LYLU |
Lycopodium obscurum |
LYOB |
Maianthemum canadense |
MACA |
Medeola virginiana |
MEVI |
Melampyrum lineare |
MELI |
Mitchella repens |
MIRE |
Monotropa uniflora |
MOUN |
Myrica gale |
MYGA |
Nemopanthus mucronatus |
NEMU |
Osmunda cinnamomea |
OSCI |
Osmunda claytoniana |
OSCL |
Osmunda regalis |
OSRE |
Ostrya virginiana |
OSVI |
Oxalis montana |
OXMO |
Picea glauca |
PIGL |
Picea mariana / P. rubens |
PISP |
Pinus strobus |
PIST |
Poaceae |
POSP |
Polygonatum pubescens |
POPU |
Polygonum cilinode |
POCI |
Polypodium virginianum |
POVI |
Populus grandidentata |
POGR |
Prenanthes sp. |
PRSP |
Prunus virginiana |
PRVI |
Pteridium aquilinum |
PTAQ |
Pyrola chlorantha / P. elliptica / P. americana / Orthilia secunda |
PYSP |
Ribes glandulosum |
RIGL |
Rubus alleghaniensis |
RUAL |
Rubus idaeus |
RUID |
Rubus pubescens |
RUPU |
Salix sp. |
SASP |
Smilacina racemosa |
SMRA |
Solidago sp. |
SOSP |
Sorbus americana |
SOAM |
Streptopus roseus |
STRO |
Thuja occidentalis |
THOC |
Trientalis borealis |
TRBO |
Trillium erectum / T. undulatum |
TRSP |
Tsuga canadensis |
TSCA |
Uvularia sessilifolia |
UVSE |
Vaccinium angustifolium |
VAAN |
Vaccinium myrtilloides |
VAMY |
Viburnum alnifolium |
VIAL |
Viburnum cassinoides |
VICA |
Viola sp. |
VISP |