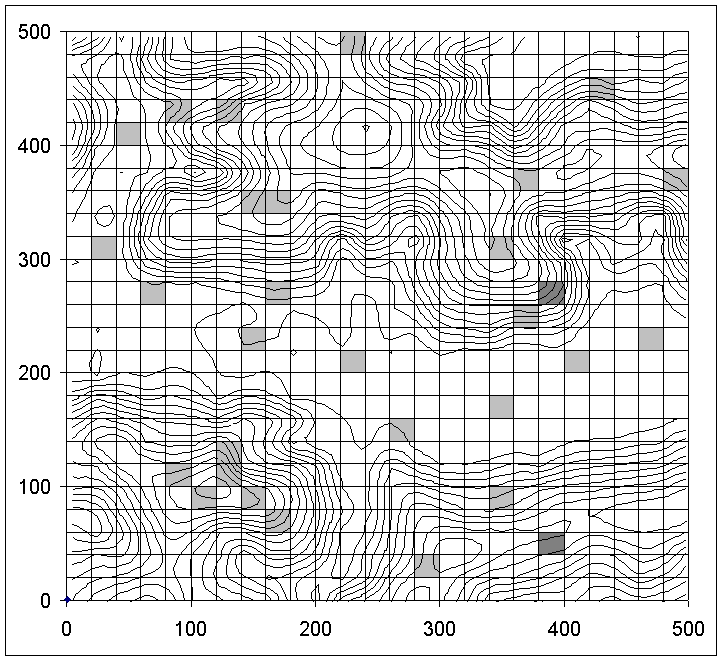
FIG. B1. Topographic map of the 25-ha Yasuní FDP, showing locations of the 30 nested 20 × 20 m seedling plots. The two plots shown in dark gray were those deleted to form the partial dataset, as they contained very high densities of seedlings.
Appendix B. Topographic map of the 25-ha Yasuní forest dynamics plot, showing locations of the 30 nested 20 × 20 m seedling plots.
| |
FIG. B1. Topographic map of the 25-ha Yasuní FDP, showing locations of the 30 nested 20 × 20 m seedling plots. The two plots shown in dark gray were those deleted to form the partial dataset, as they contained very high densities of seedlings. |