Appendix C. Figures showing single species responses to experimental treatments.
| |
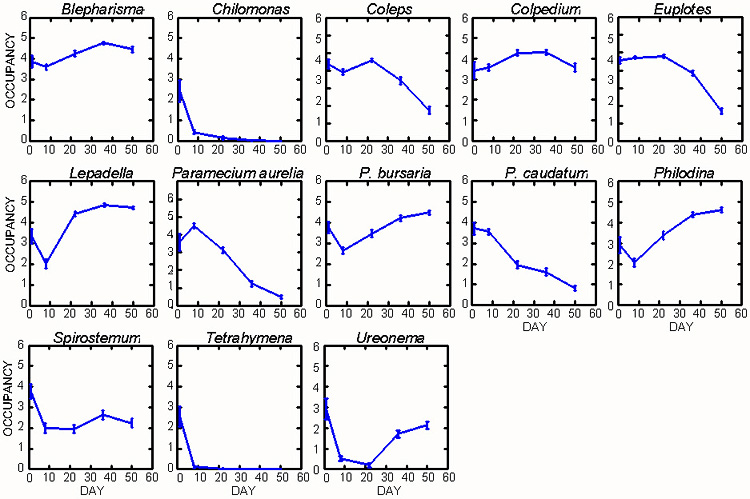
| FIG. C1. Occupancy patterns for each species over time. |
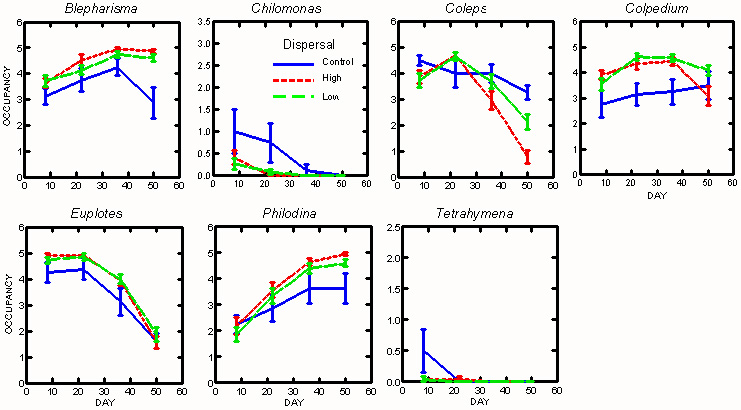 |
| FIG. C2. Species occupancy patterns for the three dispersal treatments. Shown are species significantly affected by dispersal treatment (see Table 1). |
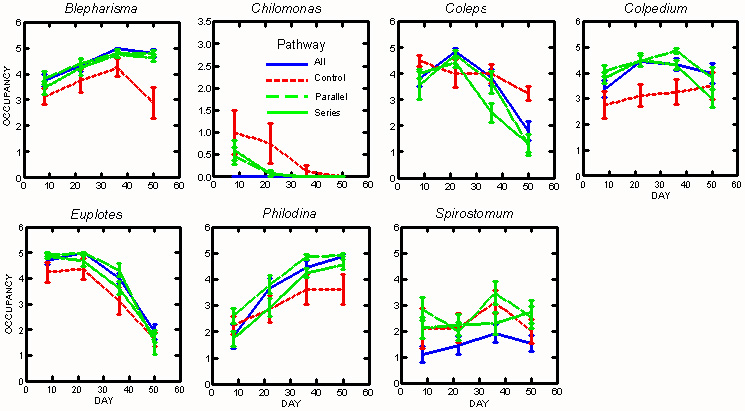 |
| FIG. C3. Species occupancy patterns for the four dispersal pathway treatments. Shown are species significantly affected by pathway treatment (see Table 1). |
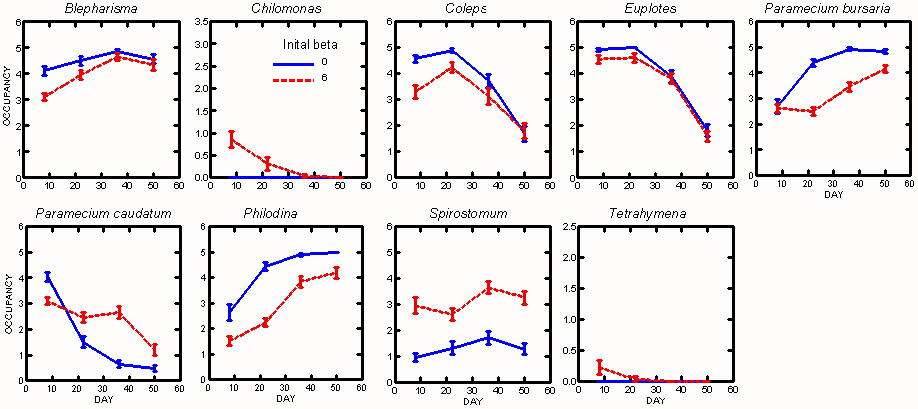 |
| FIG. C4. Species occupancy patterns for the two initial beta treatments. Shown are species significantly affected by initial beta treatment (see Table 1). |