Appendix D. Results of repeated measures analysis and ANOVA on stem growth using plant cohort (plants existed before the burns vs. only after), fire treatment, and block as independent variables.
Repeated measures analysis. Since the Mauchly's test of sphericity was significant (Mauchly's W = 0.964, df = 2, P = 0.003), we used the results with the Greenhouse-Geisser adjustment. Tests of Within-Subjects effects indicated that time (years post fire, F = 9.88, df = 1.93, P < 0.001), two-way interaction of time and fire treatment (F = 9.98, df = 3.86, P < 0.001), and three-way interaction of time, fire treatment and block (F = 3.75, df = 3.86, P = 0.006) were significant. Tests of Between-Subjects Effects indicated that only block was marginally significant (F = 3.77, df = 1, P = 0.053).
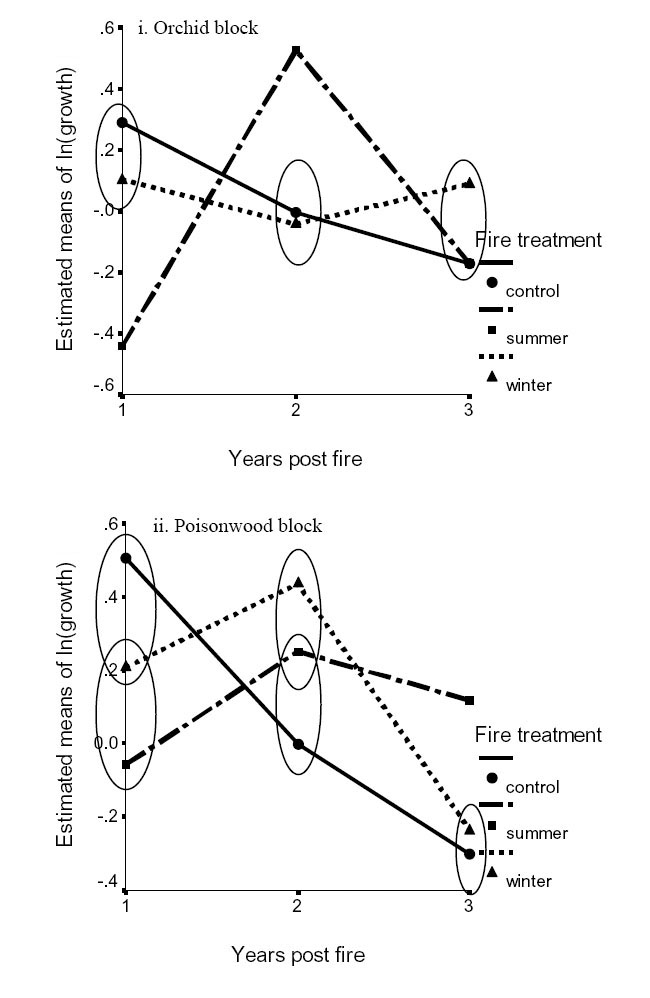
In the Orchid block (Fig. D1i), stem growth in the control (P = 0.001) and winter-burn treatments (P = 0.023) were significantly greater than summer-burn treatment at year one post fire. The pattern was reversed at year two post fire, in which stem growth was significantly greater than control (P = 0.017) and winter-burn treatments (P = 0.012). At year three post fire, no significant difference was seen among the three treatments.
In Poisonwood block (Fig. D1ii), the control treatment had higher stem growth than summer-burn treatment (P = 0.001) at year one post fire. However, the control treatment had smaller stem growth than winter-burn treatment (P = 0.003) at year two post fire. At year three post fire, the summer-burn treatment had greater stem growth than control (P = 0.005), and winter-burn treatments (P = 0.045).
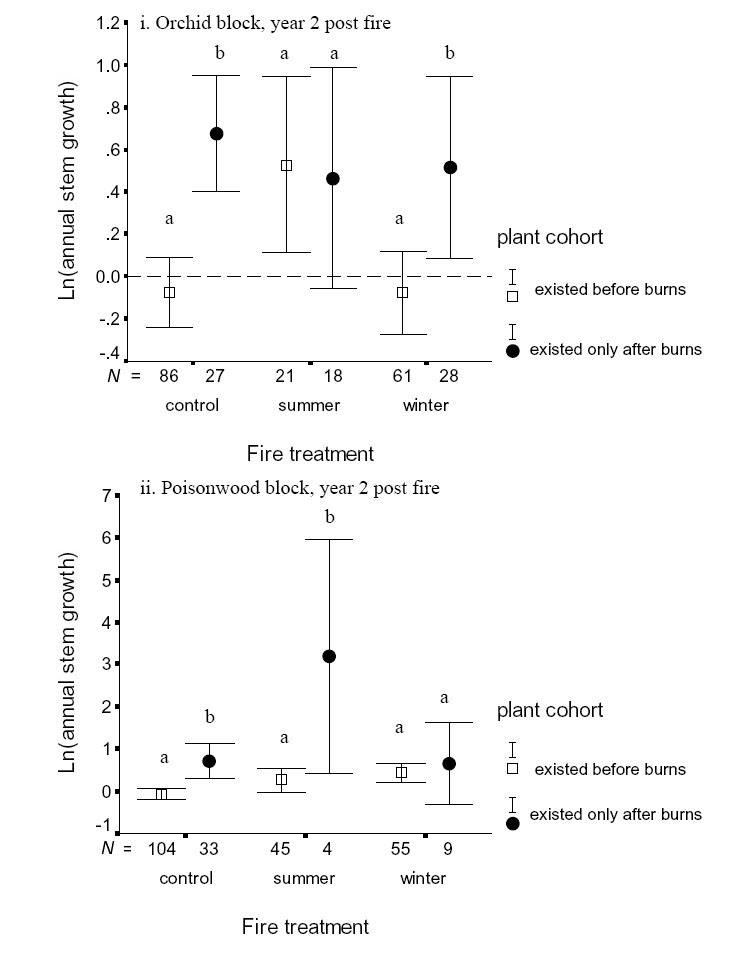
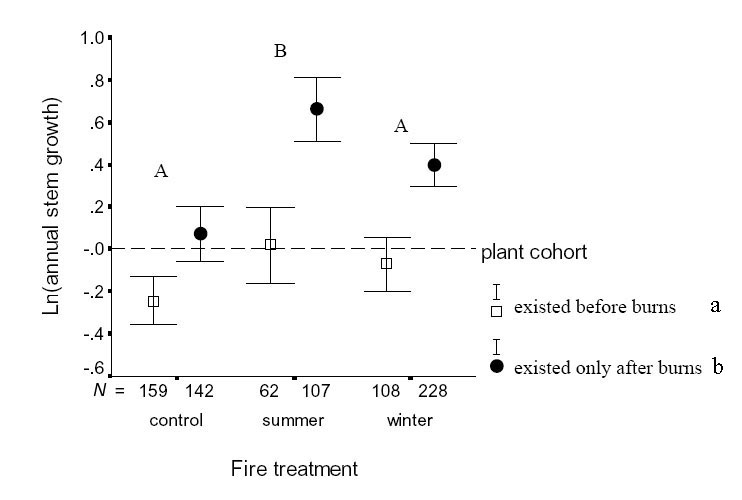
ANOVA year 2 post fire. Plant cohort (F = 56.27, df = 1, P < 0.001), fire treatment (F = 15.03, df = 2, P < 0.001), and block (F = 20.32, df = 1, P < 0.001) were significant. In addition, all two-way and three-way interactions were also significant (F = 5.12, df = 2, P = 0.006 for plant cohort by fire treatment, F = 14.61, df = 1, P < 0.001 for plant cohort by block, F = 8.50, df = 2, P < 0.001 for fire treatment by block, and F = 15.11, df = 2, P < 0.001 for plant cohort by fire treatment by block). Including plant cohort as a factor has made the analysis more sensitive to differences in block as well as interactions between block and fire treatment, than analysis without plant cohort (Appendix B Table B1). In the latter analysis, neither block, nor the interaction between block and fire treatment was significant.
In Orchid block, plants that existed only after the burns had greater annual stem growth than plants that existed before burns during the second year post fire, in both the control and winter-burn treatment (Fig. D2). However, no difference was seen between the two cohorts of plants in the summer-burn treatment.
In Poisonwood block, plants that existed only after burns had greater annual stem growth than plants that existed before burns in the control and summer-burn treatment (Fig. D2). No difference was seen in the winter-burn treatment.