Ecological Archives
E085-061-A3
Michael Schaub, Olivier Gimenez,
Benedikt R. Schmidt, and Roger Pradel. 2004. Estimating survival and temporary
emigration in the multistate capture–recapture framework. Ecology
85:2107–2113.
Appendix C. Figures with
the evaluation of bias and precision of parameters estimated with different
time invariant temporary emigration models.
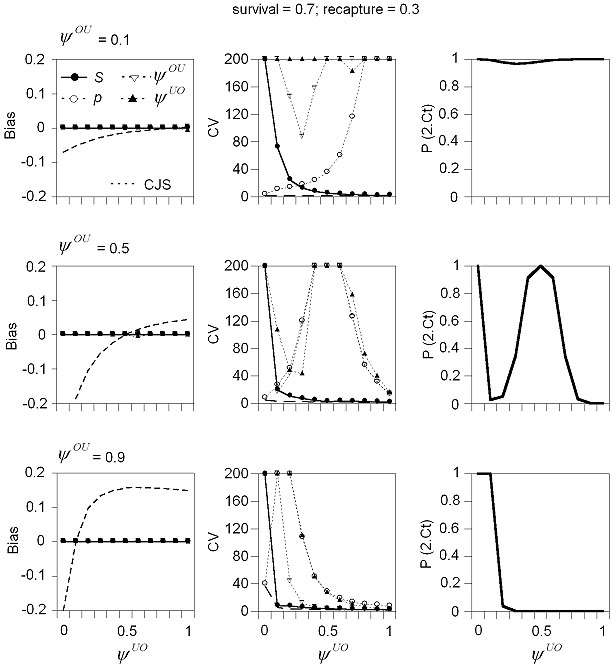
This appendix shows the evaluation
of the performance of the TE model under more survival and on-site recapture
probabilities scenarios than in Fig. 1. It shows the asymptotic absolute bias
and coefficient of variation (CV) of parameter estimates,
and the P value of the goodness-of-fit test component 2.Ct for the TE
model {S.,  ,
,
 , p.}. The
model is evaluated under different conditions with respect to survival (S),
emigration (
, p.}. The
model is evaluated under different conditions with respect to survival (S),
emigration ( ), immigration
(
), immigration
( ) and on-site recapture probabilities
(p). Temporary emigration is random when =
1-, and emigration is permanent
when = 0. The lines in the
graphs are truncated at � 0.2 (bias), at 200% (CV) and at 150 (
) and on-site recapture probabilities
(p). Temporary emigration is random when =
1-, and emigration is permanent
when = 0. The lines in the
graphs are truncated at � 0.2 (bias), at 200% (CV) and at 150 ( ).
In the charts showing the bias, often only the survival rate is visible. The
bias in the other parameters is the same as that of the survival rate when not
visible. CJS refers to the survival rate estimated with the Cormack-Jolly-Seber
model {S., p.}.
).
In the charts showing the bias, often only the survival rate is visible. The
bias in the other parameters is the same as that of the survival rate when not
visible. CJS refers to the survival rate estimated with the Cormack-Jolly-Seber
model {S., p.}.
[Back to E085-061]