Ecological Archives A025-145-A1
Ashehad A. Ali, Chonggang Xu, Alistair Rogers, Nathan G. McDowell, Belinda E. Medlyn, Rosie A. Fisher, Stan D. Wullschleger, Peter B. Reich, Jasper A. Vrugt, William L. Bauerle, Louis S. Santiago, and Cathy J. Wilson. 2015. Global-scale environmental control of plant photosynthetic capacity. Ecological Applications 25:23492365. http://dx.doi.org/10.1890/14-2111.1
Appendix A. A list of published literature sources and further details of linear mixed effects analyses using various temperature response functions mentioned in the text.
Table A1. References to measurements of carboxylation rate (Vc,max25; µmol CO2 m-2 s-1), electron transport rate (Jmax25; µmol electron m-2 s-1) and leaf nitrogen contents (LNCa; gN m-2) of different types of studies (seasonal = 1, non-seasonal = 2 and vertical canopy layer studies = 3), different plant growth forms (herbaceous = 1, shrubs = 2, trees = 3) and the versions of equations (1, 2) studies used (see Appendix F for classification). The data set contains 833 data points of Vc,max25 and 636 data points of Jmax25 from 127 plant species.
Reference |
Growth Form |
Study Type |
Equation Version |
Bubier et al. (2011) |
2 |
2 |
1 |
Calfapietra et al. (2005) |
3 |
2 |
1 |
Carswell et al. (2000) |
3 |
2,3 |
2 |
Crous et al. (2008) |
3 |
2 |
1 |
Crous et al. (2010) |
1 |
2 |
1 |
Curtis and Teeri (1992) |
3 |
2 |
1 |
Curtis et al. (1995) |
3 |
2 |
1 |
Domingues et al. (2005) |
2,3 |
2,3 |
1 |
Domingues et al. (2007) |
2,3 |
2,3 |
1 |
Domingues et al. (2010) |
2,3 |
2 |
2 |
Frak et al. (2002) |
3 |
3 |
1 |
Grassi and Bagnaresi (2001) |
3 |
3 |
1 |
Grassi et al. (2005) |
3 |
1 |
1 |
Han et al. (2003) |
3 |
2 |
1 |
Han et al. (2004) |
3 |
2 |
2 |
Han and Chiba (2009) |
3 |
2 |
1 |
Hikosaka, Nabeshima and Hiura (2007) |
3 |
2 |
1 |
Hollinger et al. (1992) |
3 |
2 |
1 |
Iio et al. (2008) |
3 |
1 |
1 |
Katahata et al. (2007) |
2 |
2 |
1 |
Le Roux et al. (2001) |
3 |
2,3 |
1 |
Limousin et al. (2013) |
3 |
2 |
1 |
Maire et al. (2012) |
1 |
2 |
1 |
Medlyn et al. (1999) |
3 |
2 |
1 |
Medlyn et al. (2007) |
3 |
1 |
2 |
Medlyn et al. (2002b) |
3 |
2 |
1 |
Meir et al. (2002) |
3 |
2,3 |
2 |
Meir et al. (2007) |
3 |
2 |
1 |
Niinemets, Kull and Tenhunen (1998) |
2,3 |
2,3 |
1 |
Niinemets et al. (2005) |
3 |
2 |
1 |
Niinemets et al. (2007) |
3 |
2 |
2 |
Niu et al. (2008) |
1 |
2 |
2 |
Op de Beeck (2010) |
3 |
2 |
1 |
Porté and Lostau (1998) |
3 |
2,3 |
2 |
Rogers (unpublished data) |
1,2 |
2 |
1 |
Rogers and Ellsworth (2002) |
3 |
2 |
1 |
Rogers et al. (1998) |
1 |
2 |
1 |
Santaigo and Mulkey (2003) |
3 |
2 |
1 |
Sholtis et al. (2004) |
3 |
2 |
1 |
van de Weg et al. (2012) |
2,3 |
2 |
1 |
Vogel et al. (1995) |
3 |
2 |
1 |
Walcroft et al. (2002) |
3 |
2 |
1 |
Wang et al. (2008) |
3 |
1 |
1 |
Warren et al. (2001) |
3 |
2,3 |
2 |
Wilson, Baldocchi and Hanson (2000) |
3 |
1 |
1 |
Xu and Baldocchi (2003) |
3 |
1 |
1 |
Xu and Zhou (2006) |
1 |
2 |
1 |
Zhang and Dang (2005) |
3 |
2 |
1 |
Zhang, Hu and Li (2006) |
3 |
2 |
2 |
Table A2. Coefficients of linear mixed-effects of photosynthetic capacity (Vc,max25;µmol CO2 m-2 s-1), leaf nitrogen content (LNCa; gN m-2) and the maximum photosynthetic nitrogen use efficiency of Vc,max25 (NUEc,max25;µmol CO2 g-1N s-1) of all of the plant functional types with different environmental variables (daytime radiation (R; W/m²), daytime duration (D; hours), temperature (T; °C), relative humidity (RH; unitless)). The temperature response function (TRF4) used to model Vc,max25 was based on Kattge and Knorr (2007)’s formulation but had limited temperature acclimation, where the plant’s growth temperature was constrained between 11°C and 35°C. The p values shown in the parentheses were obtained using analysis of variance (ANOVA).
Variables |
Vc,max25 |
LNCa |
NUEc,max25 |
Intercept |
-38.15 (<0.01) |
2.26 (<0.01) |
-7.35 (0.41) |
LNCa |
16.37 (<0.01) |
- |
- |
R |
0.04 (<0.01) |
0.001 (<0.01) |
0.01 (0.12) |
D |
4.16 (<0.01) |
-0.023 (<0.05) |
2.72 (<0.01) |
RH |
12.19 (0.49) |
-0.26 (0.25) |
9.88 (0.32) |
T |
-0.94 (<0.01) |
-0.003 (0.51) |
-0.49 (<0.01) |
Table A3. Correlation matrix of daytime radiation, day length, temperature, relative humidity, and leaf nitrogen content (LNCa).
|
LNCa (gN m-2) |
Daytime radiation (W/m²) |
Day length (hours) |
Relative humidity (unitless) |
Growth temperature (°C) |
LNCa (gN m-2) |
- |
0.16 |
-0.10 |
-0.18 |
0.07 |
Daytime radiation (W/m²) |
0.16 |
- |
0.35 |
-0.40 |
0.002 |
Day length (hours) |
-0.10 |
0.35 |
- |
0.33 |
-0.50 |
Relative humidity (unitless) |
-0.18 |
-0.40 |
0.33 |
- |
-0.32 |
Growth temperature (°C) |
0.07 |
0.002 |
-0.50 |
-0.32 |
- |
Table A4. The estimated variance of different errors resulting from spatial location, species, time (month) and residual are denoted as εlocation, εspecies, εmonth and ε, respectively, for the linear mixed-effects model of Vc,max25 (µmol CO2 m-2s-1) using different TRFs. Temperature response function 1 (TRF1) is adapted from Collatz et al. (1991) and Sellers et al. (1996), TRF2 is a temperature response function proposed by Leuning (2002), TRF3 is a temperature response function based on Kattge and Knorr (2007)’s formulation of acclimation, where temperature optimum was a function of growth temperature, and TRF4 is based on Kattge and Knorr (2007)’s formulation but with limited temperature acclimation, where the plant’s growth temperature was constrained between 11°C and 35°C. See Appendix G for details of different temperature response functions.
Temperature response functions |
εlocation |
εspecies |
εmonth |
ε |
TRF1 |
228 |
95 |
206 |
159 |
TRF2 |
238 |
110 |
127 |
196 |
TRF3 |
246 |
94 |
144 |
176 |
TRF4 |
248 |
105 |
136 |
188 |
Table A5. The estimated variance of different errors resulting from spatial location, species, time (month) and residual are denoted as εlocation, εspecies, εmonth and ε, respectively, for the linear mixed-effects model of Jmax25 (µmol electron m-2s-1) using different TRFs. Temperature response function 1 (TRF1) is adapted from Collatz et al. (1991) and Sellers et al. (1996), TRF2 is a temperature response function proposed by Leuning (2002), TRF3 is a temperature response function based on Kattge and Knorr (2007)’s formulation of acclimation, where temperature optimum was a function of growth temperature, and TRF4 is based on Kattge and Knorr (2007)’s formulation but with limited temperature acclimation, where the plant’s growth temperature was constrained between 11°C and 35°C. See Appendix G for details of different temperature response functions.
Temperature response functions |
εlocation |
εspecies |
εmonth |
ε |
TRF1 |
828 |
476 |
558 |
716 |
TRF2 |
735 |
374 |
226 |
592 |
TRF3 |
860 |
453 |
564 |
750 |
TRF4 |
560 |
439 |
309 |
754 |
Table A6. Intercepts and coefficients of the linear mixed-effects model of Vc,max25 (µmol CO2 m-2s-1) of the fowling form: ,![]() that consisted the growth form (herbaceous (H), shrubs (S) and trees (Tr)), environmental variables (day length, (D), relative humidity, (RH), temperature (T) and radiation (R)) and leaf nitrogen content (LNCa) for different TRFs. Temperature response function 1 (TRF1) is adapted from Collatz et al. (1991) and Sellers et al. (1996), TRF2 is a temperature response function proposed by Leuning (2002), TRF3 is a temperature response function based on Kattge and Knorr (2007)’s formulation of acclimation, where temperature optimum was a function of growth temperature, and TRF4 is based on Kattge and Knorr (2007)’s formulation but with limited temperature acclimation, where the plant’s growth temperature was constrained between 11°C and 35°C. See Appendix G for details of different temperature response functions.
that consisted the growth form (herbaceous (H), shrubs (S) and trees (Tr)), environmental variables (day length, (D), relative humidity, (RH), temperature (T) and radiation (R)) and leaf nitrogen content (LNCa) for different TRFs. Temperature response function 1 (TRF1) is adapted from Collatz et al. (1991) and Sellers et al. (1996), TRF2 is a temperature response function proposed by Leuning (2002), TRF3 is a temperature response function based on Kattge and Knorr (2007)’s formulation of acclimation, where temperature optimum was a function of growth temperature, and TRF4 is based on Kattge and Knorr (2007)’s formulation but with limited temperature acclimation, where the plant’s growth temperature was constrained between 11°C and 35°C. See Appendix G for details of different temperature response functions.
Temperature response function |
a |
b0 |
b1 |
b2 |
b3 |
b4 |
b5 |
b6 |
b7 |
TRF1 |
-48 |
0 |
8.3 |
-3.8 |
4.2 |
25 |
-1.2 |
0.06 |
17.8 |
TRF2 |
-71 |
0 |
12.3 |
-2.3 |
5.1 |
32 |
-0.9 |
0.07 |
19.2 |
TRF3 |
-56 |
0 |
11.4 |
1.9 |
4.2 |
23 |
-0.98 |
0.07 |
18.5 |
TRF4 |
-65 |
0 |
12 |
-0.2 |
4.9 |
28 |
-1.1 |
0.07 |
19 |
Table A7. Intercepts and coefficients of the linear mixed-effects model of Jmax25 (µmol electron m-2 s-1) of the fowling form: ,![]() that consisted the growth form (herbaceous (H), shrubs (S) and trees (Tr)), environmental variables (day length, (D), relative humidity, (RH), temperature (T) and radiation (R)) and leaf nitrogen content (LNCa) for different TRFs. Temperature response function 1 (TRF1) is adapted from Collatz et al. (1991) and Sellers et al. (1996), TRF2 is a temperature response function proposed by Leuning (2002), TRF3 is a temperature response function based on Kattge and Knorr (2007)’s formulation of acclimation, where temperature optimum was a function of growth temperature, and TRF4 is based on Kattge and Knorr (2007)’s formulation but with limited temperature acclimation, where the plant’s growth temperature was constrained between 11°C and 35°C. See Appendix G for details of different temperature response functions.
that consisted the growth form (herbaceous (H), shrubs (S) and trees (Tr)), environmental variables (day length, (D), relative humidity, (RH), temperature (T) and radiation (R)) and leaf nitrogen content (LNCa) for different TRFs. Temperature response function 1 (TRF1) is adapted from Collatz et al. (1991) and Sellers et al. (1996), TRF2 is a temperature response function proposed by Leuning (2002), TRF3 is a temperature response function based on Kattge and Knorr (2007)’s formulation of acclimation, where temperature optimum was a function of growth temperature, and TRF4 is based on Kattge and Knorr (2007)’s formulation but with limited temperature acclimation, where the plant’s growth temperature was constrained between 11°C and 35°C. See Appendix G for details of different temperature response functions.
Temperature response function |
a |
b0 |
b1 |
b2 |
b3 |
b4 |
b5 |
b6 |
b7 |
TRF1 |
-48 |
0 |
-25 |
-45 |
8.4 |
83.5 |
-3.4 |
0.1 |
34 |
TRF2 |
-56 |
0 |
-27 |
-50 |
8.7 |
83.1 |
-3.2 |
0.1 |
30 |
TRF3 |
-43 |
0 |
-24 |
-42 |
8.1 |
81 |
-3.5 |
0.1 |
35 |
TRF4 |
-79 |
0 |
-20 |
-40 |
9.8 |
92.1 |
-3.2 |
0.1 |
34 |
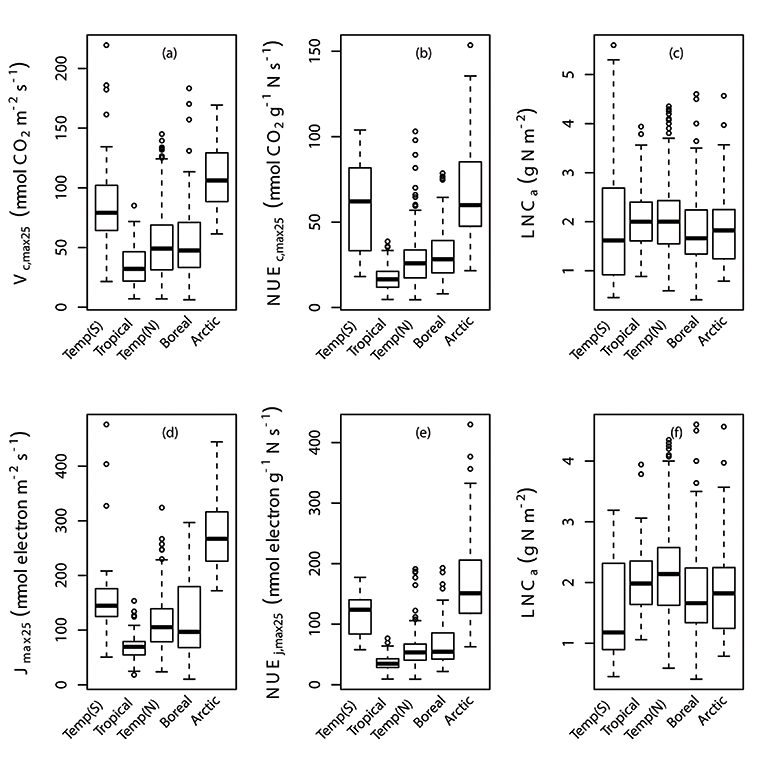
Fig. A1. Box plots of individual data points of Vc,max25, photosynthetic nitrogen use efficiency of Vc,max25 (NUEc,max25), Jmax25, photosynthetic nitrogen use efficiency of Jmax25 (NUEj,max25) and leaf nitrogen content (LNCa) by latitude (a,b,c,d,e,f). Vc,max25, NUEc,max25, NUEj,max25 and LNCa were binned at latitude in correspondence with their biome regions; Temperate region in the South of Equator (Temp(S)), Tropical, Temperate region in the North of Equator (Temp(N)), Boreal and Arctic. We used TRF1 as the temperature response function.
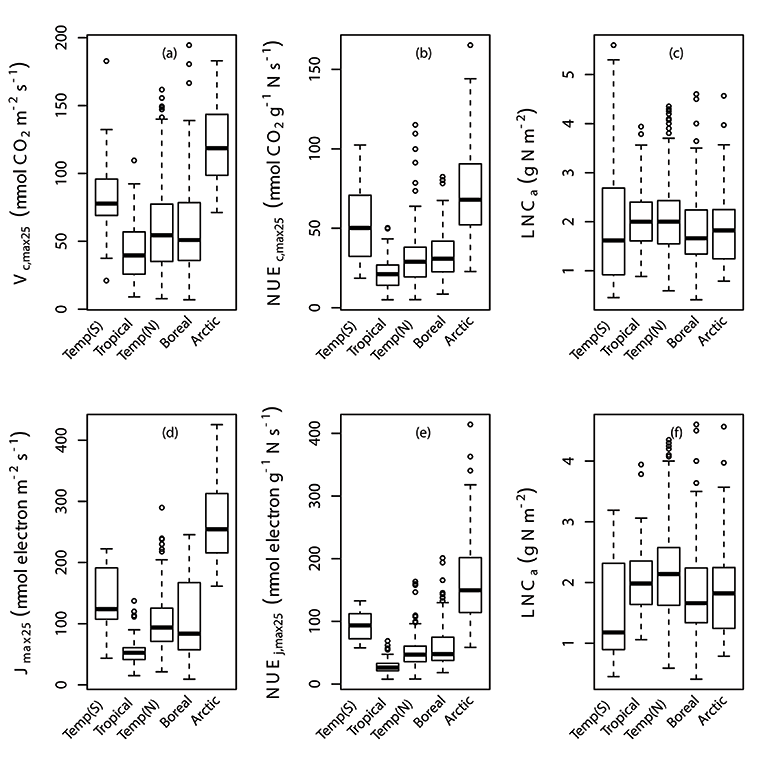
Fig. A2. Box plots of individual data points of Vc,max25, photosynthetic nitrogen use efficiency of Vc,max25 (NUEc,max25), Jmax25, photosynthetic nitrogen use efficiency of Jmax25 (NUEj,max25) and leaf nitrogen content (LNCa) by latitude (a,b,c,d,e,f). Vc,max25, NUEc,max25, NUEj,max25 and LNCa were binned at latitude in correspondence with their biome regions; Temperate region in the South of Equator (Temp(S)), Tropical, Temperate region in the North of Equator (Temp(N)), Boreal and Arctic. We used TRF2 as the temperature response function.
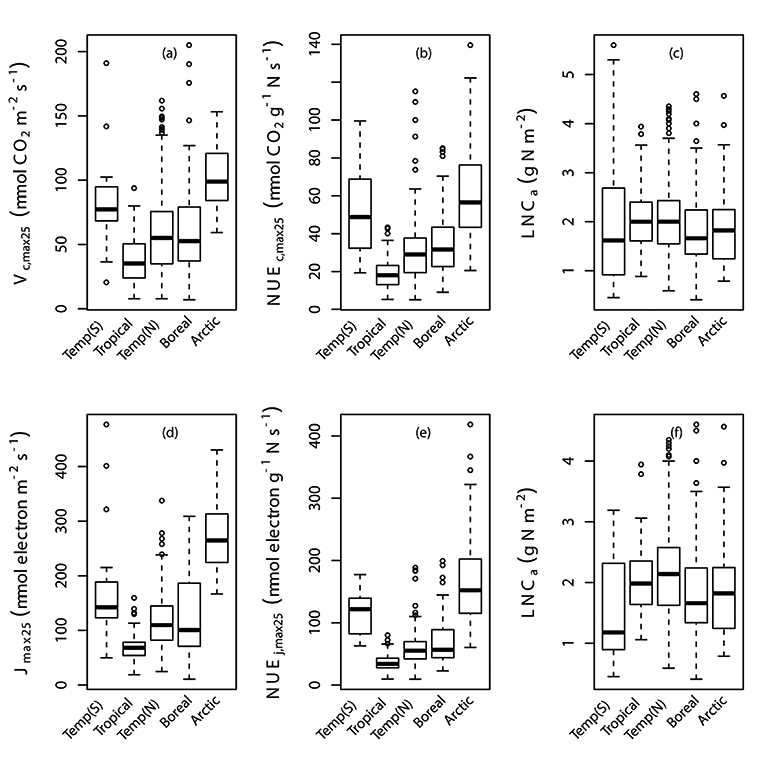
Fig. A3. Box plots of individual data points of Vc,max25, photosynthetic nitrogen use efficiency of Vc,max25 (NUEc,max25), Jmax25, photosynthetic nitrogen use efficiency of Jmax25 (NUEj,max25) and leaf nitrogen content (LNCa) by latitude (a,b,c,d,e,f). Vc,max25, NUEc,max25, NUEj,max25 and LNCa were binned at latitude in correspondence with their biome regions; Temperate region in the South of Equator (Temp(S)), Tropical, Temperate region in the North of Equator (Temp(N)), Boreal and Arctic. We used TRF3 as the temperature response function.
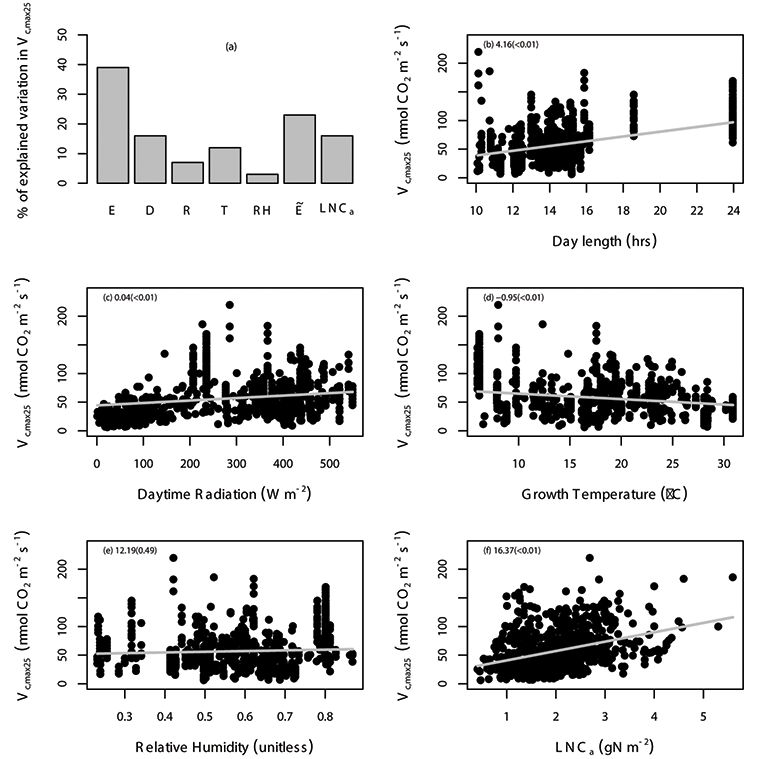
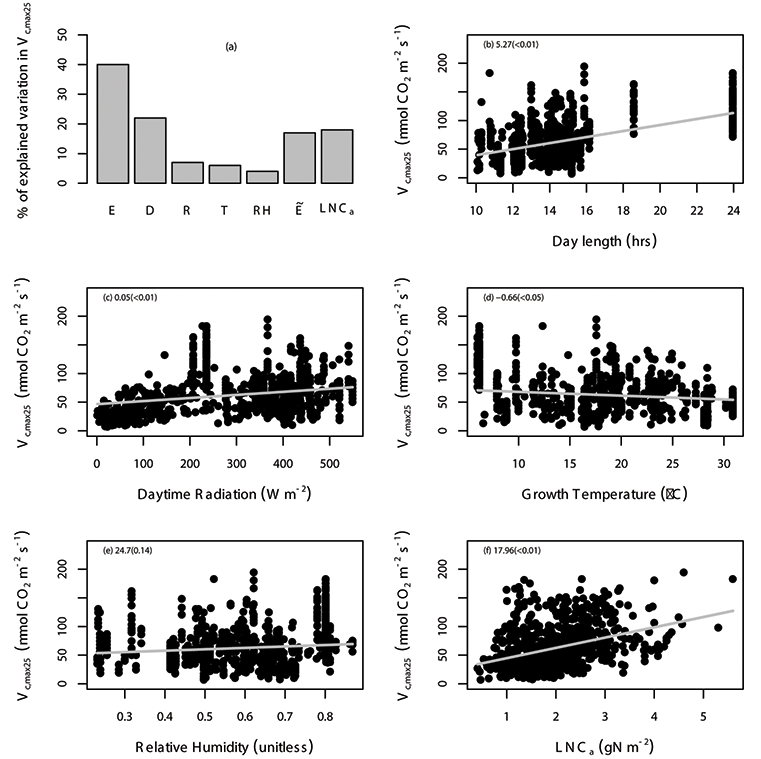
Fig. A4. Percentage of variation in Vc,max25 (µmol CO2 m-2 s-1) explained by area-based leaf nitrogen content (LNCa; gN m-2) and all of the environmental variables (E) are shown (a), where the specific environmental variables include day length (D; hours), daytime radiation (R; W/m²), growth temperature (T; °C), relative humidity (RH; unitless), and “” includes daytime radiation, growth temperature and relative humidity. The relationship between Vc,max25 and environmental variables including day length (b), daytime radiation (c), temperature (d), relative humidity (e), and leaf nitrogen content (f) with the gray solid line estimated from linear mixed-effects model. The data points correspond to an individual leaf. The coefficient of the regression and corresponding p values (in the parentheses) is shown in different panels. We used TRF1 as the temperature response function.
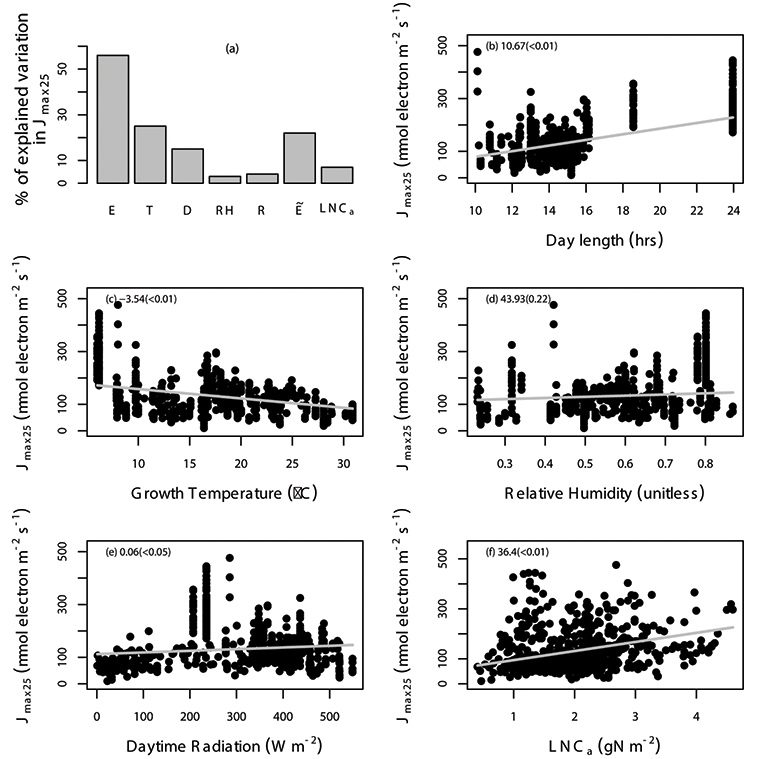
Fig. A5. Percentage of variation in Jmax25 (µmol electron m-2 s-1) explained by area-based leaf nitrogen content (LNCa; gN m-2) and all of the environmental variables (E) are shown (a), where the specific environmental variables include day length (D; hours), daytime radiation (R; W/m²), growth temperature (T; °C), relative humidity (RH; unitless), and “” includes daytime radiation, growth temperature and relative humidity. The relationship between Jmax25 and environmental variables including day length (b), daytime radiation (c), temperature (d), relative humidity (e), and leaf nitrogen content (f) with the gray solid line estimated from linear mixed-effects model. The data points correspond to an individual leaf. The coefficient of the regression and corresponding p values (in the parentheses) is shown in different panels. We used TRF1 as the temperature response function.
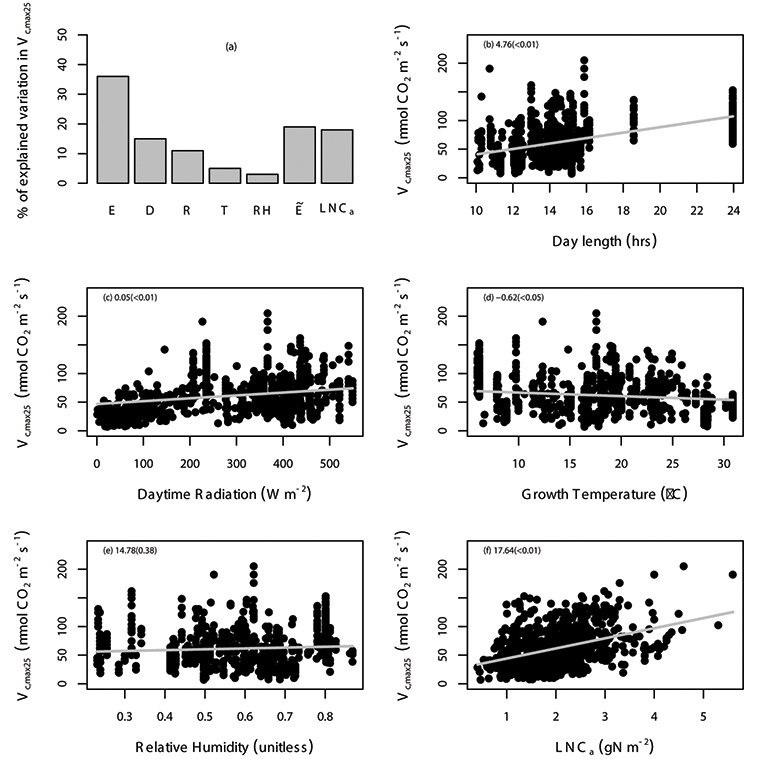
Fig. A6. Percentage of variation in Vc,max25 (µmol CO2 m-2 s-1) explained by area-based leaf nitrogen content (LNCa; gN m-2) and all of the environmental variables (E) are shown (a), where the specific environmental variables include day length (D; hours), daytime radiation (R; W/m²), growth temperature (T; °C), relative humidity (RH; unitless), and “” includes daytime radiation, growth temperature and relative humidity. The relationship between Vc,max25 and environmental variables including day length (b), daytime radiation (c), temperature (d), relative humidity (e), and leaf nitrogen content (f) with the gray solid line estimated from linear mixed-effects model. The data points correspond to an individual leaf. The coefficient of the regression and corresponding p values (in the parentheses) is shown in different panels. We used TRF2 as the temperature response function.
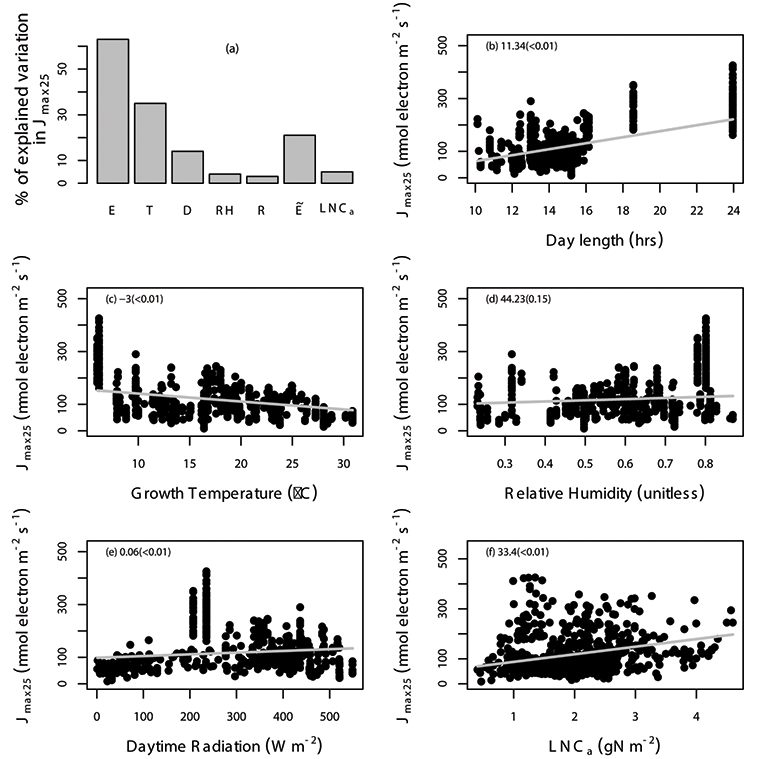
Fig. A7. Percentage of variation in Jmax25 (µmol electron m-2 s-1) explained by area-based leaf nitrogen content (LNCa; gN m-2) and all of the environmental variables (E) are shown (a), where the specific environmental variables include day length (D; hours), daytime radiation (R; W/m²), growth temperature (T; °C), relative humidity (RH; unitless), and “” includes daytime radiation, growth temperature and relative humidity. The relationship between Jmax25 and environmental variables including day length (b), daytime radiation (c), temperature (d), relative humidity (e), and leaf nitrogen content (f) with the grey solid line estimated from linear mixed-effects model. The data points correspond to an individual leaf. The coefficient of the regression and corresponding p values (in the parentheses) is shown in different panels. We used TRF2 as the temperature response function.
Fig. A8. Percentage of variation in Vc,max25 (µmol CO2 m-2 s-1) explained by area-based leaf nitrogen content (LNCa; gN m-2) and all of the environmental variables (E) are shown (a), where the specific environmental variables include day length (D; hours), daytime radiation (R; W/m²), growth temperature (T; °C), relative humidity (RH; unitless), and “” includes daytime radiation, growth temperature and relative humidity. The relationship between Vc,max25 and environmental variables including day length (b), daytime radiation (c), temperature (d), relative humidity (e), and leaf nitrogen content (f) with the gray solid line estimated from linear mixed-effects model. The data points correspond to an individual leaf. The coefficient of the regression and corresponding p values (in the parentheses) is shown in different panels. We used TRF3 as the temperature response function.
Fig. A9. Percentage of variation in Jmax25 (µmol electron m-2 s-1) explained by area-based leaf nitrogen content (LNCa; gN m-2) and all of the environmental variables (E) are shown (a), where the specific environmental variables include day length (D; hours), daytime radiation (R; W/m²), growth temperature (T; °C), relative humidity (RH; unitless), and “” includes daytime radiation, growth temperature and relative humidity. The relationship between Jmax25 and environmental variables including day length (b), daytime radiation (c), temperature (d), relative humidity (e), and leaf nitrogen content (f) with the gray solid line estimated from linear mixed-effects model. The data points correspond to an individual leaf. The coefficient of the regression and corresponding p values (in the parentheses) is shown in different panels. We used TRF3 as the temperature response function.
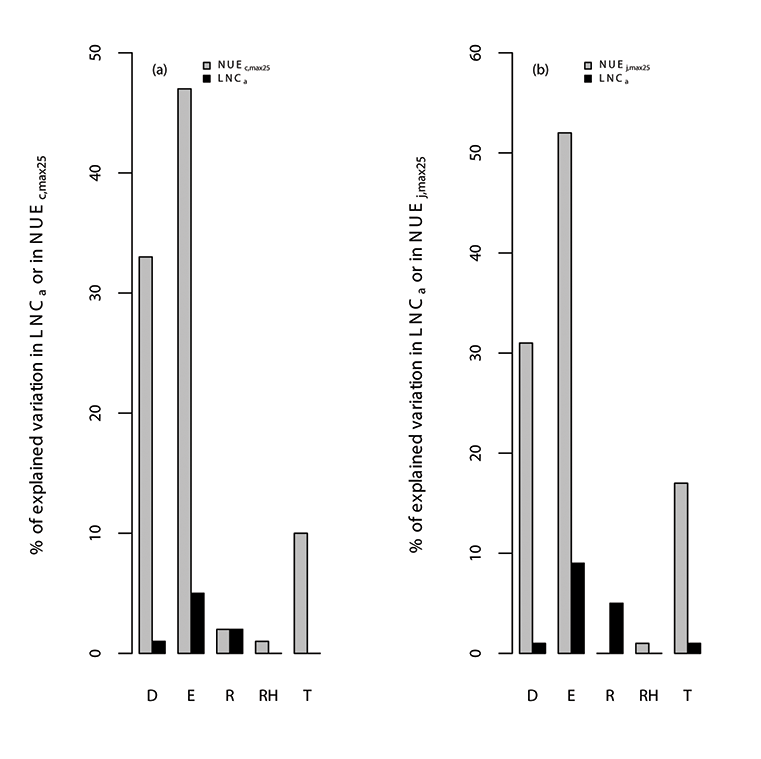
Fig. A10. Percentage of variations in (a) photosynthetic nitrogen use efficiency of Vc,max25 (NUEc,max25; µmol CO2 g-1N s-1), leaf nitrogen content (LNCa; gN m-2) and (b) photosynthetic nitrogen use efficiency of Jmax25 (NUEj,max25; µmol electron g-1N s-1) explained by all of the environmental variables (E), where the specific environmental variables include day length (D; hours), daytime radiation (R; W/m²), temperature (T; °C), and relative humidity (RH; unitless). We used TRF1 as the temperature response function.
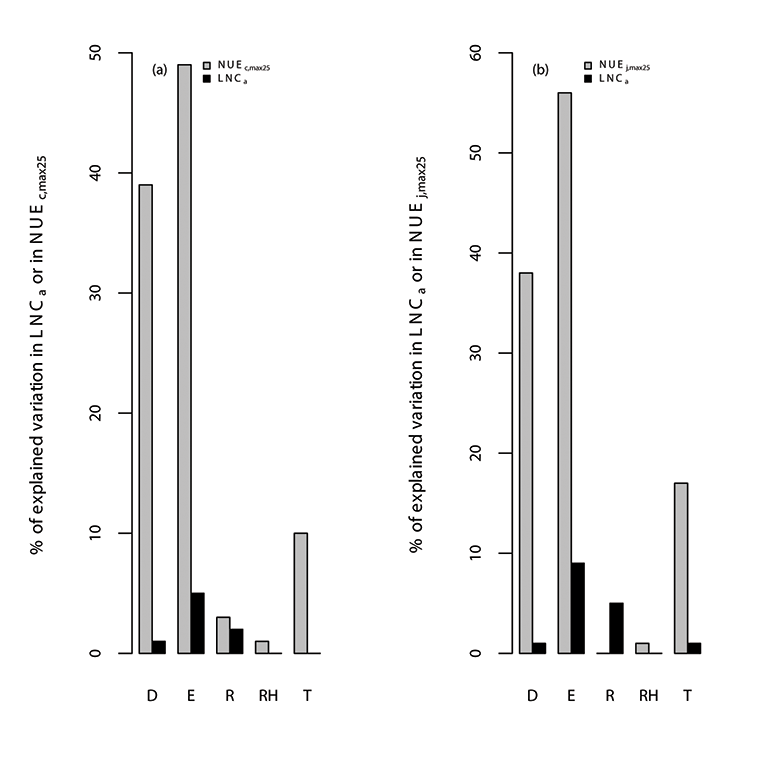
Fig. A11. Percentage of variations in (a) photosynthetic nitrogen use efficiency of Vc,max25 (NUEc,max25; µmol CO2 g-1N s-1), leaf nitrogen content (LNCa; gN m-2) and (b) photosynthetic nitrogen use efficiency of Jmax25 (NUEj,max25; µmol electron g-1N s-1) explained by all of the environmental variables (E), where the specific environmental variables include day length (D; hours), daytime radiation (R; W/m²), temperature (T; °C), and relative humidity (RH; unitless). We used TRF2 as the temperature response function.
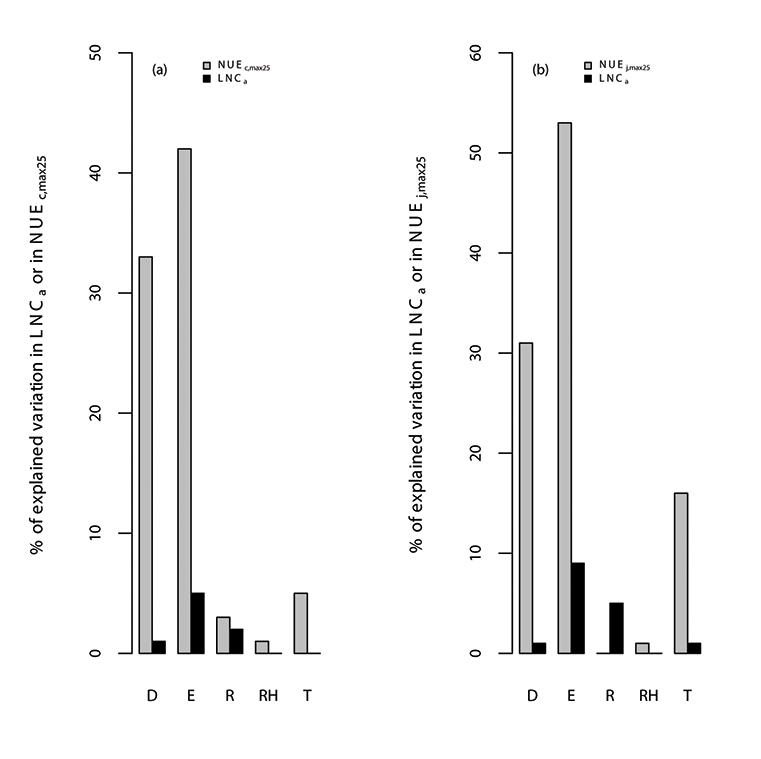
Fig. A12. Percentage of variations in (a) photosynthetic nitrogen use efficiency of Vc,max25 (NUEc,max25; µmol CO2 g-1N s-1), leaf nitrogen content (LNCa; gN m-2) and (b) photosynthetic nitrogen use efficiency of Jmax25 (NUEj,max25; µmol electron g-1N s-1) explained by all of the environmental variables (E), where the specific environmental variables include day length (D; hours), daytime radiation (R; W/m²), temperature (T; °C), and relative humidity (RH; unitless). We used TRF3 as the temperature response function.
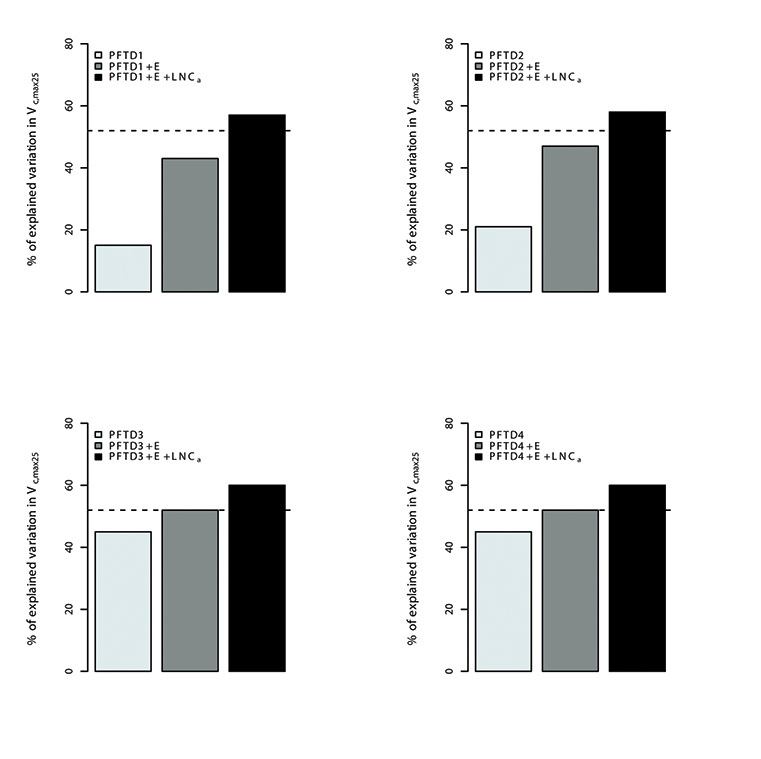
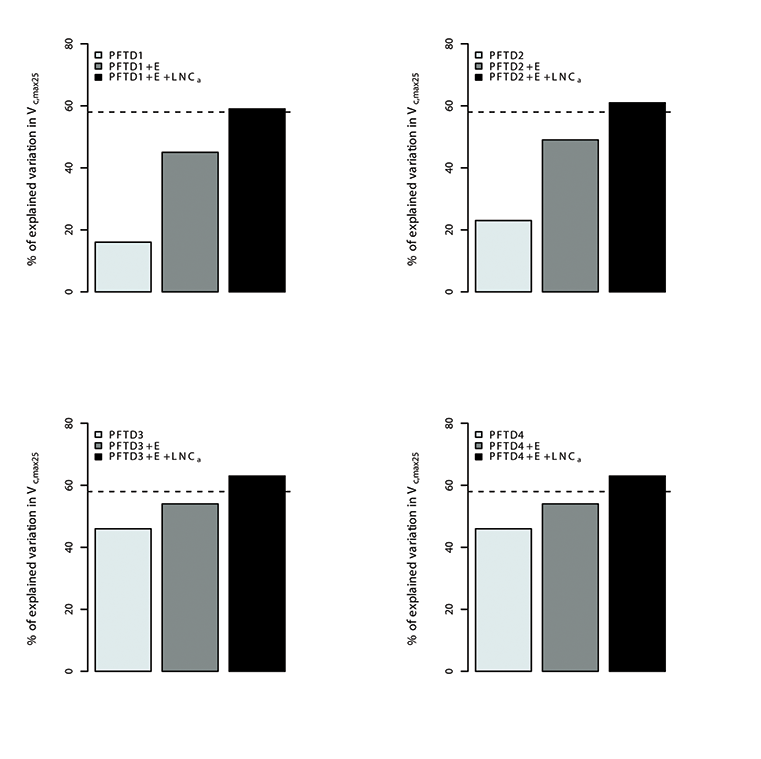
Fig. A13. Percentage of variations in Vc,max25 explained by different plant functional types (PFT), environmental variables (E) and leaf nitrogen content (LNCa). Species were grouped in 4 different combination of plant functional types (PFTs) by using the growth form (herbaceous, shrubs and trees), leaf form (needleleaf and broadleaf), leaf status (evergreen and deciduous), region (tropical, temperate, boreal and artic) and soil type (oxisol or non-oxisol). PFT definition 1 (PFTD1) consisted of growth form only (total of 3 PFTs), PFT definition 2 (PFTD2) included growth form, leaf form and leaf status (total of 9 PFTs), PFT definition 3 (PFTD3) comprised of growth form, leaf form, leaf status and region (total of 19 PFTs), and PFT definition 4 (PFTD4) comprised of growth form, leaf form, leaf status, region and soil type (total of 21 PFTs).The dashed line indicates the amount (57%) of the variation in Vc,max25 explained by environmental variables and LNCa. We used TRF1 as the temperature response function.
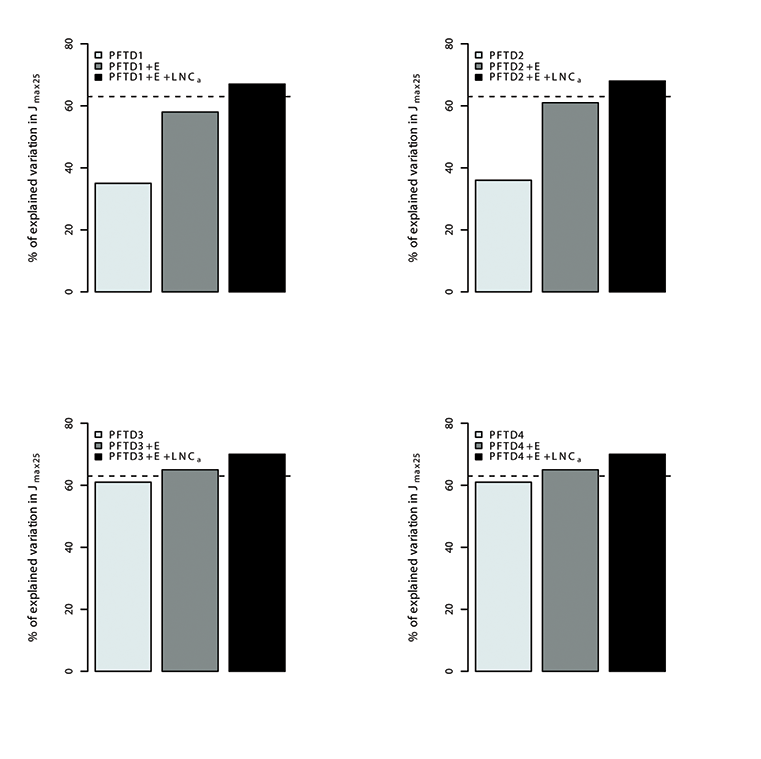
Fig. A14. Percentage of variations in Jmax25 explained by different plant functional types (PFT), environmental variables (E) and leaf nitrogen content (LNCa). Species were grouped in 4 different combination of plant functional types (PFTs) by using the growth form (herbaceous, shrubs and trees), leaf form (needleleaf and broadleaf), leaf status (evergreen and deciduous), region (tropical, temperate, boreal and artic) and soil type (oxisol or non-oxisol). PFT definition 1 (PFTD1) consisted of growth form only (total of 3 PFTs), PFT definition 2 (PFTD2) included growth form, leaf form and leaf status (total of 9 PFTs), PFT definition 3 (PFTD3) comprised of growth form, leaf form, leaf status and region (total of 19 PFTs), and PFT definition 4 (PFTD4) comprised of growth form, leaf form, leaf status, region and soil type (total of 21 PFTs).The dashed line indicates the amount (68.5%) of the variation in Vc,max25 explained by environmental variables and LNCa. We used TRF1 as the temperature response function.
Fig. A15. Percentage of variations in Vc,max25 explained by different plant functional types (PFT), environmental variables (E) and leaf nitrogen content (LNCa). Species were grouped in 4 different combination of plant functional types (PFTs) by using the growth form (herbaceous, shrubs and trees), leaf form (needleleaf and broadleaf), leaf status (evergreen and deciduous), region (tropical, temperate, boreal and artic) and soil type (oxisol or non-oxisol). PFT definition 1 (PFTD1) consisted of growth form only (total of 3 PFTs), PFT definition 2 (PFTD2) included growth form, leaf form and leaf status (total of 9 PFTs), PFT definition 3 (PFTD3) comprised of growth form, leaf form, leaf status and region (total of 19 PFTs), and PFT definition 4 (PFTD4) comprised of growth form, leaf form, leaf status, region and soil type (total of 21 PFTs).The dashed line indicates the amount (57.5%) of the variation in Vc,max25 explained by environmental variables and LNCa. We used TRF2 as the temperature response function.
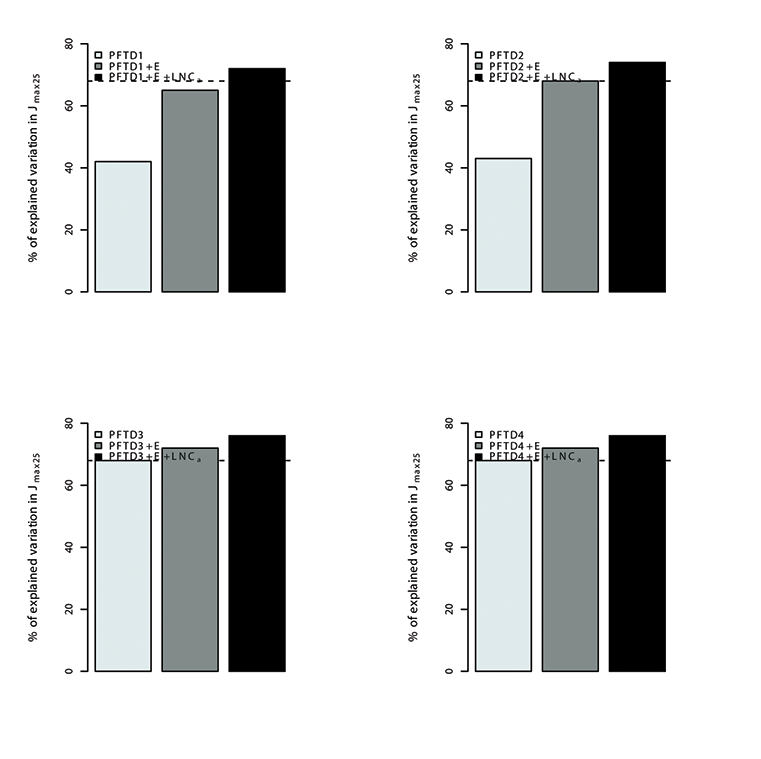
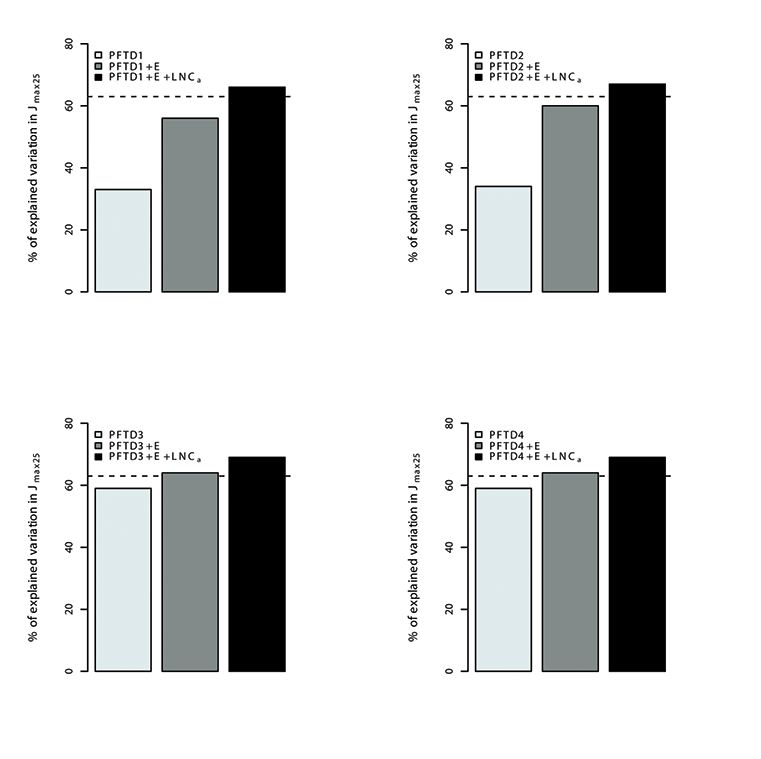
Fig. A16. Percentage of variations in Jmax25 explained by different plant functional types (PFT), environmental variables (E) and leaf nitrogen content (LNCa). Species were grouped in 4 different combination of plant functional types (PFTs) by using the growth form (herbaceous, shrubs and trees), leaf form (needleleaf and broadleaf), leaf status (evergreen and deciduous), region (tropical, temperate, boreal and artic) and soil type (oxisol or non-oxisol). PFT definition 1 (PFTD1) consisted of growth form only (total of 3 PFTs), PFT definition 2 (PFTD2) included growth form, leaf form and leaf status (total of 9 PFTs), PFT definition 3 (PFTD3) comprised of growth form, leaf form, leaf status and region (total of 19 PFTs), and PFT definition 4 (PFTD4) comprised of growth form, leaf form, leaf status, region and soil type (total of 21 PFTs).The dashed line indicates the amount (69%) of the variation in Vc,max25 explained by environmental variables and LNCa. We used TRF2 as the temperature response function.
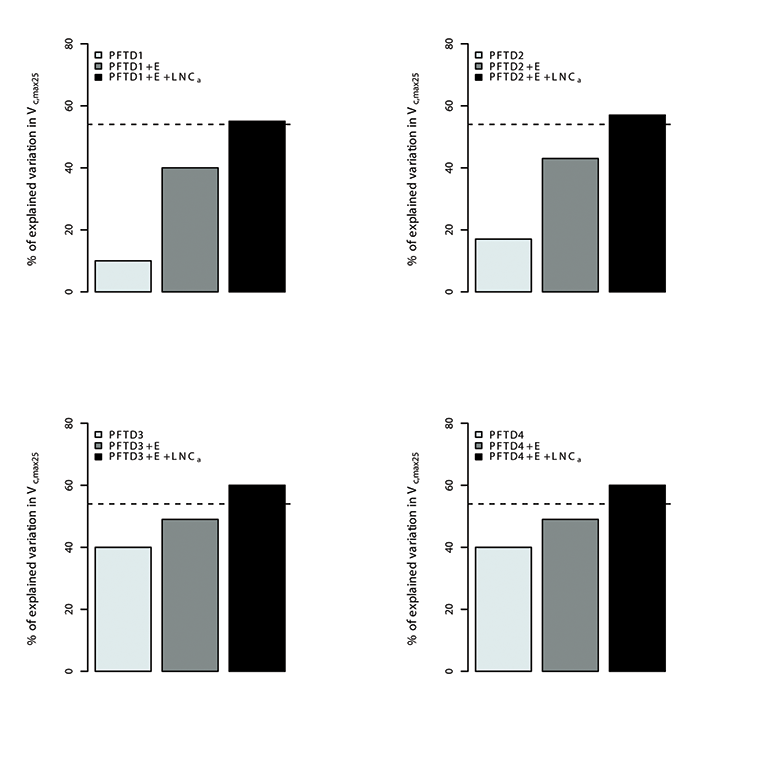
Fig. A17. Percentage of variations in Vc,max25 explained by different plant functional types (PFT), environmental variables (E) and leaf nitrogen content (LNCa). Species were grouped in 4 different combination of plant functional types (PFTs) by using the growth form (herbaceous, shrubs and trees), leaf form (needleleaf and broadleaf), leaf status (evergreen and deciduous), region (tropical, temperate, boreal and artic) and soil type (oxisol or non-oxisol). PFT definition 1 (PFTD1) consisted of growth form only (total of 3 PFTs), PFT definition 2 (PFTD2) included growth form, leaf form and leaf status (total of 9 PFTs), PFT definition 3 (PFTD3) comprised of growth form, leaf form, leaf status and region (total of 19 PFTs), and PFT definition 4 (PFTD4) comprised of growth form, leaf form, leaf status, region and soil type (total of 21 PFTs).The dashed line indicates the amount (52%) of the variation in Vc,max25 explained by environmental variables and LNCa. We used TRF3 as the temperature response function.
Fig. A18. Percentage of variations in Jmax25 explained by different plant functional types (PFT), environmental variables (E) and leaf nitrogen content (LNCa). Species were grouped in 4 different combination of plant functional types (PFTs) by using the growth form (herbaceous, shrubs and trees), leaf form (needleleaf and broadleaf), leaf status (evergreen and deciduous), region (tropical, temperate, boreal and artic) and soil type (oxisol or non-oxisol). PFT definition 1 (PFTD1) consisted of growth form only (total of 3 PFTs), PFT definition 2 (PFTD2) included growth form, leaf form and leaf status (total of 9 PFTs), PFT definition 3 (PFTD3) comprised of growth form, leaf form, leaf status and region (total of 19 PFTs), and PFT definition 4 (PFTD4) comprised of growth form, leaf form, leaf status, region and soil type (total of 21 PFTs).The dashed line indicates the amount (56%) of the variation in Vc,max25 explained by environmental variables and LNCa. We used TRF3 as the temperature response function.
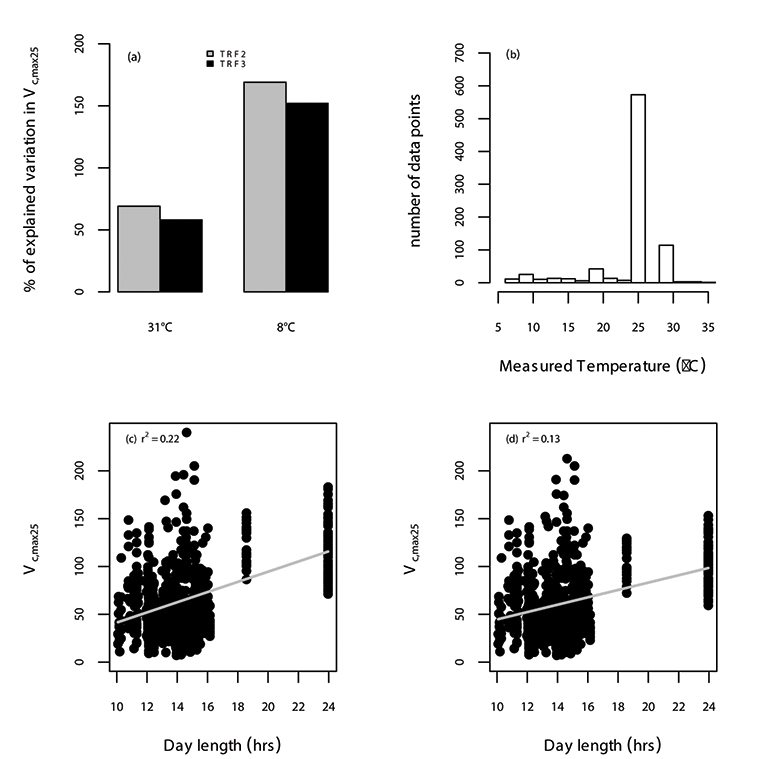
Fig. A19. Relationship between Vc,max25 (µmol CO2 m-2 s-1) and temperature (°C) (a) sing two temperature response functions; without temperature acclimation (TRF2; green) and with temperature acclimation (TRF3; blue) at two different growth temperatures; 8°C and 31°C, and the frequency distribution of the measured temperature (b) for our data set is shown. The relationship between Vc,max25 and day length, and the amount of explained variation in Vc,max25 by day length (r2) using TRF2 (c) and TRF3 (d) are also shown. The data points correspond to an individual leaf.
Literature cited