Ecological Archives A025-143-A2
Iain M. McNicol, Casey M. Ryan, and Mathew Williams. 2015. How resilient are African woodlands to disturbance from shifting cultivation? Ecological Applications 25:23202336. http://dx.doi.org/10.1890/14-2165.1
Appendix B. Supporting information for the analysis and interpretation of changes in community composition.
Table B1. (a –b) The unshaded cells show the mean (± SD) species similarity (1 – Bray Curtis) between plot-pairs from groups of plots of similar age. The shaded cells summarise the results of the PerMANOVA test for significant pairwise differences in composition between age classes, with an additional comparison (c) which shows compositional differences between equivalent age classes on different soil. PerMANOVA is a permutation-based version of the multivariate analysis of variance and uses randomizations or permutations of the data to produce the p value for the hypothesis test. Shown are the p values derived from the pairwise comparisons between age classes. Significant differences in species composition between groups of plots are highlighted in bold. P = * <0.05, ** <0.01, ***<0.001. The results suggest that convergence in composition occurs after 20 – 40 years on both soil types, despite few plots in these age classes, particularly on clay soils, exhibiting a strong similarity to mature woodlands, thus highlighting the different conclusions which can be drawn when using an ANOVA type approach to study successional trends.
(a) Sandy plots |
|||||||
Age class |
0 - 10 (7) |
11 – 20 (6) |
21 – 30 (5) |
31 - 40 (6) |
Mature (11) |
||
0 - 10 |
---- |
0.15 (0.15) |
0.10 (0.10) |
0.11 (0.11) |
0.11 (0.10) |
||
11 - 20 |
0.14 |
---- |
0.21 (0.11) |
0.27 (0.10) |
0.22 (0.09) |
||
21 - 30 |
0.14 |
0.19 |
---- |
0.24 (0.10) |
0.20 (0.08) |
||
31 - 40 |
0.001** |
0.02* |
0.21 |
---- |
0.27 (0.09) |
||
Mature |
0.003** |
0.03* |
0.35 |
0.33 |
---- |
||
(b) Clay plots |
(c) Sandy vs. Clay |
||||||
Age class |
0 – 10 (7) |
11 – 20 (6) |
21 – 40 (4) |
Mature (4) |
|
|
|
0 - 10 |
---- |
0.14 (0.07) |
0.17 (0.10) |
0.11 (0.06) |
|
<0.001*** |
|
11 - 20 |
0.02* |
---- |
0.16 (0.12) |
0.17 (0.13) |
|
0.002** |
|
21 - 40 |
0.12 |
0.36 |
---- |
0.24 (0.13) |
|
0.001** |
|
Mature |
0.004** |
0.04* |
0.44 |
----- |
|
0.001** |
|
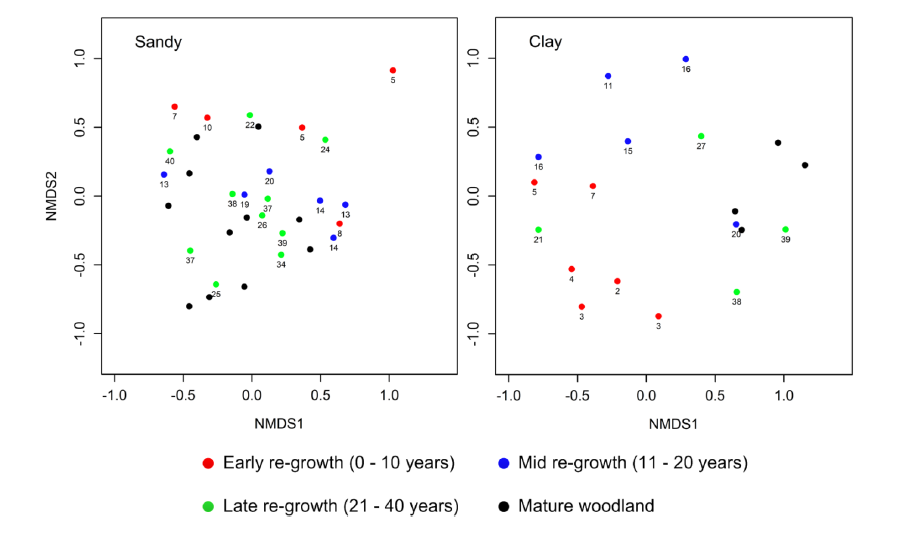
Fig. B1. Plot-pair differences in species composition based on the Bray-Curtis Dissimiliarity Index with differences in site age.
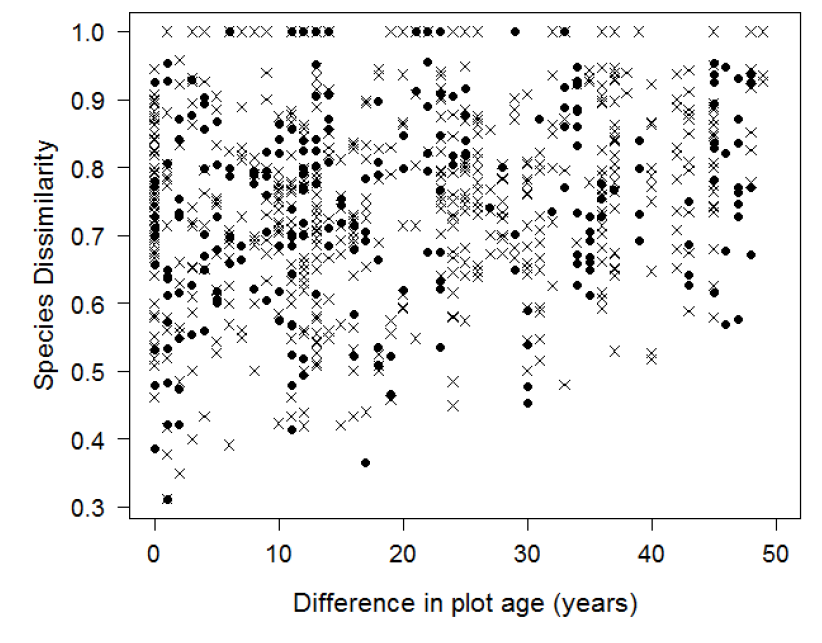
Fig. B2. NMDS plot based on Bray-Curtis distances among the plots sampled on both soil classes. Plots are grouped in to age classes purely to aid interpretation. Plot age is located directly below each point. Composition is shown to differ among similarly aged plots, however some general trends can be observed with the younger sites generally mapping our differently from the older plots, with regrowth plots beginning to converge with those in mature woodlands as recovery proceeds. On sandy soils, two early re-growth plots (LiwitiR1 & MchakamaR2) that contained only remnant trees are not shown.