Ecological Archives A025-137-A2
Denise M. Finney, Sara E. Eckert, and Jason P. Kaye. 2015. Drivers of nitrogen dynamics in ecologically based agriculture revealed by long-term, high-frequency field measurements. Ecological Applications 25:22102227. http://dx.doi.org/10.1890/14-1357.1
Appendix B. Supplementary results: fortnightly soil inorganic nitrogen as nitrate and ammonium concentration measured in four organic feed grain and cropping systems in central Pennsylvania.
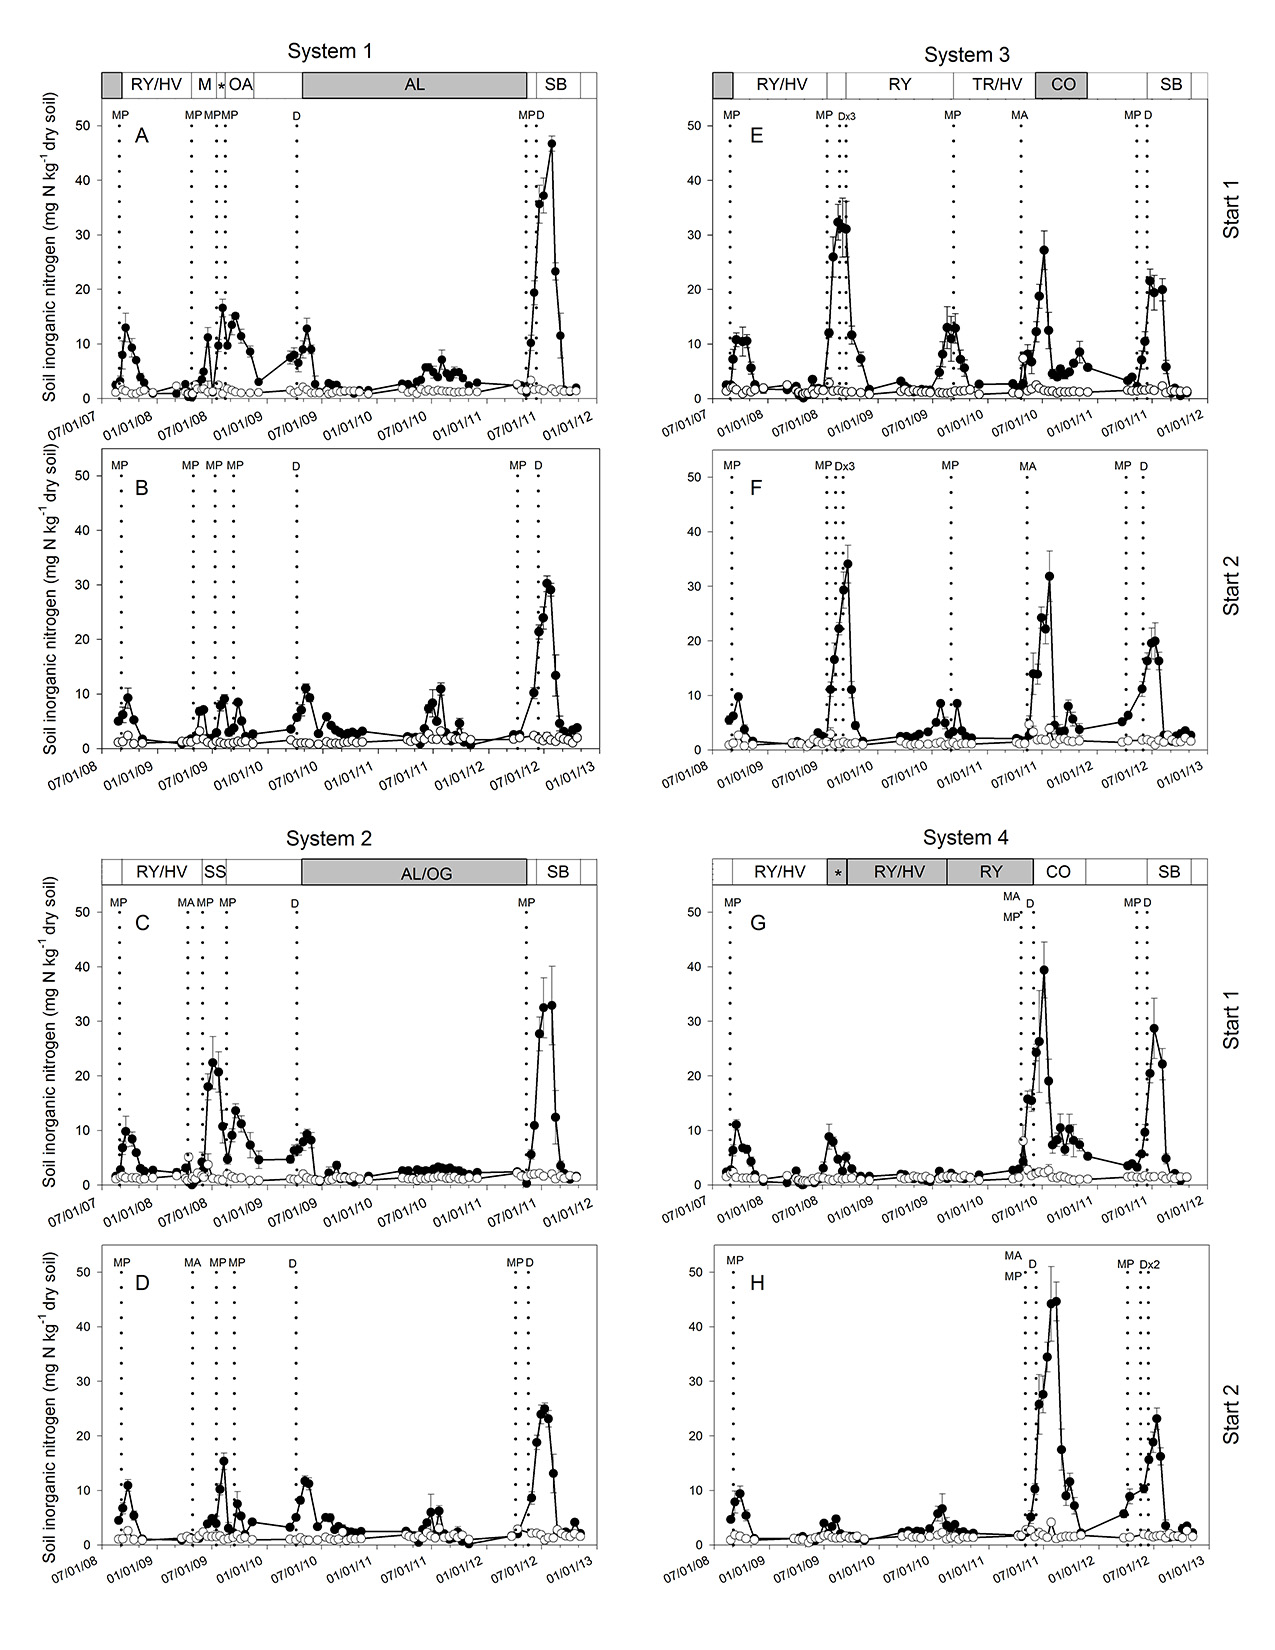
Fig. B1. Soil nitrate (closed circles) and ammonium (open circles) concentrations sampled bi-weekly in four forage organic cropping systems at Rock Springs, PA. Panel A: system 1, start 1; Panel B: system 1, start 2; Panel C: system 2, start 1; Panel D: system 2, start 2; Panel E: system 3, start 1; Panel F: system 3, start 2; Panel G: system 4, start 1; Panel H: system 4, start 2. Dotted vertical lines show key management operations (MP = moldboard plowing; D = other soil disturbance; MA = manure application). Upper strips indicate the crop sequence followed in each system, with minimum tilled crops shaded (RY/HV = rye/hairy vetch biculture; M = mustard; * = buckwheat; OA = oats; AL = alfalfa; AL/OG = alfalfa/orchardgrass biculture; SS = sudangrass; RY = rye; TR/HV = triticale/hairy vetch biculture; CO = corn; SB = soybean; blank = fallow). Error bars represent + one standard error of the mean. Compare to Fig. 1 in the main text.