Ecological Archives A025-131-A4
Karel Mokany, Joshua J. Thomson, A. Jasmyn J. Lynch, Gregory J. Jordan, and Simon Ferrier. 2015. Linking changes in community composition and function under climate change. Ecological Applications 25:21322141. http://dx.doi.org/10.1890/14-2384.1
Appendix D. Response functions for models of community mean trait values.
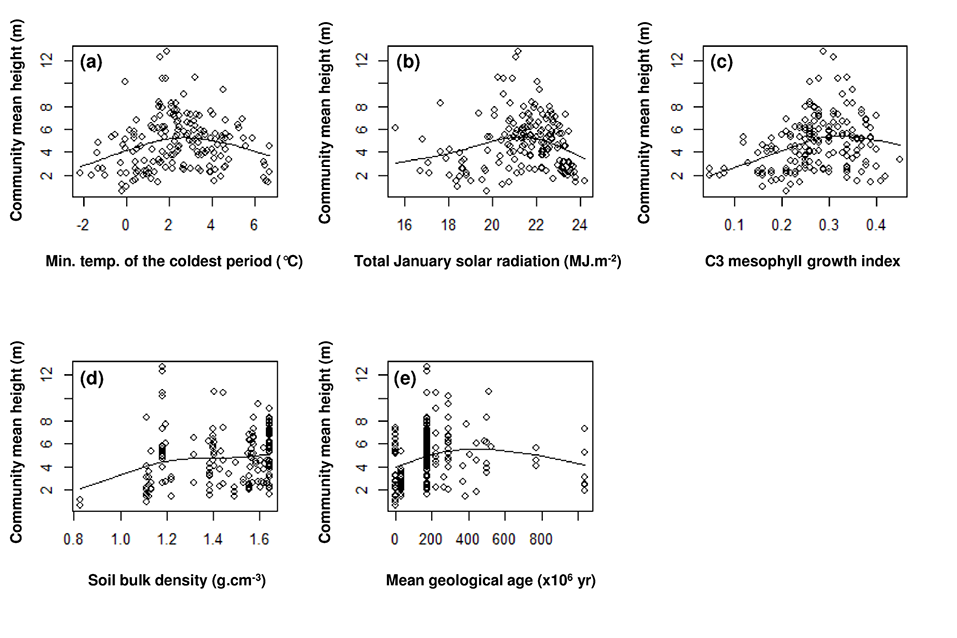
Fig. D1. Community mean height model response functions for each of the five explanatory variables (a – e). The line shows the fitted relationship in the model when all other variables are at their average values, while observed data for the 175 community sample grid cells are shown by the open circles.
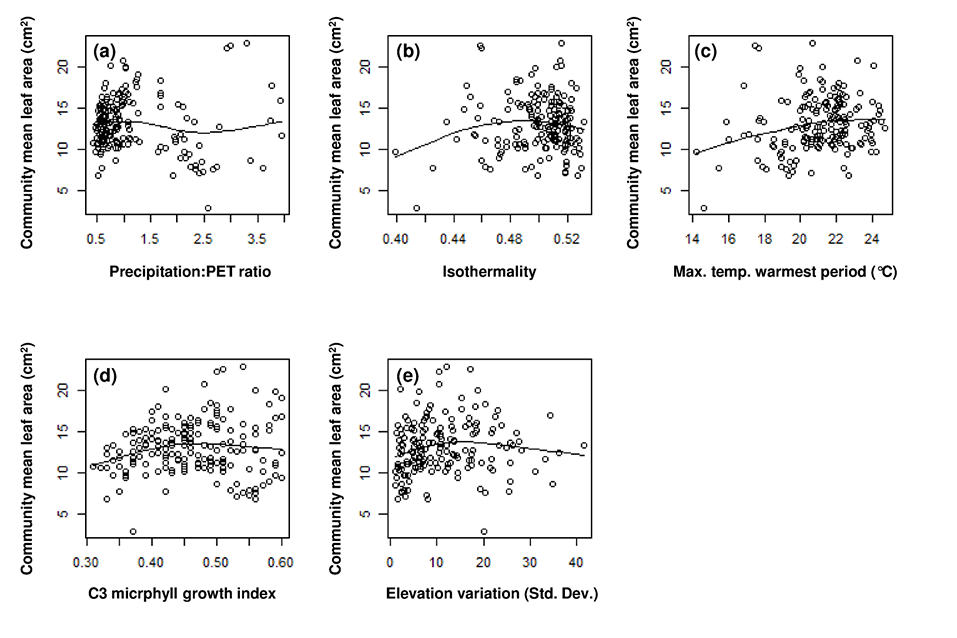
Fig. D2. Community mean leaf area model response functions for each of the five explanatory variables (a – e). The line shows the fitted relationship in the model when all other variables are at their average values, while observed data for the 175 community sample grid cells are shown by the open circles.
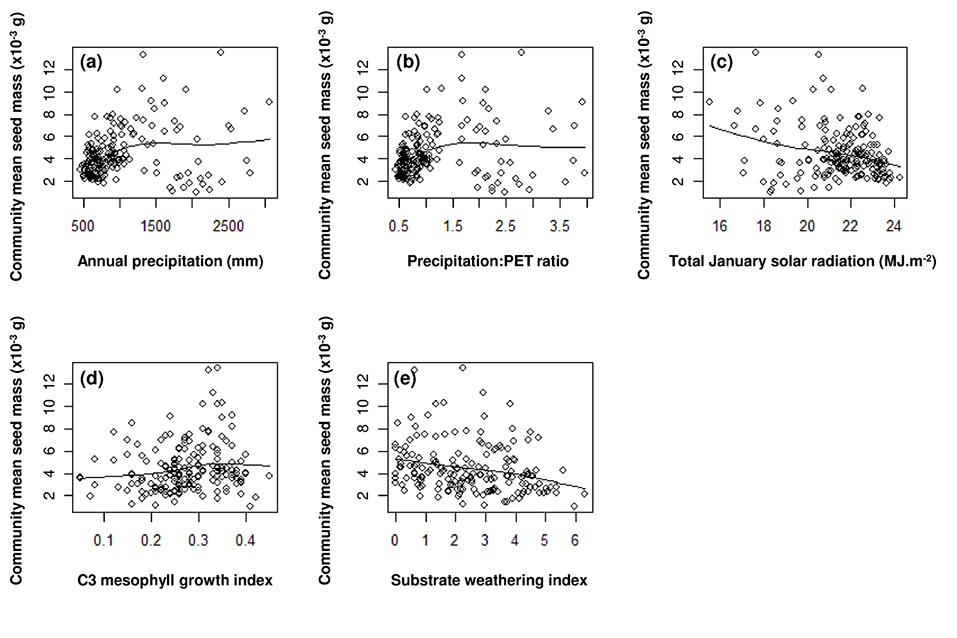
Fig. D3. Community mean seed mass model response functions for each of the five explanatory variables (a – e). The line shows the fitted relationship in the model when all other variables are at their average values, while observed data for the 175 community sample grid cells are shown by the open circles.