Ecological Archives A025-131-A3
Karel Mokany, Joshua J. Thomson, A. Jasmyn J. Lynch, Gregory J. Jordan, and Simon Ferrier. 2015. Linking changes in community composition and function under climate change. Ecological Applications 25:21322141. http://dx.doi.org/10.1890/14-2384.1
Appendix C. Comparison of mean trait values using recorded and interpolated traits.
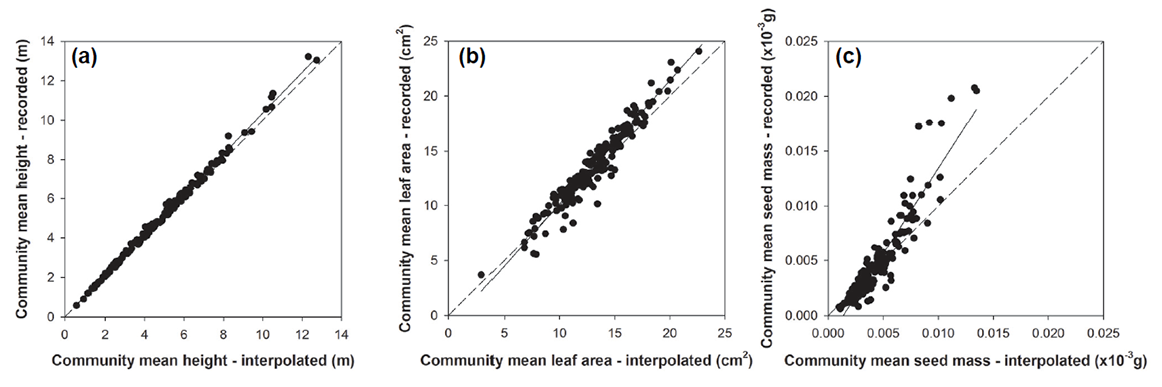
Fig. C1. Relationship between community mean trait values derived using only species for which trait data were available (‘recorded’) and those that included interpolated traits for species with no trait information (‘interpolated’), for: (a) plant height; (b) leaf area, and; (c) seed mass. The dashed line in each panel shows the 1:1 relationship, while the solid line is a simple linear regression ((a) r² = 0.996, slope = 1.034; (b) r² = 0.935, slope = 1.128; (c) r² = 0.865, slope = 1.557).