Ecological Archives A025-131-A2
Karel Mokany, Joshua J. Thomson, A. Jasmyn J. Lynch, Gregory J. Jordan, and Simon Ferrier. 2015. Linking changes in community composition and function under climate change. Ecological Applications 25:21322141. http://dx.doi.org/10.1890/14-2384.1
Appendix B. Description of environmental variables applied in modeling traits and composition.
Table B1. Description of environmental variables applied in modeling Tasmanian plant community mean trait values and compositional turnover, with possible mechanistic justifications for the inclusion of each variable documented.
Variable |
Units |
Description |
Mechanistic links |
Annual precipitation |
mm |
Total annual precipitation |
Moisture is a key resource for plants and an important gradient along which species functional adaptations occur. |
Precipitation:PET ratio |
|
Total annual precipitation divided by total annual potential evapotranspiration (PET) |
As above. Dividing precipitation by PET provides an index over overall water availability. Accounting for variation in evaporative demand. |
Minimum temperature coldest period |
°C |
The lowest temperature of any weekly minimum temperature. |
Functional adaptations to withstand thermal minima likely to be important in influencing species persistence. |
Maximum temperature warmest period |
°C |
The highest temperature of any weekly maximum temperature |
Capacity to withstand high temperature extremes through physiological adaptations. |
Temperature isothermality |
|
The mean diurnal range divided by the annual temperature range |
Plant species with different functional attributes will vary in the degree to which they are able to cope with and perform physiologically under regular fluctuations in temperature. |
January solar radiation |
MJ.m-2 |
The mean daily solar radiation experienced in January |
Radiation load influences potential for plant growth and potential moisture stress. |
C3 mesophyll plant growth index |
|
Yearly mean growth index (range 0 to 1) from simple plant growth model for C3 mesophyll plant type using data on temperature, precipitation, evaporation and radiation across a year. |
Potential plant growth indicates likely forces driving trait selection (competition at high growth, stress tolerance at low growth). Given the simplicity of this growth index which is based on climate constraints, there is limited risk of circularity in applying it to explain variation in plant composition and mean trait values. |
C3 microphyll plant growth index |
|
Yearly mean growth index (range 0 to 1) from simple plant growth model for C3 microophyll plant type using data on temperature, precipitation, evaporation and radiation across a year. |
Potential plant growth indicates likely forces driving trait selection (competition at high growth, stress tolerance at low growth). Given the simplicity of this growth index which is based on climate constraints, there is limited risk of circularity in applying it to explain variation in plant composition and mean trait values. |
Soil bulk density |
g.cm-3 |
|
A key soil attribute influencing plant structure as well as soil water holding capacity, with links to other soil variables such as nutrient status. |
Mean geological age |
×106 yr |
The average age of the geological strata within each grid cell |
Likely correlation between age of bedrock material and important soil properties, such as structure, chemistry & fertility. |
Substrate weathering index |
|
The degree to which primary minerals in the substrate are altered to secondary components including clay minerals and oxides |
Likely correlation between degree of substrate weathering and important soil properties, such as structure, chemistry & fertility. |
Elevation variation (SD) |
|
The variation (standard deviation) in elevation within each 250 m grid cell, calculated from a 1 second (~30 m) digital elevation model for Tasmania |
The degree of variation in elevation within a grid cell indicates potential heterogeneity of habitats, and potential for trait specialisation & persistence. |
Geographic distance |
km |
The Euclidean distance between two points |
Neutral metacommunity processes result in higher levels of compositional turnover between communities that are further apart. |
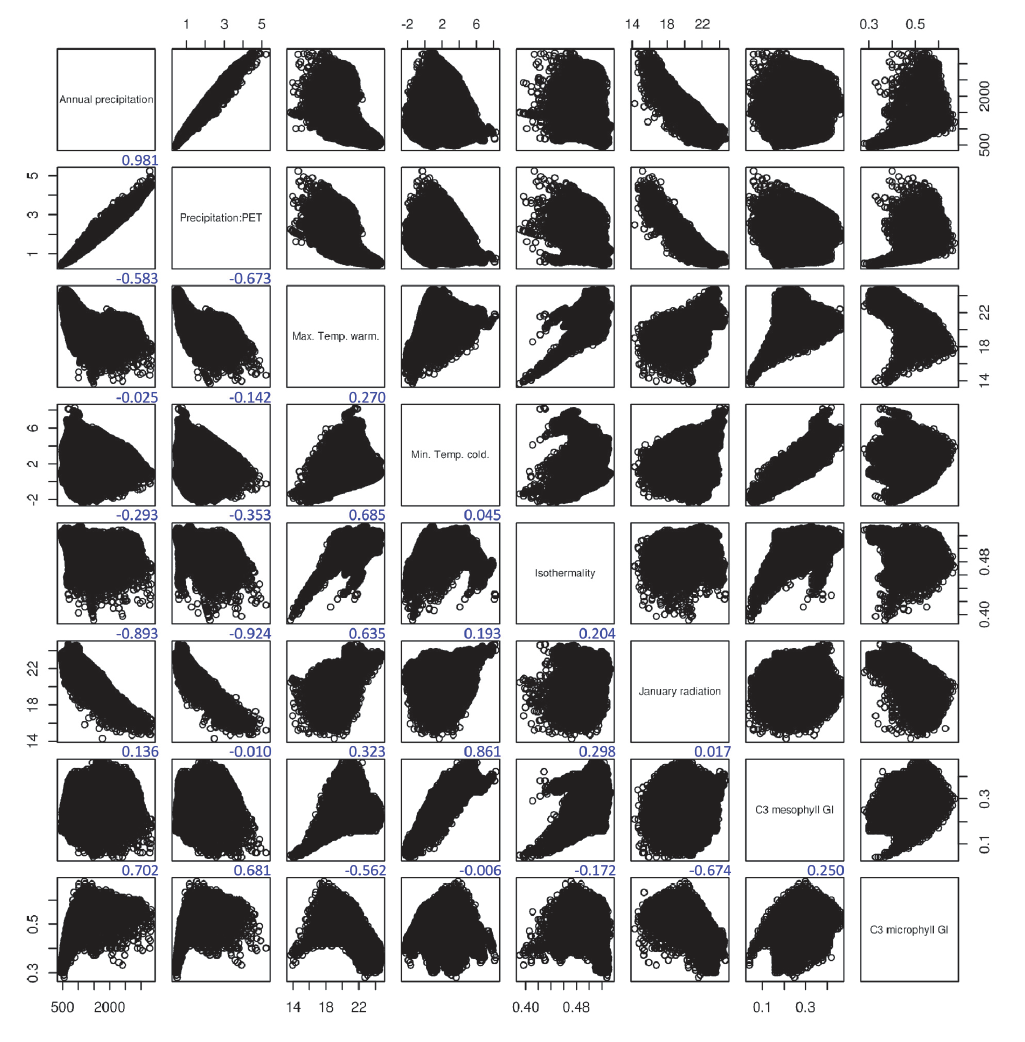
Fig. B1. Correlation matrix for the climate variables applied in modeling Tasmanian plant community mean trait values and compositional turnover. Plots show the relationship between each pair of climate variables for 10,000 randomly chosen grid cells across Tasmania, while the values in blue text above each plot give the Pearson’s correlation coefficient.