Ecological Archives A025-131-A1
Karel Mokany, Joshua J. Thomson, A. Jasmyn J. Lynch, Gregory J. Jordan, and Simon Ferrier. 2015. Linking changes in community composition and function under climate change. Ecological Applications 25:21322141. http://dx.doi.org/10.1890/14-2384.1
Appendix A. Elevation, precipitation, and mean annual temperature across Tasmania.
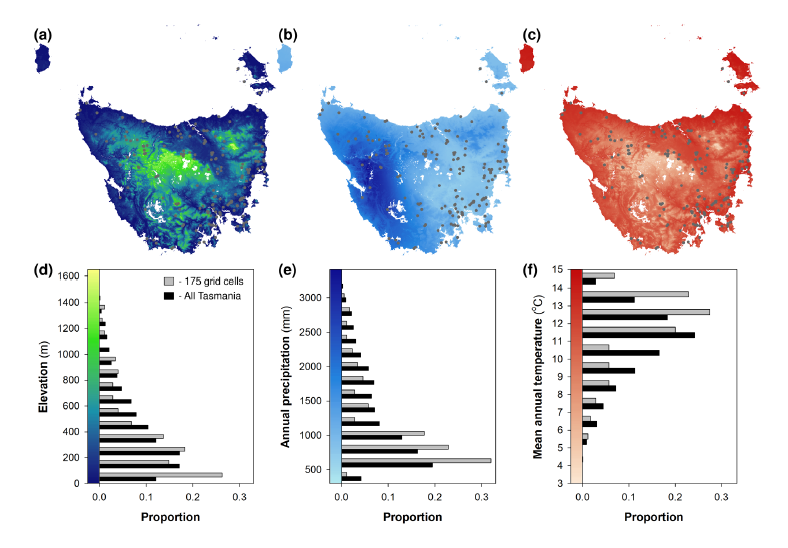
Fig. A1. Elevation (a), annual precipitation (b) and mean annual temperature (c) across Tasmania, Australia. The locations of the 175 grid cells used for generating the models of compositional turnover and community mean trait values are shown as gray circles. The proportion of the 175 grid cells (gray bars) and all grid cells (black bars) within categories of elevation (d), annual precipitation (e) and mean annual temperature (f) are also shown, to indicate the degree to which the 175 grid cells used for modelling are representative of the environmental conditions across all of Tasmania.