Ecological Archives A025-130-A4
Neal M. Williams, Kimiora L. Ward, Nathaniel Pope, Rufus Isaacs, Julianna Wilson, Emily A. May, Jamie Ellis, Jaret Daniels, Akers Pence, Katharina Ullmann, and Jeff Peters. 2015. Native wildflower plantings support wild bee abundance and diversity in agricultural landscapes across the United States. Ecological Applications 25:21192131. http://dx.doi.org/10.1890/14-1748.1
Appendix D. Seasonal patterns of floral area, bee abundance, and bee diversity.
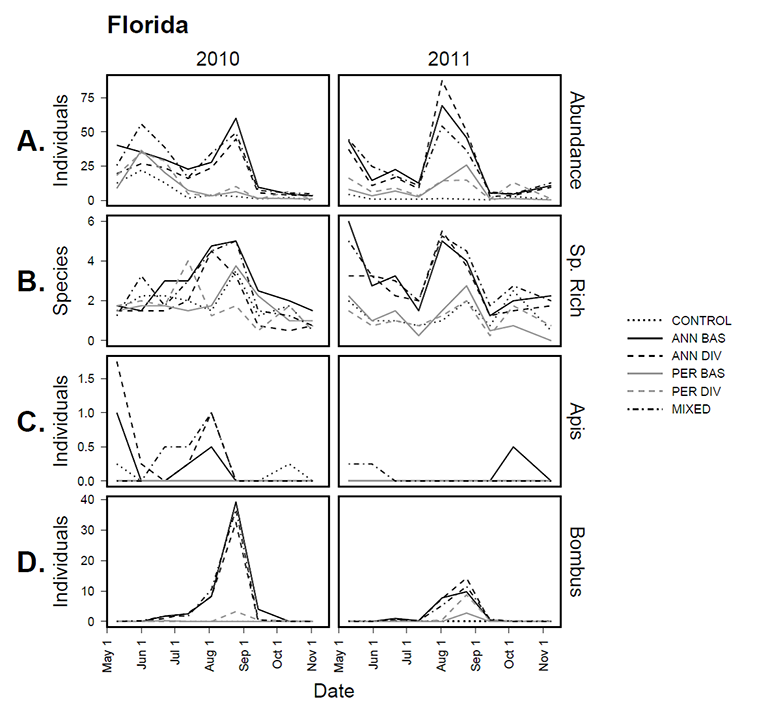
Fig. D1. Florida seasonal data for A. Wild bee abundance, B. Wild bee species richness, C. Apis mellifera abundance, D. Bombus pooled species abundance. Data are averages among three independent sites within each region in each year. Dotted line indicates control, dark lines indicate Annual Mixes, light gray lines indicate Perennial Mixes, dot-dash indicates Annual-Perennial mix. Note differences in scaling of the Y-axis among regions.
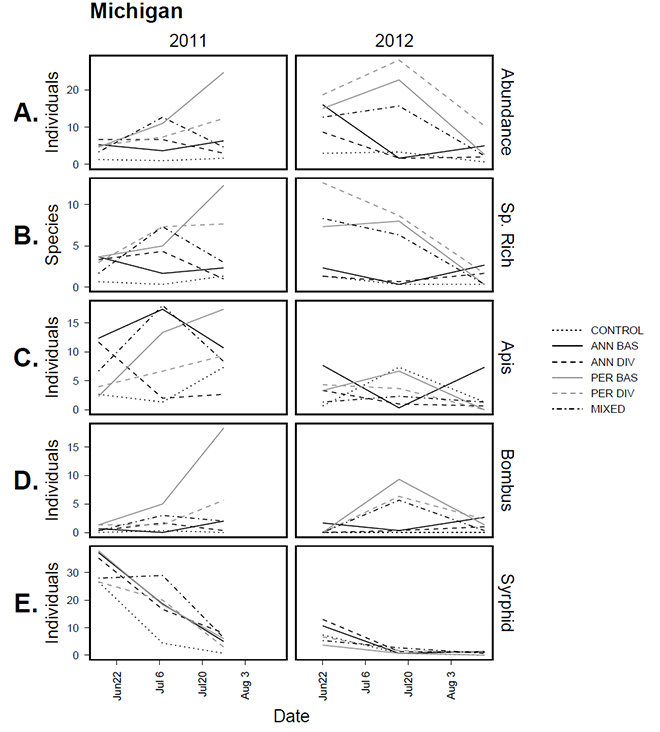
Fig. D2. Michigan seasonal data for A. Wild bee abundance, B. Wild bee species richness, C. Apis mellifera abundance, D. Bombus, E. syrphid fly pooled species abundance. Data are averages among three independent sites within each region. Shaded areas show the range of the data. Dotted line indicates control, dark lines indicate Annual Mixes, light gray lines indicate Perennial Mixes, dot-dash indicates Annual-Perennial mix. Note differences in scaling of the Y-axis among regions.
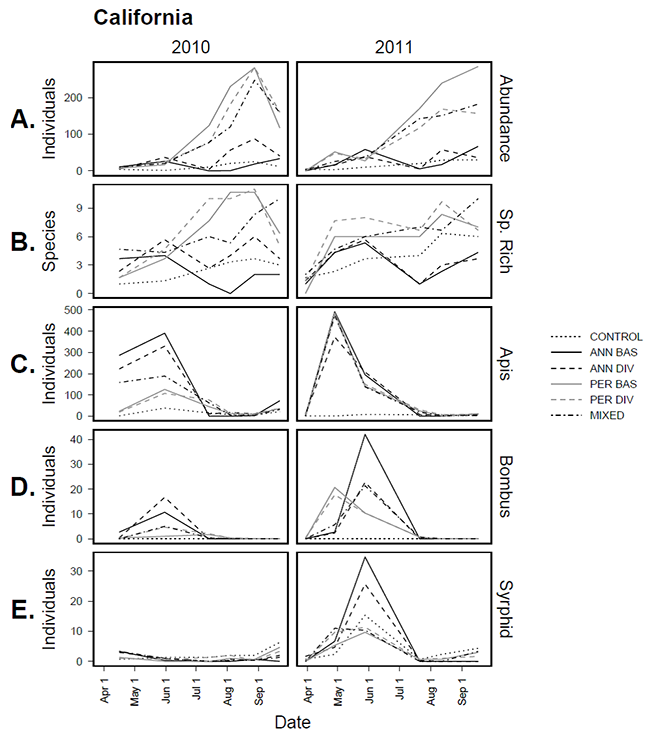
Fig. D3. California seasonal data for A. Wild bee abundance, B. Wild bee species richness, C. Apis mellifera abundance, D. Bombus, E. syrphid flies pooled species abundance. Data are averages among three independent sites within each region. Shaded areas show the range of the data. Dotted line indicates control, dark lines indicate Annual Mixes, light gray lines indicate Perennial Mixes, dot-dash indicates Annual-Perennial mix. Note differences in scaling of the Y-axis among regions.