Ecological Archives A025-128-A2
Patricio N. Magliano, David D. Breshears, Roberto J. Fernández, and Esteban G. Jobbágy. 2015. Rainfall intensity switches ecohydrological runoff/runon redistribution patterns in dryland vegetation patches. Ecological Applications 25:20942100. http://dx.doi.org/10.1890/15-0550.1
Appendix B. Full description of patch attributes including the fourteen biophysical variables measured in the field, and correlation matrix of the 14 biophysical attributes.
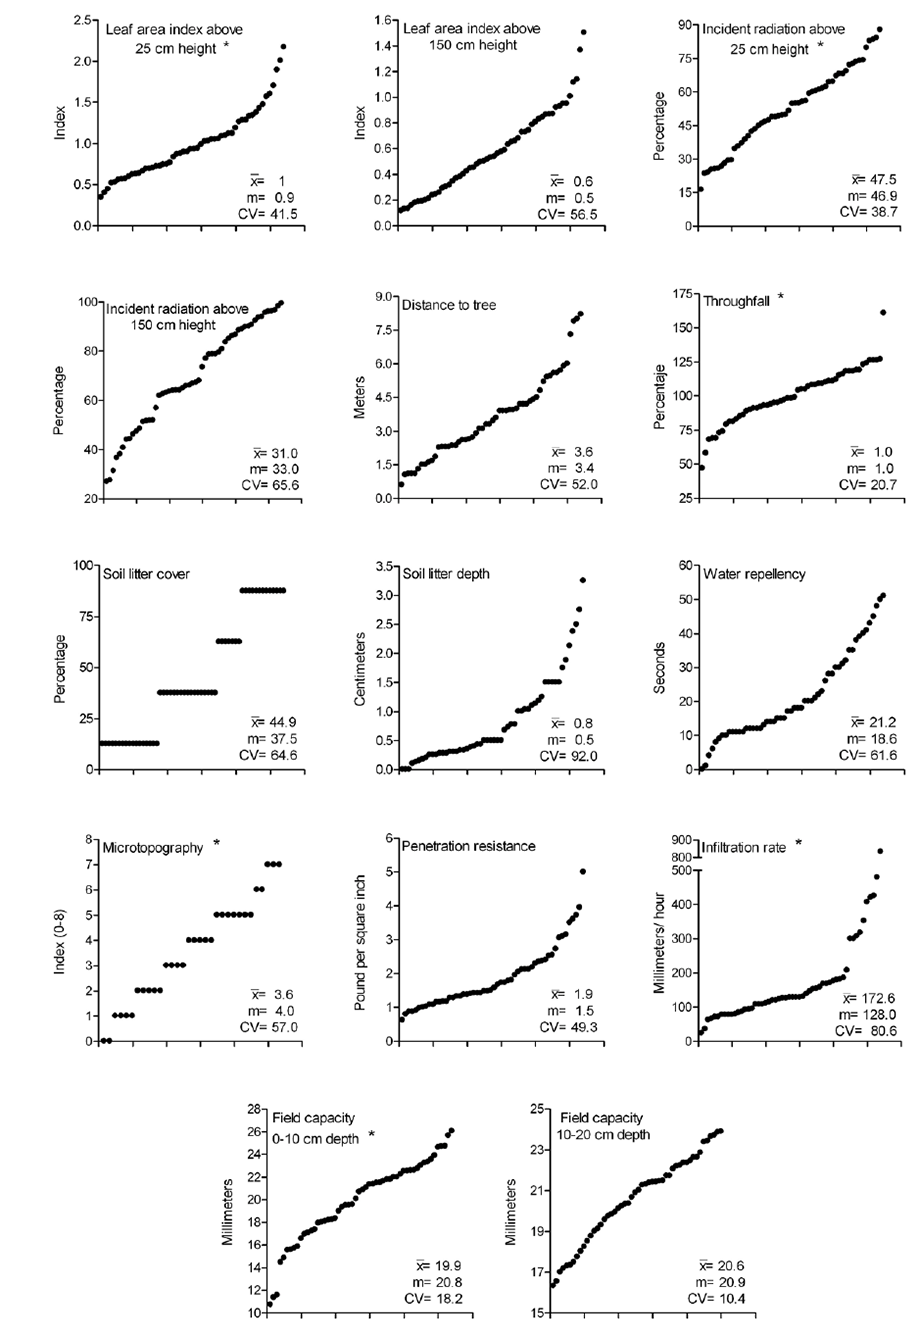
Figure B.1. Frequency distribution of fourteen biophysical attributes of patches, from lowest to highest. Asterisks indicate normal distribution (p<0.05). The three values situated on the lower right corner represent the mean, median and coefficient of variation.
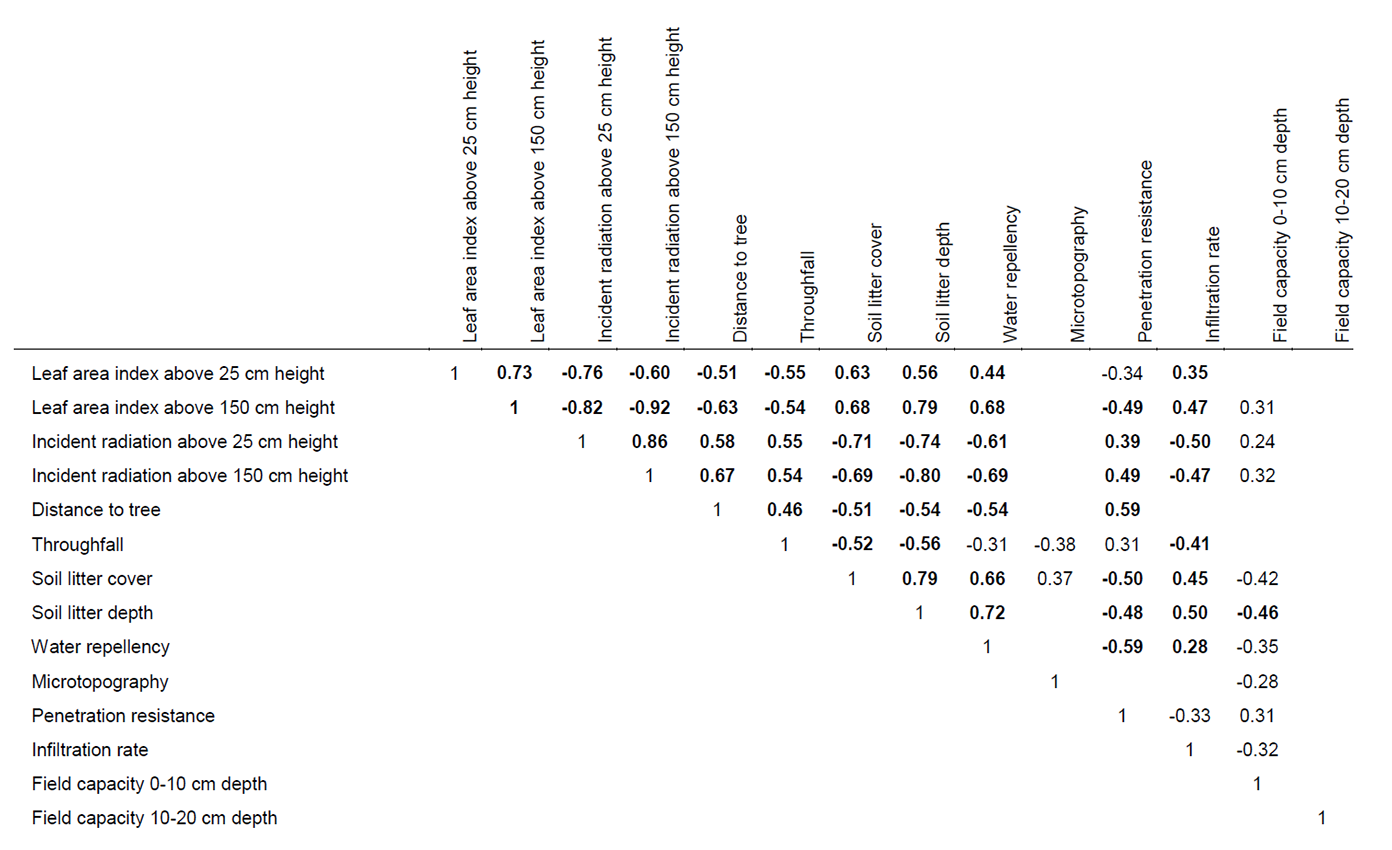
Table B.1. Correlation matrix of the fourteen biophysical attributes. Only significant correlation coefficients are shown (p<0.1; numbers in bold are significant p<0.01).
- Correlation matrix of the fourteen biophysical attributes.