Ecological Archives A025-123-A2
Ashley E. Larsen, Steven D. Gaines, and Olivier Deschênes. 2015. Spatiotemporal variation in the relationship between landscape simplification and insecticide use. Ecological Applications 25:19761983. http://dx.doi.org/10.1890/14-1283.1
Appendix B. Covariate time trends and summary statistics.
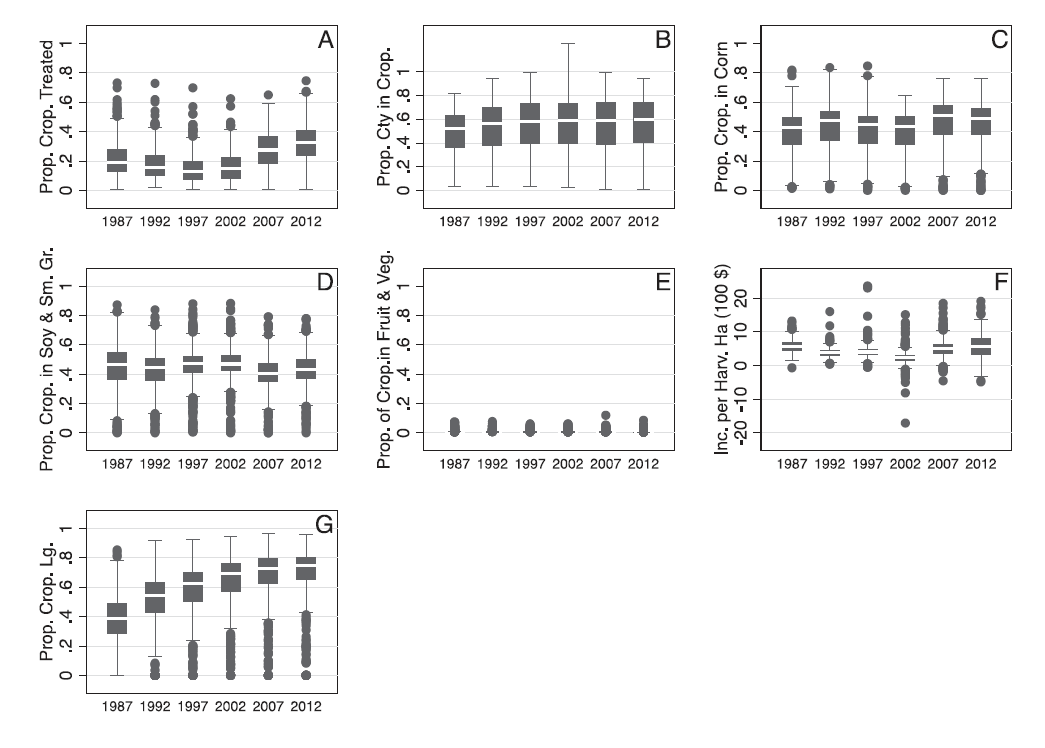
Fig. B1. Proportion of cropland treated with insecticides, proportion of county in cropland and covariates for the Heartland region. All crop variables were similar over the study period, 1987–2012. Other regions displayed similar patterns over time. “Cty” represents “county”.
Table B1. Summary statistics by region, pooling 1987–2012.
Heartland |
N. Crescent |
N. Gr. Plains |
Prairie |
E. Uplands |
S. Seaboard |
Fruitful Rim |
Basin & Range |
Miss. Portal |
|
Prop. Treated |
0.22 (0.13) |
0.19 (0.15) |
0.12 (0.09) |
0.24 (0.18) |
0.11 (0.10) |
0.31 (0.23) |
0.44 (0.28) |
0.20 (0.19) |
0.36 (0.22) |
Prop. Cropland |
0.54 (0.22) |
0.19 (0.18) |
0.32 (0.21) |
0.25 (0.18) |
0.10 (0.08) |
0.11 (0.10) |
0.10 (0.12) |
0.05 (0.08) |
0.25 (0.22) |
Prop. Corn |
0.43 (0.15) |
0.27 (0.15) |
0.12 (0.13) |
0.13 (0.17) |
0.10 (0.10) |
0.13 (0.12) |
0.07 (0.10) |
0.02 (0.05) |
0.11 (0.12) |
Prop Soy. & Sm. Gr |
0.44 (0.13) |
0.16 (0.16) |
0.50 (0.25) |
0.38 (0.26) |
0.09 (0.13) |
0.23 (0.25) |
0.13 (0.19) |
0.20 (0.26) |
0.35 (0.24) |
Prop. Fruit & Veg |
0.00 (0.01) |
0.06 (0.11) |
0.00 (0.00) |
0.02 (0.05) |
0.01 (0.04) |
0.04 (0.07) |
0.21 (0.27) |
0.05 (0.14) |
0.01 (0.04) |
Inc. per harv ha |
451 (252) |
1014 (4799) |
292 (187) |
359 (1519) |
608 (984) |
1191 (2262) |
1765 (4989) |
366 (1599) |
614 (1750) |
Prop. Cotton |
0.00 (0.03) |
0.00 (0.00) |
0.00 (0.00) |
0.08 (0.20) |
0.01 (0.05) |
0.08 (0.15) |
0.05 (0.13) |
0.00 (0.03) |
0.13 (0.16) |
Prop. Large |
0.58 (0.21) |
0.27 (0.22) |
0.78 (0.16) |
0.57 (0.28) |
0.10 (0.16) |
0.29 (0.31) |
0.43 (0.32) |
0.41 (0.32) |
0.58 (0.33) |
N |
3240 |
2368 |
1012 |
2236 |
2326 |
2731 |
1520 |
909 |
963 |
Notes: Proportion of cropland treated with insecticides (Prop. Treated) and proportion of county in cropland (Prop. Cropland) vary greatly between regions, as do other covariates. Cotton growing egions were considered Prairie, Eastern Uplands, Southern Seaboard, Fruitful Rim and Mississippi Portal. Standard errors are below the mean, in parentheses.