Ecological Archives A025-121-A1
Adam S. Smart, Reid Tingley, Andrew R. Weeks, Anthony R. van Rooyen, and Michael A. McCarthy. 2015. Environmental DNA sampling is more sensitive than a traditional survey technique for detecting an aquatic invader. Ecological Applications 25:19441952. http://dx.doi.org/10.1890/14-1751.1
Appendix A. A table showing raw detection probabilities of L. v. vulgaris using trapping and environmental DNA surveys across seven sites in Melbourne, Australia; a figure showing mean and 95% credible intervals of the random effects for site, month and day within month, for trapping and environmental DNA methods; and a figure showing mean and 95% credible intervals for regression coefficients describing effects of water depth, rainfall, and temperature on detection probabilities of L. v. vulgaris using traps and environmental DNA sampling.
Table A1. Raw detection probabilities of L. v. vulgaris using trapping and environmental DNA surveys across seven sites in Melbourne, Australia. eDNA estimates are shown for four qPCR thresholds (1/4, 2/4, 3/4 or 4/4 qPCRs had to test positive for the presence of L. v. vulgaris DNA for the species to be labeled as present).
Site |
1 |
2 |
3 |
4 |
5 |
6 |
7 |
qPCR 1/4 |
0.29 |
0.38 |
0.50 |
0.38 |
0.29 |
1.00 |
0.00 |
qPCR 2/4 |
0.08 |
0.17 |
0.33 |
0.29 |
0.29 |
0.88 |
0.00 |
qPCR 3/4 |
0.04 |
0.13 |
0.17 |
0.21 |
0.25 |
0.63 |
0.00 |
qPCR 4/4 |
0.04 |
0.04 |
0.04 |
0.13 |
0.13 |
0.50 |
0.00 |
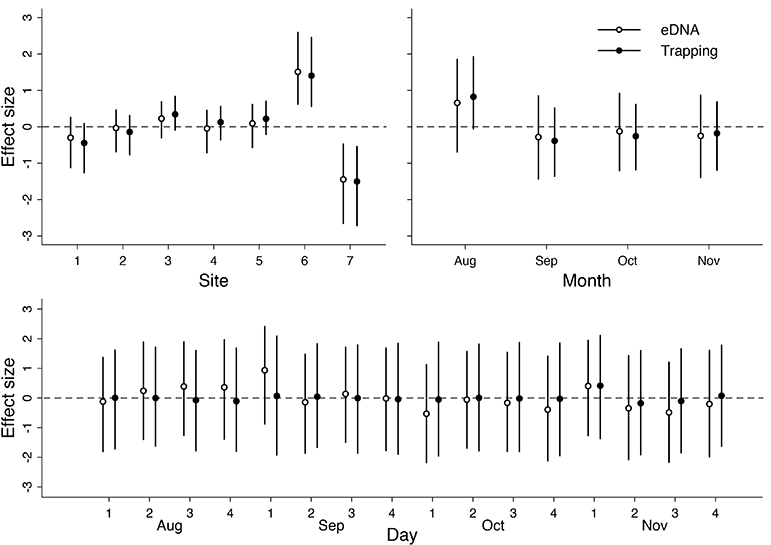
Fig. A1. Mean and 95% credible intervals of the random effects for site, month and day within month, for trapping and environmental DNA methods. Random effect estimates differ from those presented in Fig. 2 because the results presented here are based on the use of a more stringent threshold for declaring species presence (2/4 successful qPCR amplifications).
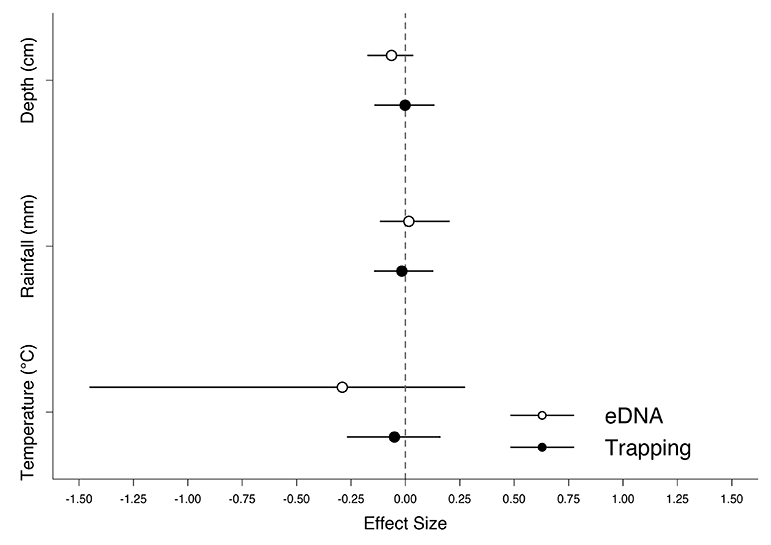
Fig. A2. Mean and 95% credible intervals for regression coefficients describing effects of water depth, rainfall and temperature on detection probabilities of L. v. vulgaris using traps and environmental DNA sampling. Coefficient estimates differ from those presented in Fig. 3 because the results presented here are based on the use of a more stringent threshold for declaring species presence (2/4 successful PCR amplifications).