Ecological Archives A025-120-A1
Jason E. Bruggeman, Ted Swem, David E. Andersen, Patricia L. Kennedy, and Debora Nigro. 2015. Dynamics of a recovering Arctic bird population: the importance of climate, density dependence, and site quality. Ecological Applications 25:19321943. http://dx.doi.org/10.1890/14-1591.1
Appendix A. Table of results for the 41 models of Arctic peregrine population dynamics.
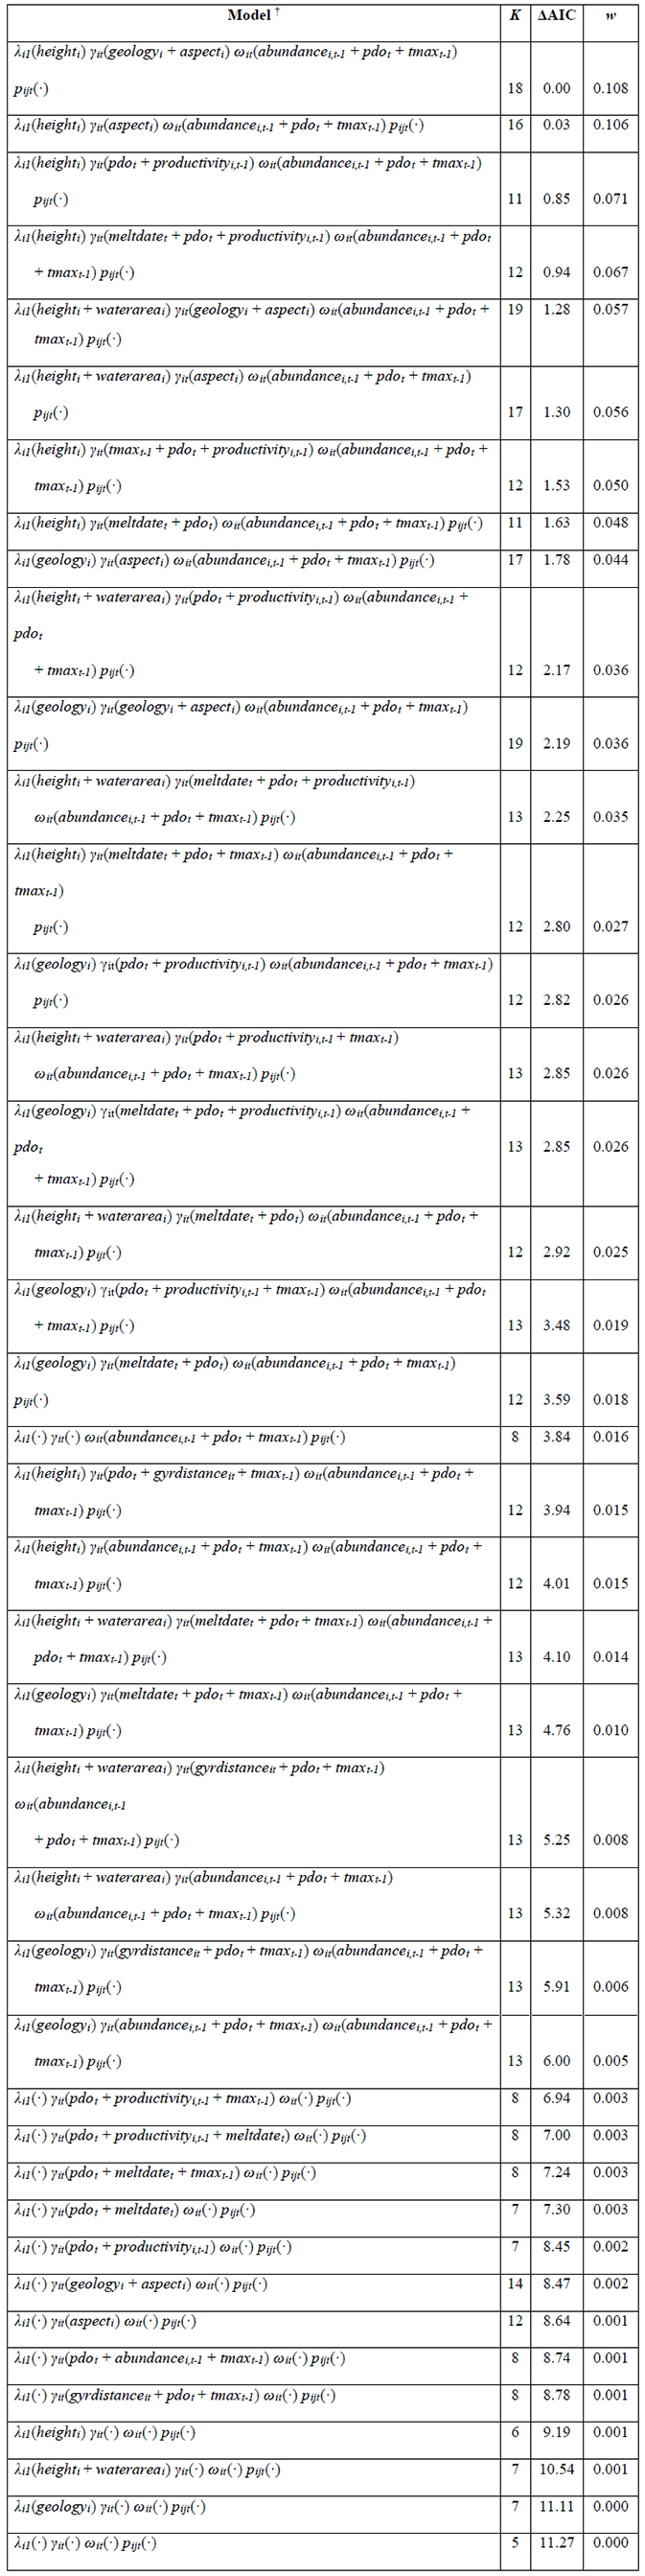
Table A1. Model results from our analysis relating covariates to population dynamics of breeding Arctic peregrine falcons on cliffs along the Colville River, Alaska during 1981 through 2002. Provided for each model are number of parameters (K), delta Akaike’s Information Criterion value (ΔAIC), and Akaike weight (w). The response variable is nijt, total number of adult Arctic peregrines observed at cliff i during survey j of year t. λi1is initial abundance in year one, γit is arrival rate between years t-1 and t, ωit is apparent survival rate between years t-1 and t, and pijt is detection probability. Covariates are defined in the footnote and in Table 2 of the main text; “·” denotes an intercept-only model.
† Definitions of the covariates used in models that are presented in the table are as follows.
abundancei,t-1, maximum total number of adult Arctic peregrines observed on the cliff in year t-1; aspecti, categorical variable denoting average aspect of nest site(s) on the cliff (N, NE, NW, E, SE, S, SW, W); geologyi, categorical variable denoting the surficial geology type of the cliff; gyrdistanceit, distance from cliff i with nesting Arctic peregrines to the nearest occupied gyrfalcon nest in year t; heighti, average height of nest site(s) on the cliff above the Colville River as determined from a GIS DEM; meltdatet, date of snowmelt in year t as determined when snow depth = 0 at the Umiat NOAA station or the first MODIS satellite image that showed no snow cover; pdot, average Pacific Decadal Oscillation (PDO) value for November of year t-1 through March of year t; productivityi,t-1, average number of young observed at nest sites on the cliff in year t-1; tmaxt-1, average maximum daily temperature during May through July in year t-1; waterareai, average total area of water and wetland cover types within 3 km of the cliff.